10.3 Chi-Square Test for Independence
1/12
There's no tags or description
Looks like no tags are added yet.
Name | Mastery | Learn | Test | Matching | Spaced |
|---|
No study sessions yet.
13 Terms
binomial data: What is a chi-square test of independence?
a) A two-dimensional analog to a confidence interval.
b) Two hypothesis tests combined into one table.
c) A hypothesis test for two columns of binomial data.
d) A table to display sample information.
c
binomial data: Select all parts of the Step A: Abstract for a chi-square test of independence?
a) Collect the counts of the data values of the two variables.
b) Collect the sample averages and standard deviations and arrange in a 2x2 table.
c) Arrange in a 2x2 table and calculate the table totals.
d) Write H(0): Chi-square = 0 ; H(1)\: Chi-square ≠ 0.
a, c
binomial data: In Step A: Abstract for a chi-square test of independence, what are the final steps to complete the 2x2 table of descriptive statistics?
a) Calculate the chi-square test statistic.
b) Calculate the Row Totals.
c) Calculate the Column totals.
d) Find the chi-square critical value.
b, d
binomial data: In Step A: Abstract for a chi-square test of independence, what are the two hypotheses?
a) H(0): Chi-square = 0.
b) H(1): Chi-square ≠ 0.
c) H(0): Variables are independent.
d) H(1): Variables are dependent.
c, d
binomial data: In Step 1: Theorize for a chi-square test of independence, what are the shapes of the chi-square distributions?
a) The curve is uni-modal.
b) The curve is skewed to the right.
c) Either no mode, or bi-modal, depending on the degrees of freedom.
d) The curve is symmetrical.
a, b
binomial data: In Step 1: Theorize for a chi-square test of independence, how many tail(s) situation is this?
a) One-tail to the left situation.
b) A two-tail situation.
c) The chi-square curve does not have tails.
d) One-tail to the right situation.
d
binomial data: Select all parts of the Step 2: Analyze for a chi-square test of independence?
a) Calculate the value of the chi-square test statistic.
b) Calculate the row and column totals.
c) Make a conclusion to reject the null hypothesis or not.
d) Calculate each cell's expected frequency.
a, d
binomial data: In Step 2: Analyze for a chi-square test of independence, what are the expected frequencies?
a) The count in each cell expected before the data was analyzed.
b) A check on the row and column totals.
c) The theoretical count in each cell if the variables are independent.
d) A theoretical top, or bottom, limit on the counts in each cell.
c
binomial data: What is the difference between a descriptive 2x2 table of counts, and a contingency table?
a) The 2x2 table of counts shows the row and column totals.
b) A contingency table shows the expected frequencies in each cell.
c) The only difference is in how they are used.
d) A 2x2 table of counts has four cells, while a contingency table has more cells.
b
binomial data: In a chi-square test of independence, what is the p-value?
a) The area in one tail of the chi-square curve from the test statistic to infinity.
b) The area in two tails of the chi-square curve from the test statistic.
c) The area in one tail of the chi-square curve from the critical value to infinity.
d) The area in the chi-square curve from the critical value to the test statistic.
a

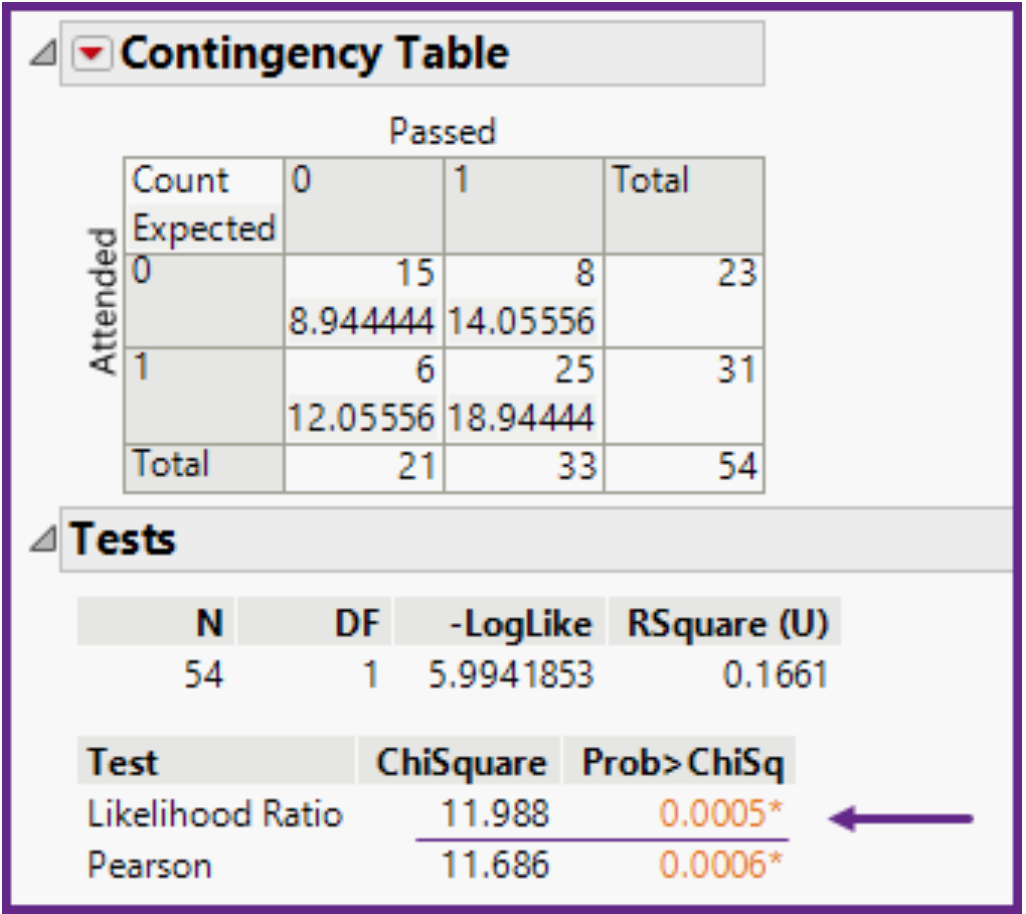
binomial data: In a chi-square test of independence, using the information shown below, are these two variables independent?
a) These variables are independent, because p-value = 0.005.
b) These variables are independent, because the chi-square test statistic = 11.988.
c) These variables are dependent, because attending lectures helps to pass the class.
d) These variables are dependent, because p-value = 0.005.
d

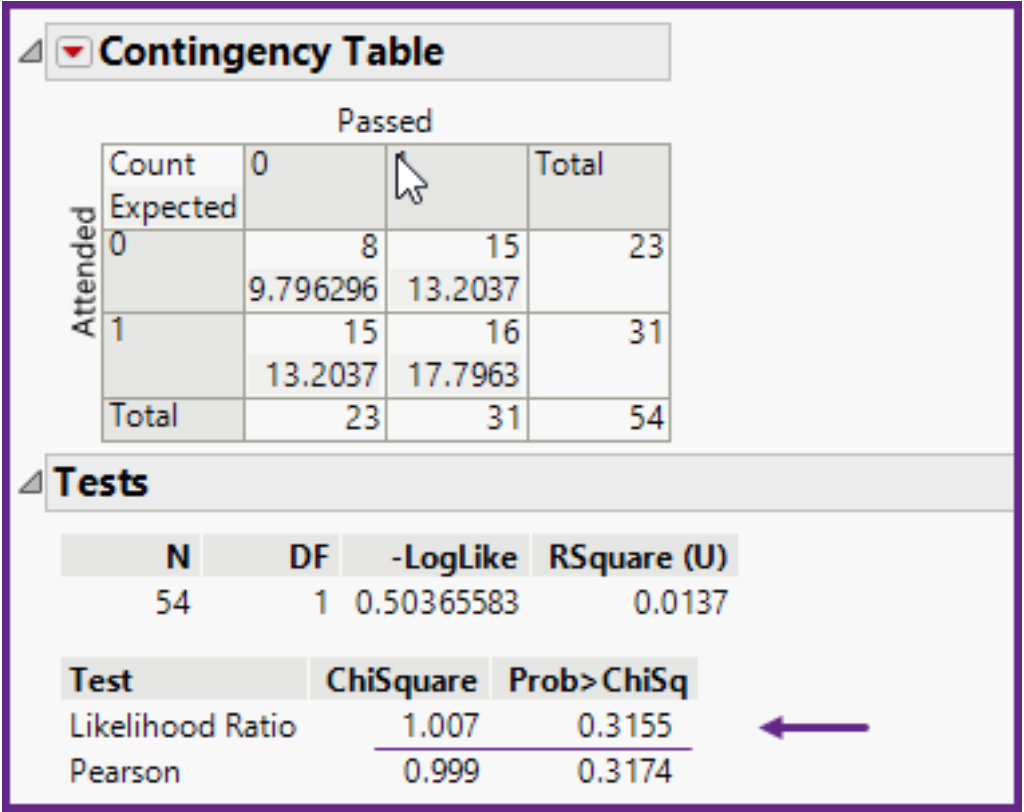
binomial data: In a chi-square test of independence, using the information shown below, are these two variables independent?\
a) These variables are dependent, because the null hypothesis was rejected.
b) These variables are dependent, because chi-square = 1.007.
c) These variables are independent, because p-value = 0.3155.
d) These variables are independent, because chi-square = 1.007 is bigger than the critical value = 0.999.
c

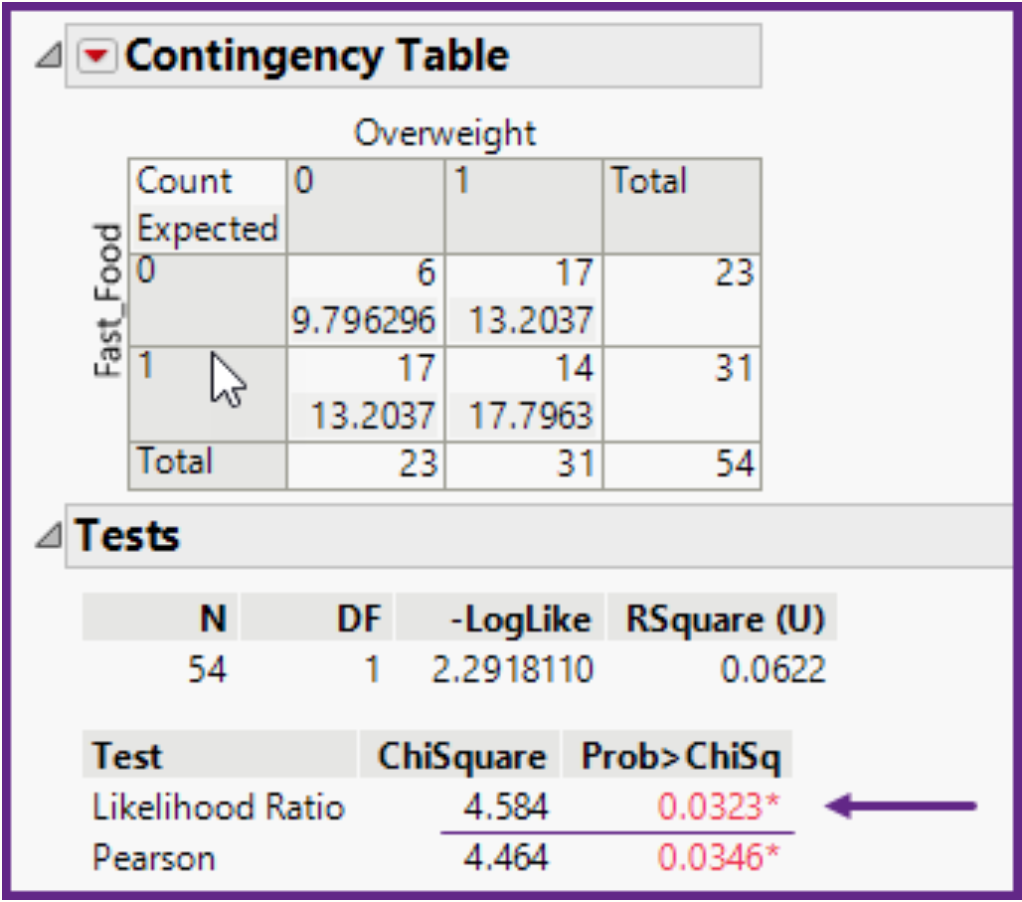
binomial data: In a chi-square test of independence, using the information shown below, is being overweight related to eating fast food?
a) Yes, being overweight and eating fast food are related, because the column totals are the same as the row totals.
b) Yes, being overweight and eating fast food are related, because the expected count in three cells are greater than 10.
c) Yes, being overweight and eating fast food are related, because p-value = 0.0323.
d) No, being overweight and eating fast food are not related, because RSquare = 0.0622 is too low.
c