HASS10 Economics
 Call Kai
 Learn
Learn Practice Test
 Spaced Repetition
 Match
Match Flashcards
 Knowt Play
1/43

There's no tags or description
Looks like no tags are added yet.
Name | Mastery | Learn | Test | Matching | Spaced | Call with Kai | Chat |
|---|
No analytics yet
Send a link to your students to track their progress
44 Terms
Economic Development and Wellbeing
Countries can be classified according to level of economic wealth and development into:
More Economically Developed Countries: Wealthier, higher living standards
Less Economically Developed Countries: Poorer, lower standards of living.
Wellbeing
ability of people to access the things they need to live happy lives.
Eg
Fresh water
Food
Clothing
Shelter
Safety
strong correlation between economic growth and wellbeing.
Gross Domestic Product (GDP)
total monetary value of all final goods and services produced in a country in one year.
commonly used to measure a country's level of economic development.
Generally, higher GDP, more developed
However, GDP should not be the only measure bc a country can have a high GDP but still be considered developing (e.g. China).
GDP per Capita
calculated by dividing GDP/population.
estimates the average amount of wealth for each person.
better indicator of economic development than GDP
Employment by Economic Sector
percentage of workers employed in diff sectors indicates country's development.
Primary sector- industries that produce raw materials:
Farming
Fishing
Forestry
Mining
Less developed countries usually have most workers in the primary sector.
More developed countries have more workers in:
Secondary industries: Manufacturing
Tertiary industries: Services
Demographic Indicators
measure characteristics of a country's population.
used to assess development.
Calorie intake
Life expectancy
Education
Medical facilities
Calorie Intake (Diet)
measures daily nutrition.
Developed countries- have higher, Developing countries- lower calorie intake.
The average adult requires around 2,000 calories per day.
Life Expectancy
predicted number of years a person is expected to live.
Developed countries usually higher, Less developed countries generally lower life
Women in developing countries- lower life expectancy than men bc childbirth deaths
Education
High school and uni enrolments- much greater in developed nations.
In many developing countries:
Female students are often outnumbered by males.
Cultural beliefs may see women's role primarily as homemakers.
Medical Facilities
generally much better in developed countries. have
More doctors
Better hospitals
More advanced healthcare
Less developed countries have fewer doctors and less advanced hospitals.
Australia: 1 doctor per 244 people
South Sudan: 1 doctor per 23,000 people
Economics
the study of how individuals, businesses, governments and societies allocate scarce (limited) resources to satisfy needs and wants.
needs
essential for survival.
limited
Food
Water
Shelter
Clothing
wants
not essential for survival.
Wants are unlimited.
improve comfort and quality of life.
Cars
Computers
Mobile phones
Vary from individuals, societies, age
Change over time.
Can reoccur.
May generate another want.
Eg- Buying a car creates the need for fuel.
Economic Problem
Human wants are unlimited.
Resources are limited.
Therefore, people and societies must make choices about how resources are used.
It is fundamentally a problem of choice.
Factors of Production
resources.
Inputs used to produce goods and services.
Four factors:
Land- natural resources, the land and everything that comes from it
Labour- work, physical- manual bricklayer, intellectual- mental, doctor
Capital- machinery/equipment used- oven
Enterprise - ability organise other factors, to maximise profit, efficiency
Law of Supply/ Law of Demand
Consumers generally aim to buy goods and services at the lowest price, producers aim to sell at the highest price
Law of Demand- as price of a good or service decreases, demanded increases.
Law of Supply -as the price of a good or service increases, quantity supplied increases.
Goods and Services
Goods- tangible items, cars
Services- actions that generally benefit consumer, doctors
Relative Scarcity
there is not enough of a good, service or resource compared to demand.
Occurs bc
Wants are unlimited.
Resources are limited.
Greater scarcity= higher prices.
Opportunity Cost
the next best alternative given up when making a choice.
refers to the potential benefits missed when choosing one option over another.
Microeconomics**************
study of individual consumers, households and businesses and how they make decisions about using limited resources.
focuses on individual markets and topics such as:
Supply and demand
Pricing
Competition
Consumer behaviour
Businesses use to make decisions about pricing, production and marketing.- determined by the interaction between buyers and sellers in a market.
Macroeconomics
studies the economy as a whole, national and global economic performance. large-scale issues such as:
Economic growth
Inflation
Unemployment
Interest rates
International trade
Govs and central banks use info to develop policies that keep economy stable- manage inflation, employment and economic growth.
Eg: During recession, gov may increase spending on roads, creating jobs
Circular Flow of Income Model
explains the interactions between sectors
highlights how money and resources move through the economy and maintain economic stability and growth.
Role of Households
Households:
Represent consumers.
Own the factors of production:
Labour
Land
Capital
Enterprise (entrepreneurship)
Provide these factors of production to firms.
Receive income in return.
Spend their income on goods and services.
Role of Firms
Firms:
Produce goods and services.
Use the factors of production supplied by households.
Pay households:
Wages
Salaries
Rent
Interest
Dividends
Sell goods and services to households.
Receive revenue from these sales.
Real flow
represents the physical movement of:
Factors of production from households to firms.
Goods and services from firms to households.
Monetary flow
represents the movement of money:
Households receive income for providing factors of production, spend income on goods and services.
Firms receive revenue from sales, use to pay households for factors of production.
Financial Sector
includes:
Banks
Insurance companies
Superannuation funds
Australian Securities Exchange (ASX)
links by allowing funds to flow
helps with the efficient allocation of resources
Households:
Save part of their income in financial institutions.
Firms:
Borrow money for investment.
Government Sector
Collects taxes
Provides public goods and services-
Infrastructure
Education
Security
Makes transfer payments
Creates additional flows of money
Overseas sector
Exports
GS sold by Aus businesses to overseas consumers.
bring money in
Imports
GS purchased by Aus from overseas producers.
money leave Aus
affects:
Exchange rates.
Global economic connections.
Leakages, Injections and Equilibrium
Leakages- remove money
Savings- reduce spending
Taxes
Imports
Injections- add money
Investment:
Government spending: infrastructure
Exports:
Equilibrium when leakages equal injections
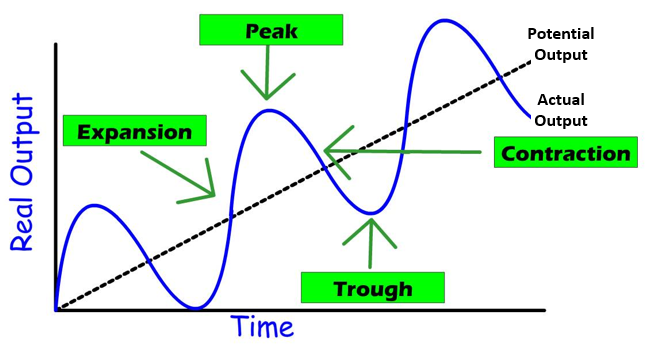
Business Cycle
shows the rise and fall of real Gross Domestic Product (GDP) over time.
Expansion
Peak
Contraction
Trough
affect:
Employment
Consumer spending
Business investment
Wages
Inflation
Australia's Long-Term Economic Growth, ABS and Financial Year
Aus productive capacity averaged- 2.5–3%
The Australian Bureau of Statistics measures Australia's GDP.
generally reports GDP figures quarterly- every three months.
financial year runs from 1 July to 30 June of the following year.
Expansion
economy grows.
Households spend more
Businesses increase production to meet higher demand
Unemployment decreases.
Wages generally increase
Prices rise bc high demand
Consumer confidence high.
Spending and investment grow.
usually the longest phase
Peak
highest point of economic activity before growth begins to slow.
economy operates close to its maximum productive capacity.
Employment high.
string business profit
high spending
Inflationary pressures
To control inflation, RBA may increase interest rates to reduce spending.
Contraction
downswing of the business cycle towards a trough
Economic activity declines.
Households reduce spending.
Businesses experience lower sales, reduce production
Investment decreases
Unemployment rises.
Wage growth and inflation slows.
Trough
lowest point
Economic activity is at its weakest.
low spending
Business investment is reduced.
Unemployment high.
marks the beginning of economic recovery.
Economic boom
economy grows at an unusually fast rate for an extended period.
Output increases rapidly.
Employment, income, spending increases.
Although creates prosperity, can also cause excessive inflation
Recession
when economic growth falls for two or more consecutive quarters (six months or more).
Household incomes fall.
Unemployment and business failures increases
Govs and central banks often take action to support economic recovery.
Depression
more severe
usually lasts two years or more.
Large fall in economic activity.
Very high unemployment.
Widespread business failures.
Long-lasting economic hardship.
rare but much greater impacts than recessions.
Economic Growth
an increase in the productive capacity of an economy.
occurs when a country's real GDP increases.
means more goods and services are produced over time.
Growth Rate =
GDP Current Year - GDP Previous Year/GDP Previous Year. ×100

Real GDP
is the total market value of all final goods and services produced in an economy after adjusting for inflation.
a more accurate measure of economic growth bc inflation has been removed.
If increases: economy is growing.
If decreases:contracting.
should be considered alongside broader indicators of social and environmental wellbeing.
Importance of Economic Growth
Improves living standards.
Creates employment
Increases household incomes.
Generates gov revenue.
Allows gov to fund public services.
Advantages of economic Growth
Raises national income.
households to receive higher wages, improved living standards.
Reduces unemployment.
Increases consumer spending, gov tax revenue.
Allows gov invest more in:
Infrastructure
Education
Healthcare
Social welfare
Encourages business investment, tech innovation, productivity improvements.
Makes firms more competitive
Disadvantages of Economic Growth
Can
pressure on natural resources.
environmental degradation.
pollution.
climate change
increase income inequality
inflation
urban congestion.
increase housing costs.