AP Psych Unit 2 Vocab
1/38
There's no tags or description
Looks like no tags are added yet.
Name | Mastery | Learn | Test | Matching | Spaced |
|---|
No study sessions yet.
39 Terms
theory
an explanation using an integrated set of principles that organizes and predicts observations
an idea or set of ideas that is intended to explain facts or events
scientifically tested and proven
based on a wide range of data

hypothesis
a testable prediction
proposed explanation for some phenomenon based on limited evidence
not scientifically tested or proven
based on limited data

operational definition
a statement of the procedures used to define research variables; how you intend to measure the dependent variable
ex: intelligence: IQ test

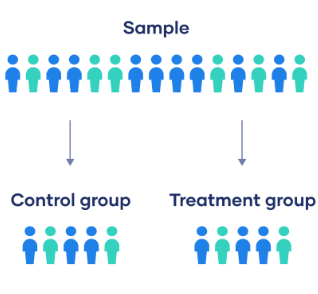
control group
in an experiment, the group that is not exposed to the treatment; contrasts with the experimental group and serves as a comparison for evaluating the effect of the treatment
does not receive the independent variable

experimental group
in an experiment, the group that is exposed to the treatment, that is, to one version of the independent variable
does receive the independent variable

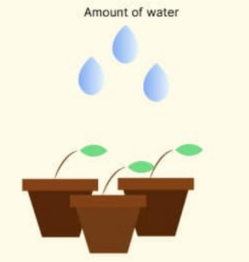
independent variable
the experimental factor that is manipulated--the variable whose effect is being studied
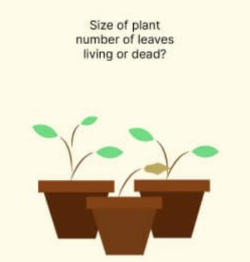
dependent variable
the outcome factor -- the variable that is measured and may change in response to manipulations of the independent variable
confounding variable
a factor other than the independent variable that might produce an effect in an experiment that influences the dependent variable
ex: mold on a blueberry
case study
an observation technique in which one person is studied in depth in the hope of revealing universal principles
investigates one individual or group of individuals
welcomes data collected through any and all methods
naturalistic observation
observing and recording behavior in naturally occurring situations without trying to manipulate and control the situation
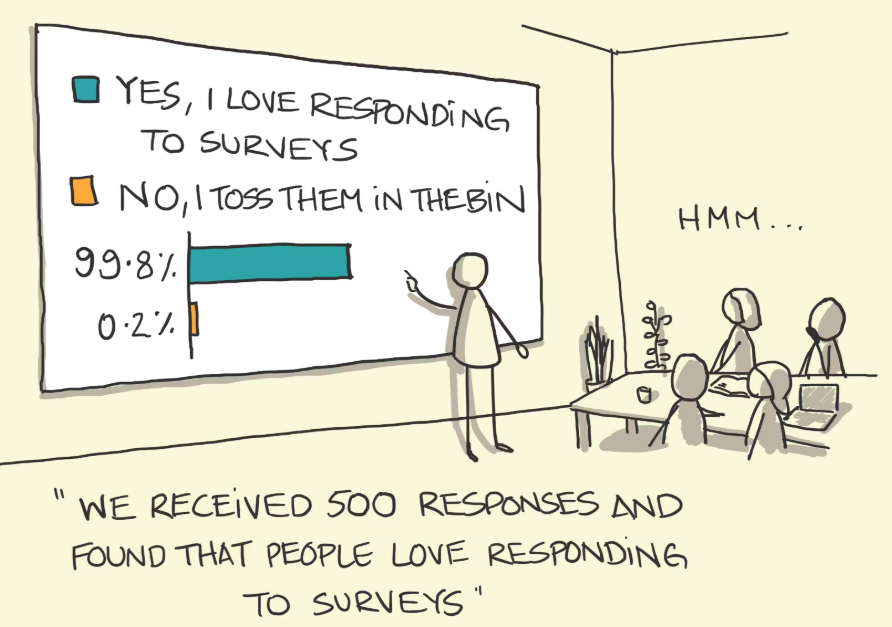
survey
a technique for ascertaining the self-reported attitudes or behaviors of people, usually by questioning a representative, random sample of them
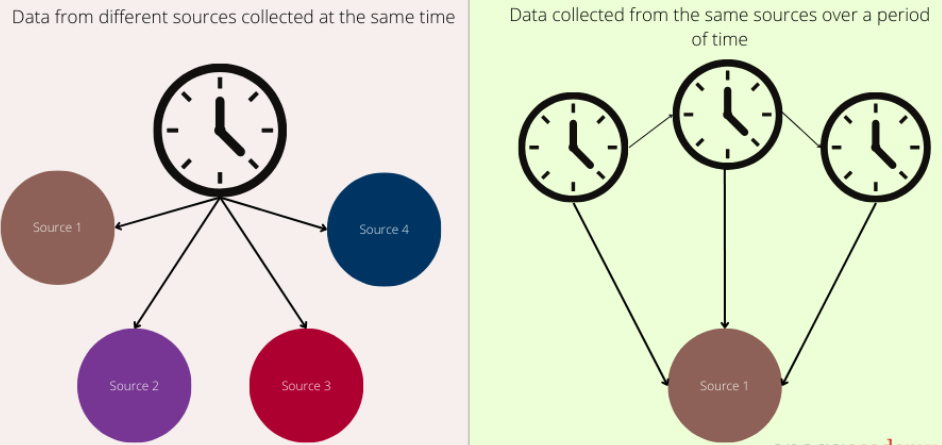
cross sectional study vs. longitudinal study
one method compares two groups at one specific period in time
the other method follows the same person or group of people (often referred to as a cohort) over a period of weeks, months, or even years, testing people at the beginning, end, and various points in between.
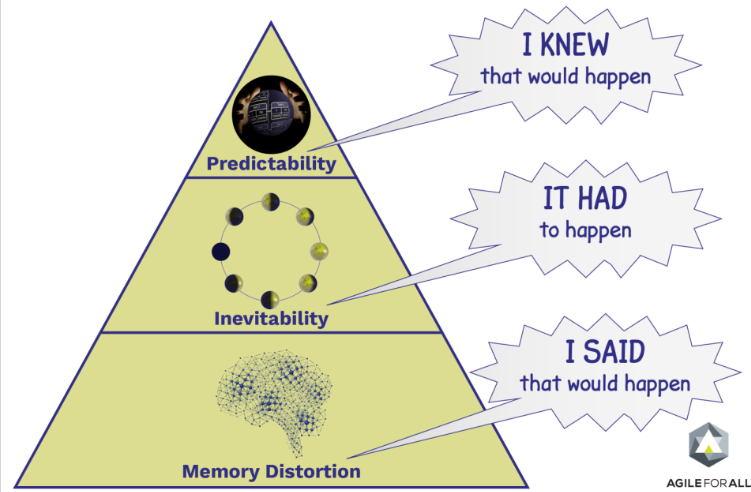
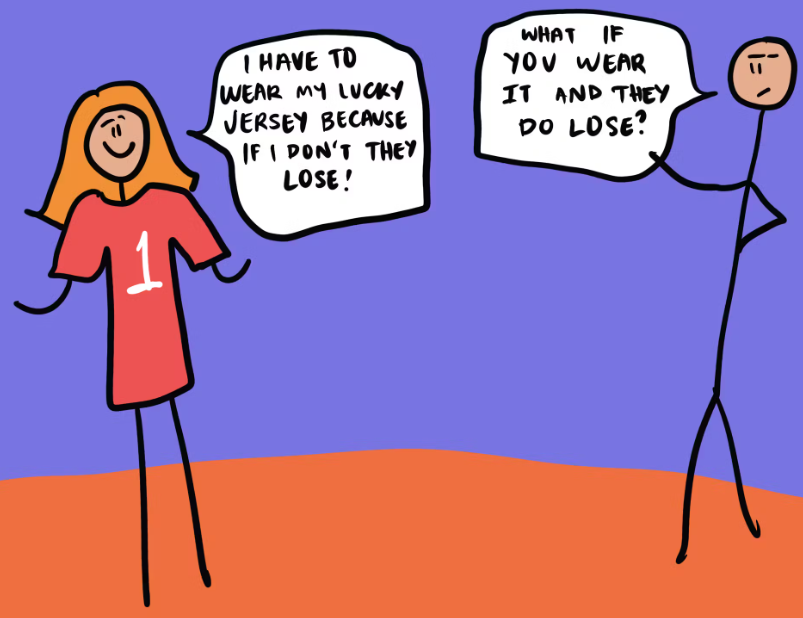
hindsight bias
the tendency to believe, after learning an outcome, that you knew that all along
subjective self report
a method where individuals describe their own internal experiences, feelings, and thoughts
overreliant on self-perception, inaccurate self reports, and subjective and biased

demand characteristics
cues that might indicate the aim of the study to participants
can lead participants to change their behaviors or responses based on what they think the research is about
problematic because they can bias research findings
sampling bias
occurs when sample is not random or representative. validity of experiment results is compromised.
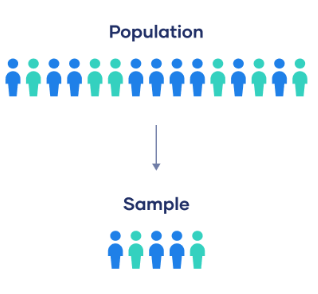
population vs. sample
one refers to the entire group of individuals or objects that are the focus of a study
another is a subset of the other that is selected for observation and analysis
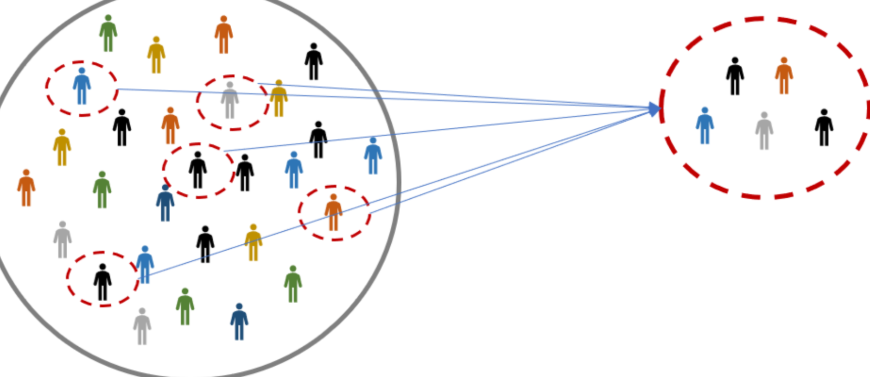
random sample
a sample that fairly represents a population because each member has an equal chance of inclusion
representative sample
a subset of a larger population that accurately reflects the characteristics of the whole population
like a mini-version of the population, with the same proportions and distributions of key features
random assignment
assigning participants to experimental and control conditions by chance ,thus minimizing preexisting differences between those assigned to the different groups
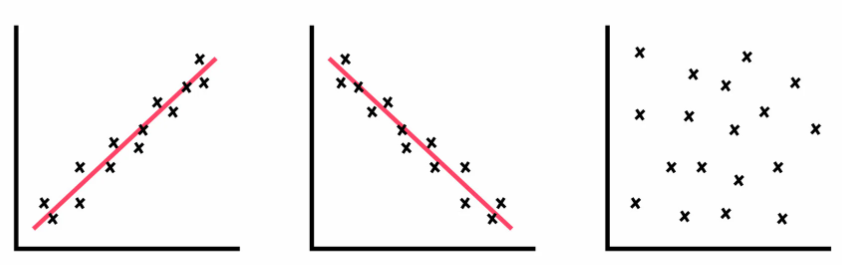
correlation (pos and neg)
a measure of the extent to which two factors vary together, and thus of how well either factor predicts the other
positive means that two variables operate in unison so that when one variable rises or falls, the other does the same.
negative means that two variables move opposite one another so that when one variable rises, the other falls.
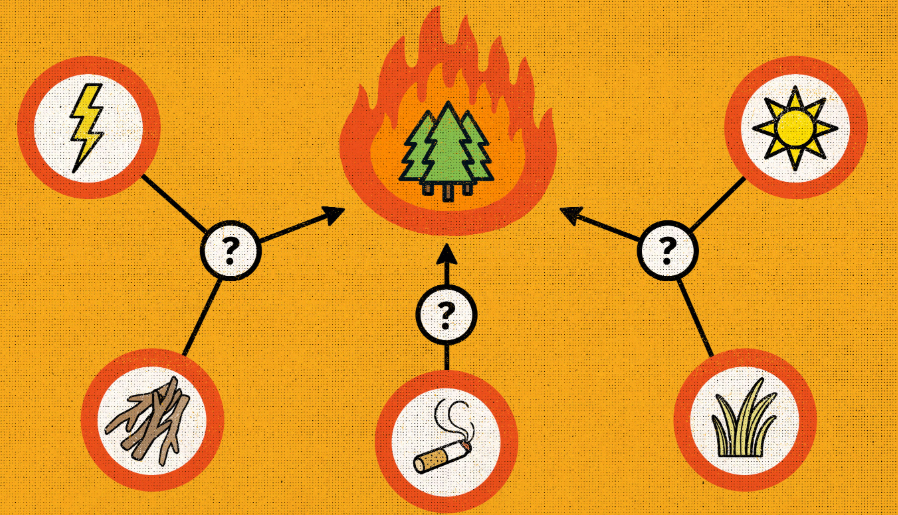
causation
one event or variable (the cause) leads to a change in another event or variable (the effect
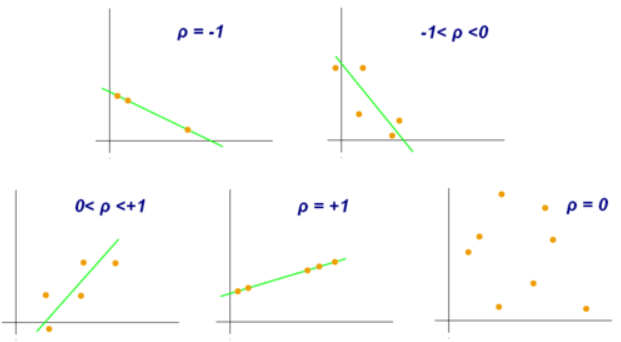
correlation coefficient
a statistical index of the relationship between two things (from -1 to +1)
illusory correlation
the perception of a relationship where none exists
reliability
the consistency of a measurement or test
how likely are the results reproducible if the test is administered again under similar conditions?
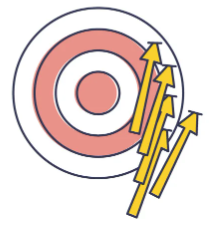
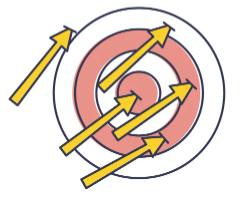
validity
the extent to which a test or experiment measures or predicts what it is supposed to
internal validity vs. external validity
one focuses on whether a study’s results accurately reflects the casual relationship between variables within the study itself
the other assesses the extent to which those findings can be generalized to other populations, settings, and situations

content validity
extent to which a test or measurement covers all relevant parts of the construct it aims to measure

single vs. double-blind procedure
one method has participants unaware which study group they are in
the staff directly interacting with the participants are aware of the group assignments
the other has both the participants and the staff unaware of the study groups
this one reduces bias by preventing the staff’s knowledge from influencing their interactions with the participants or the interpretation of the results

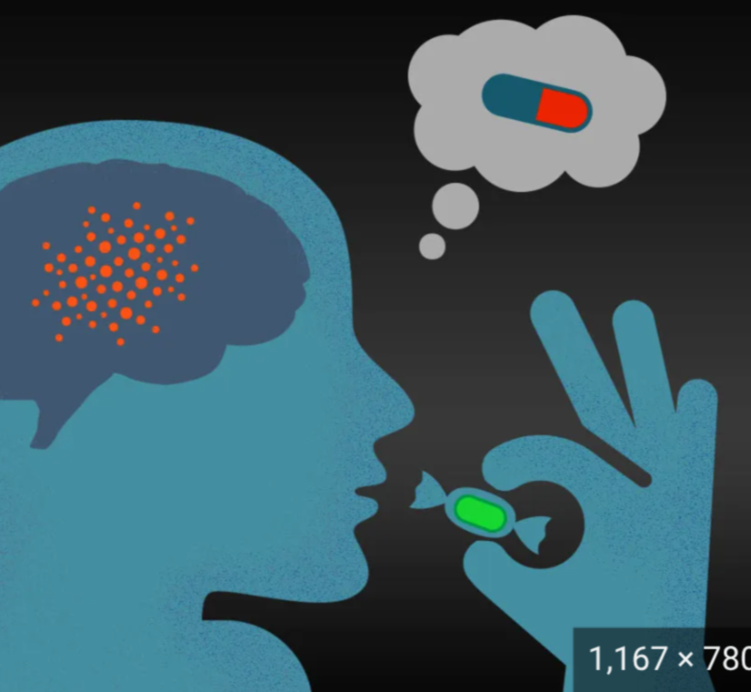
placebo effect
any effect that seems to be a consequence of administering a sugar pill
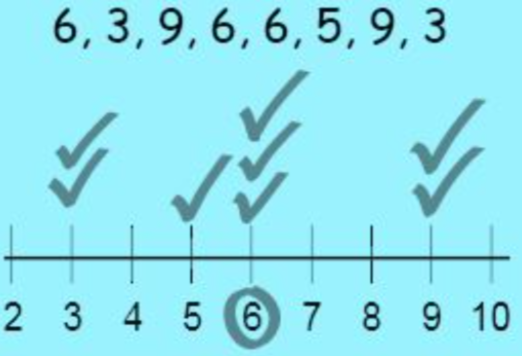
mode
The most frequently occurring score(s) in a distribution
mean
the arithmetic average of a distribution, obtaining by adding the scores and then dividing by the number of scores

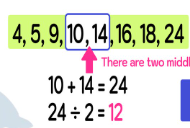
median
the middle score in a distribution--half the scores are above it and half are below it
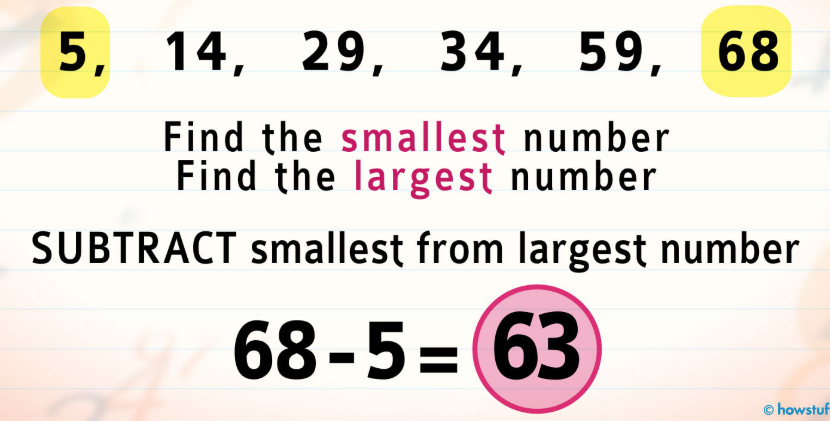
range
the difference between the highest and lowest scores in a distribution
standard deviation
a computed measure of how much scores vary around the mean score
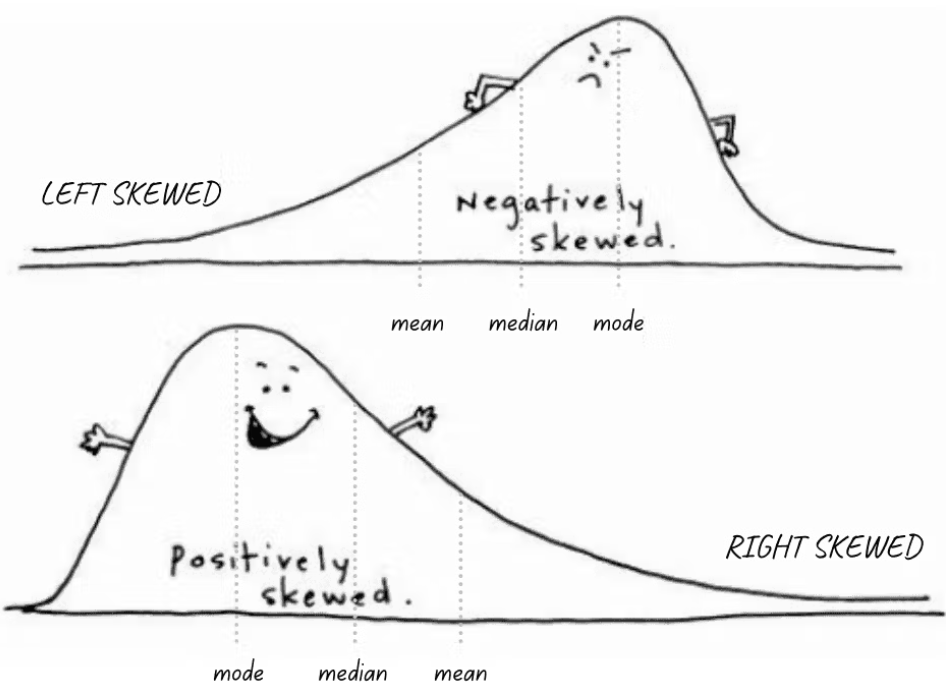
skewed distribution
a statistical term that describes the shape of a set of data in which the values are not evenly distributed around the mean
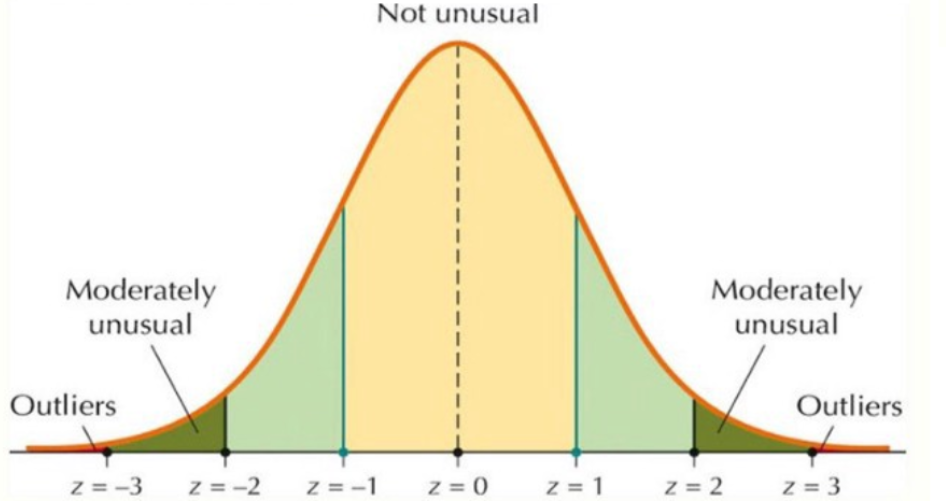
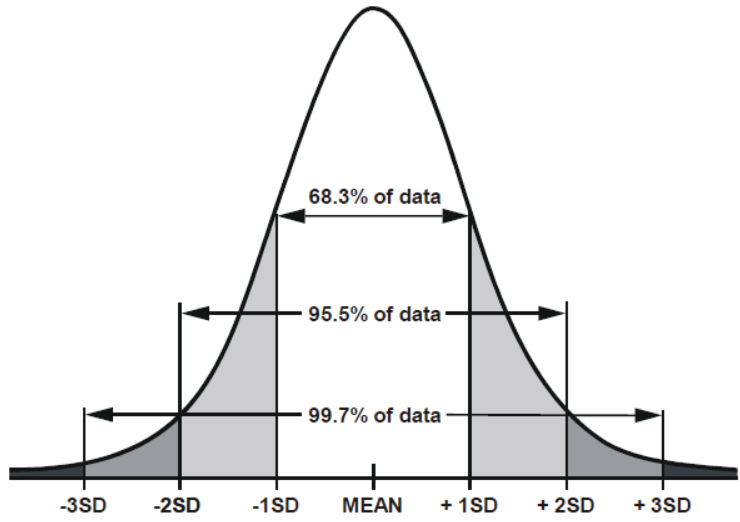
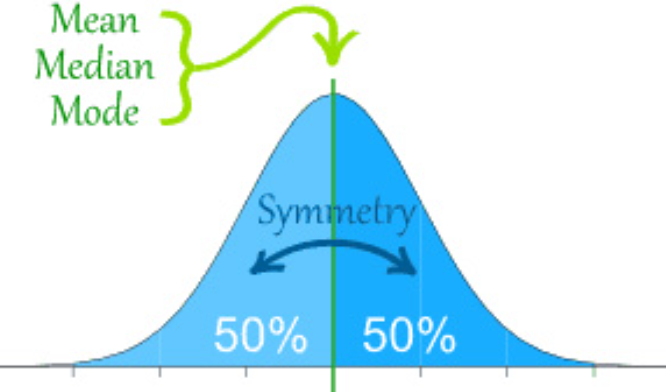
normal curve
a symmetrical, bell-shaped curve that describes the distribution of many types of data; most scores fall near the mean (68% fall within one standard deviation of it) and fewer near the extremes
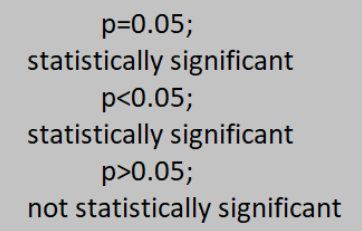
statistical significance
a statistical statement of how likely it is that an obtained result occurred by chance
Z score (standard score)
a statistical measure that quantifies how many standard deviations a data point is away from the mean (average) of a dataset