market failure - negative externalities
 Call Kai
 Learn
Learn Practice Test
 Spaced Repetition
 Match
Match Flashcards
 Knowt Play
1/33

There's no tags or description
Looks like no tags are added yet.
Name | Mastery | Learn | Test | Matching | Spaced | Call with Kai | Chat |
|---|
No analytics yet
Send a link to your students to track their progress
34 Terms
efficiency
efficiency is the key criterion used to assess the performance of markets
market failure: failure of the free market to allocate resources efficiently
allocative efficiency is achieved when:
resources are allocated to produce the combination of goods and services most wanted by society ⇒ when there is allocative efficiency, social welfare is maximised
sum of consumer and producer surplus is at its maximum
MSB = MSC
social welfare for most forms of market failure → negative externalities, positive externalities and information failure
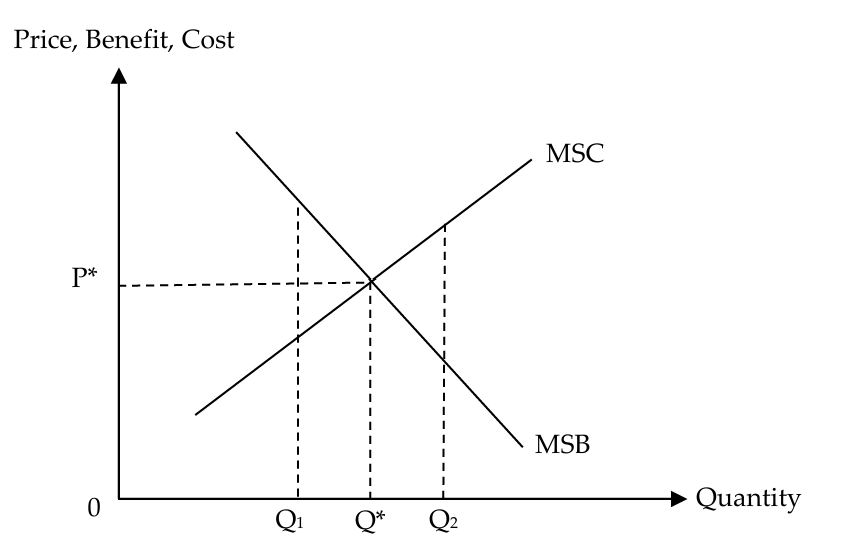
compare marginal social benefit (MSB) and marginal social cost (MSC)
MSB: additional benefit to society from the consumption or production of an additional unit of a good or service
MSC: additional cost to society from the consumption or production of an additional unit of a good or service
using the marginalist principle, the good will be consumed or produced at Q*, where MSB = MSC, maximising social welfare
Q* is known as the socially optimal quantity
producing at Q1 where MSB > MSC or Q2 where MSC > MSB ⇒ deadweight loss for the society and hence a lower
level of social welfare
differences from a demand and supply diagram
y-axis also includes benefit and cost
take the perspective of consumers when analysing consumption activities, and take the perspective of producers when analysing production activities
instead of a supply curve, it is the MSC curve
when studying the decision of firms: includes the cost of production of the good + any other costs incurred by society from the production of the good
when studying the decision of consumers: includes the cost of purchasing the good + any other costs incurred by society from the consumption of the good
instead of demand curve, it is the MSB curve
when studying the decision of consumers: includes the utility that consumers gain from the good + any other benefits gained by society from consumption of the good
when studying the decision of firms: includes the revenue that producers gain from producing the good + any other benefits gained by society from the production of the good
decision-making process by consumers
consider private benefits and costs → enjoyed and incurred by consumers themselves
marginal private benefit (MPB): additional benefit to consumers (or producers) from the consumption (or production) of an additional unit of a good or service
marginal private cost (MPC): additional cost to the consumers (or producers) from the consumption (or production) of an additional unit of a good or service
using marginalist principle, consumers will consume Qp units, where MPC = MPB ⇒ Qp is the private optimal quantity
when there is no market failure, the marginal social and marginal private curves coincide ⇒ private optimal quantity Qp (where MPB = MPC) is also the socially optimal quantity Qs (where MSB = MSC)
negative externalities → definition
negative externalities/external costs, of a good or service are the spillover costs to third parties who are not directly involved in the consumption or production of the good or service itself
costs are not internalised (i.e. taken into account) by the consumers or producers of the good in the market
borne by the third parties who are not involved in the consumption or production of the good or service
negative externalities
express social costs (total cost to all members of society) = sum of private costs (total cost to the decision-makers → consumers or producers) and external costs (total cost to others → third parties)
marginal external cost (MEC): additional cost to third parties from the consumption (or production) of an additional unit of a good or service
MSC = MPC + MEC
negative externalities in production
producers will consider their private costs (e.g. wages paid) and private benefits (e.g. greater revenue)
however, the production process may result in external costs incurred by third parties, which are all ignored by the producers when making production decisions
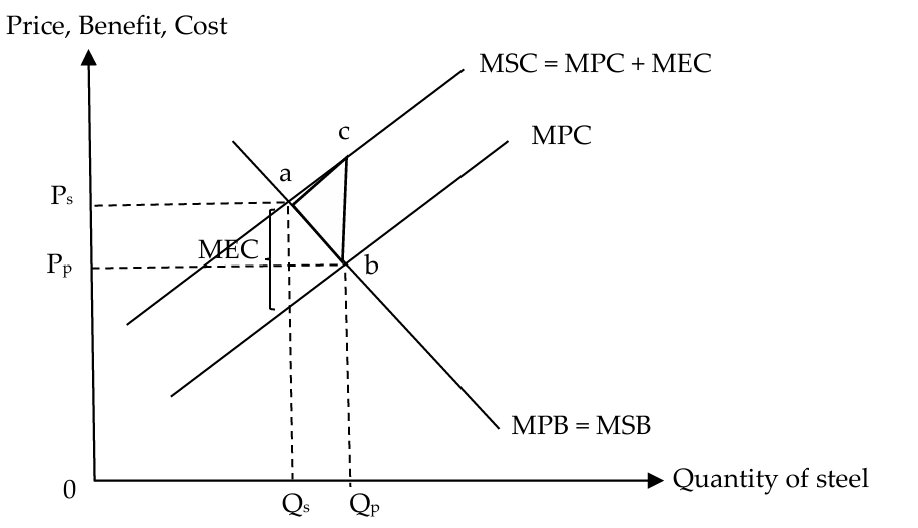
the presence of marginal external cost (MEC) creates a divergence between the marginal social cost (MSC) and marginal private cost (MPC), where MSC > MPC
the MSC curve lies above the MPC curve by the amount of the
MEC, and assuming that there are no positive externalities, the
marginal private benefit (MPB) = marginal social benefit (MSB)if left to the free market, the firms produce Qp units, where MPB=MPC as they only consider their own private costs and benefits, however, the socially optimal level of production is Qs units, where MSB=MSC
since Qp > Qs, there is an overproduction of steel and an over-allocation of resources to the production of it
at Qp, MSC > MSB → the additional unit of output adds more to society’s costs than to society’s benefits
from Qp to Qs units, the total social costs (area QsacQp) exceed the total social benefits (area QsabQp)
area abc represents the deadweight loss which is the welfare loss to society when output is not produced at the socially optimal level
there is market failure as the private optimal quantity of Qp is allocative inefficient and social welfare is not maximised
since the external costs are not factored in the decision-making of producers there is distortion of price signals ⇒ price mechanism hence fails to bring about a socially optimal allocation of resources, resulting in an over-allocation of resources in this case
negative externalities in consumption
consumers will consider their private costs and private benefits
however, the consumption may result in external costs borne by third parties, which are all ignored by the consumers when making consumer decisions
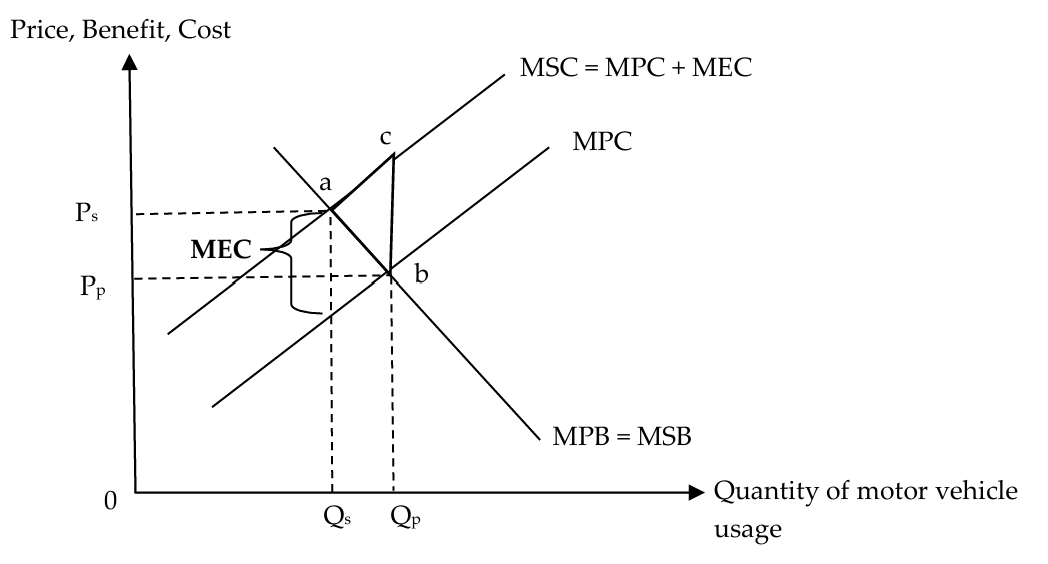
the presence of marginal external cost (MEC) creates a divergence between the marginal social cost (MSC) and marginal private cost (MPC), where MSC > MPC
MSC curve lies above the MPC curve by the amount of the
MEC, and assuming that there are no positive externalities, the marginal private benefit (MPB) = marginal social benefit (MSB)
if left to the free market, the consumers consume Qp units, where MPB = MPC as they only consider their own private costs and benefits, however, the socially optimal level of consumption is Qs units, where MSB = MSC
since Qp > Qs, there is an overconsumption of motor vehicle usage, and an over allocation of resources to the consumption of it
at Qp, MSC > MSB → additional unit of motor vehicle usage adds more to society’s costs than to society’s benefits
from Qp to Qs units, the total social costs (area QsacQp)
exceeds the total social benefits (area QsabQp)
area abc represents the deadweight loss which is the welfare loss to society when motor vehicle usage is not at the socially
optimal level ⇒ market failure as the private optimal quantity is allocative inefficient and social welfare is not maximisedsince the external costs are not factored in the decision-making in the consumption, there is distortion of price signals ⇒ price mechanism hence fails to bring about a socially optimal allocation of resources, resulting in an over allocation of resources in this case
government intervention for negative externalities → indirect taxes
governments can intervene by levying taxes on activities that generate external costs on third parties to make producers or consumers internalise (take into account) the negative externalities
taxes incentivise producers and consumers to reduce production and consumption by forcing them to internalise the negative externalities in their decision making
if firms are taxed due to pollution from their production activity, the higher cost of production encourages firms to reduce output and hence the pollution generated, or to find cleaner ways of production
consumers are incentivised to reduce their consumption of the good that generates negative externalities and are encouraged to turn to alternatives instead
government intervention for negative externalities → indirect taxes in context of production activities
the government can levy an indirect tax on the producers leading them to face higher private costs
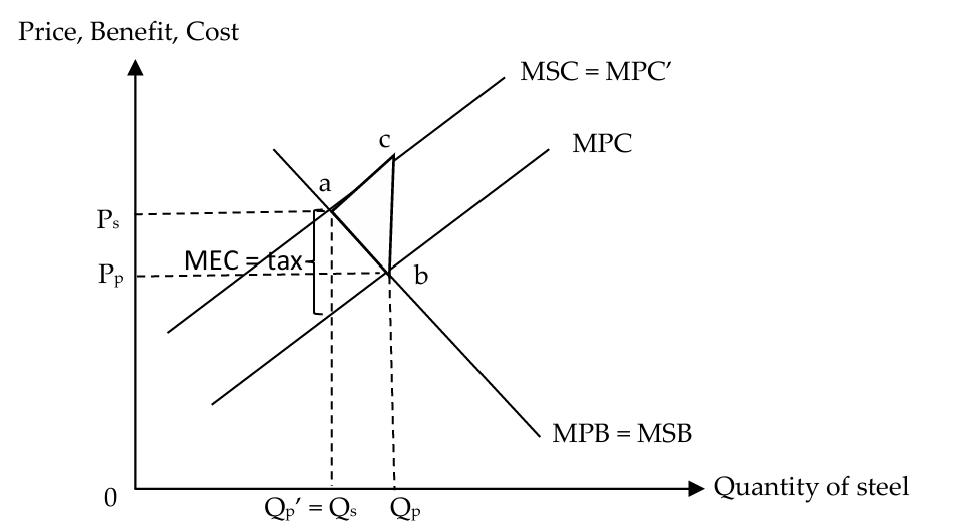
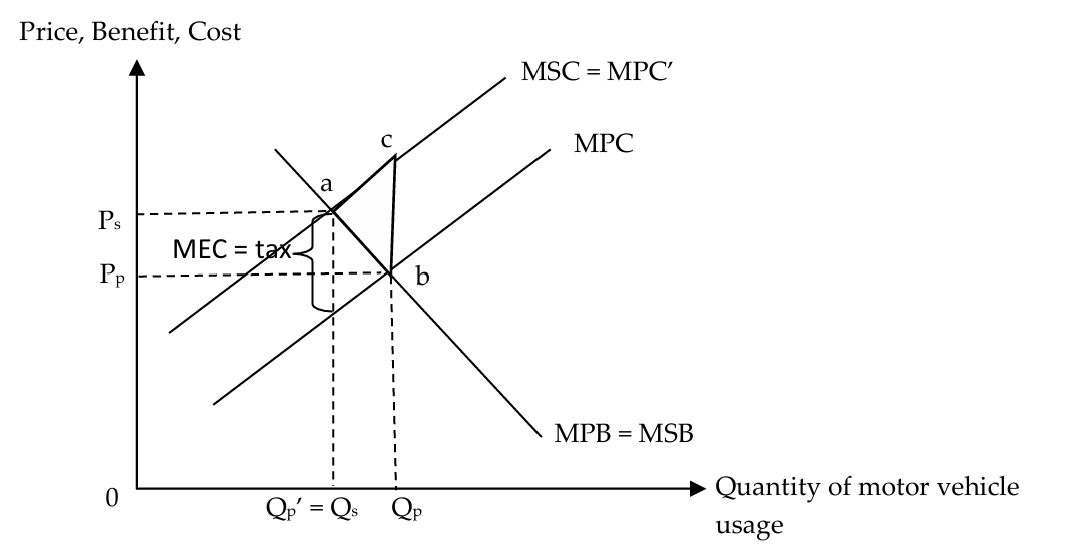
levying an indirect tax equal to the amount of marginal external cost (MEC) at the socially optimal level of output Qs (i.e. t = MEC at Qs) will lead to a rise in MPC of producing by that amount, forcing producers to internalise the MEC to third parties ⇒ upward shift of the MPC curve by the amount of the tax from MPC to MPC’
outcome of levying the tax is that the new private optimal quantity Qp’ (where MPB = MPC’) now coincides with the socially optimal quantity Qs (where MSB = MSC)
fall in production from Qp to Qp’ has caused the deadweight loss (area abc) to be eliminated ⇒ allocative efficiency is achieved and
social welfare is maximised
government intervention for negative externalities → indirect taxes in context of consumption activities
for greater administrative ease and accountability, the government generally levies the tax through producers, and producers would then pass on the tax to consumers in the form of higher prices OR the government can levy the tax directly on the consumers ⇒ the consumers face higher private costs as they internalise the external costs
levying an indirect tax equal to the amount of marginal external
cost (MEC) at the socially optimal quantity Qs will lead to a rise in MPC by that amount, forcing consumers to internalise the MEC to third parties ⇒ upward shift of the MPC curve from MPC to MPC’outcome of levying the tax is that the new private optimal quantity Qp’ (where MPB = MPC’) now coincides with the socially optimal quantity Qs (where MSB = MSC)
the fall in consumption from Qp to Qp’ has caused the deadweight loss (area abc) to be eliminated ⇒ allocative efficiency is achieved and social welfare is maximised
limitations of indirect taxes
information gap: information is incomplete in the real world → a government is likely to have difficulty in attaching a monetary value to the amount of external costs incurred ⇒ over-estimation or under-estimation of MEC
if the external costs are overestimated, the government could levy excessively high taxes, depicted by the new MPC curve being higher than the MSC curve ⇒ government failure where the welfare loss is greater after the government intervened
if the external costs are underestimated, the government could levy a tax rate that is lower than necessary, depicted by the new MPC curve being lower than the MSC curve
in both cases, production or consumption will not be at the socially optimal level ⇒ allocative efficiency is not achieved and social welfare is not maximised
high administrative costs → unsustainable in the long term
a government may incur high administrative costs for the tax collection process ⇒ manpower and resources are needed to collect taxes from firms and consumers, to monitor whether taxes have been paid, and to enforce the accurate and timely paying of taxes
such high administrative costs could cause the implementation of taxes to be unsustainable and hence ineffective in the long term
uncertainty and time lag
the government needs time to determine the amount
of external costs generated, and hence the amount of tax to be imposed + after implementing the tax, there may be uncertainty and time lag in correcting the market failure, as producers and consumers may require time to fully respond to the disincentives of taxes ⇒ allocative inefficiency in the market may continue to persist even after the implementation of the tax
sunk cost fallacy → consumers’ cognitive biases
sunk cost fallacy: the situation where an economic agent chooses to continue with the decision because of the resources that were heavily invested, even when it is more beneficial to abandon the decision
unintended consequences of indirect taxes
inequity → for essential goods such as petrol only
taxes are politically unpopular in general → taxes can be deemed too high by the economic agents in question
taxes can have adverse consequences on equity, which also makes it politically unfavourable
when they are levied on goods and services with demand that is price-inelastic relative to supply, consumers bear a greater burden of the tax
as consumers bear a larger burden of the tax in the form of higher prices, lower-income groups may no
longer be able to afford certain essential goods, thus leading to greater inequity
opportunity cost of implementation
the high administrative costs of implementing the policy measure may outweigh the benefits arising from reducing
the extent of market failure, resulting in government failurean opportunity cost is incurred if the implementation and enforcement of the tax is financed through a reduction of spending in other areas
if the welfare loss in the other market is larger than the welfare gained in the initial market, government failure results
other arguments for indirect taxes
revenue collected from the tax
used by the government to address the external damages from the production or consumption of the good or service
used to fund research & development (R&D) for cleaner production methods
loss aversion
taxing may be more effective that providing incentives like subsidies or discounts
loss aversion is a cognitive bias where for individuals, the pain of losing is psychologically twice as powerful as the pleasure of gaining
government intervention for negative externalities → rules and regulations
firms and consumers could be prohibited by law from producing or consuming more than the socially optimal quantity or to adopt certain production or consumption practices
fear of punitive measures/penalties ensures that producers and consumers abide by the law
quotas
complete ban
rules and regulations on production or consumption methods
rules and regulations → quotas
legal limits on output or pollution level
the government could set a quota on the output produced, at the socially optimal quantity, Qs ⇒ limits production of the good to Qs, thus achieving allocative efficiency
may also be used to limit the amount of emissions produced → directly limits the external costs
generated, reducing MEC and MSC ⇒ Qs increases, reducing the extent of overproduction and hence social welfare loss, achieving greater allocative efficiencyexamples include environmental regulations for air pollution, which are commonly used across countries, where governments set a maximum permitted
level of pollution that firms are allowed to emitin Singapore, these are set with reference to guidelines by the World Health Organisation (WHO) to ensure good air quality
the National Environment Agency (NEA), which is the regulating authority, then monitors the level of pollution and takes actions against any producers found to be violating the law ⇒ ines and criminal penalties for violating the rules can help to
correct market failure as they deter the firms from exceeding the limit
rules and regulations → complete ban
an extreme case of output quota being set at zero
in severe cases where large amounts of negative externalities are generated (the extent of MEC is large), governments may choose to completely ban the production or consumption activity altogether
e.g.: banning the production of chlorofluorocarbon (CFC) under the Montreal Protocol, a compound which depletes the ozone layer, contributing to global warming and the rise in skin cancer cases, and
banning the consumption of narcotic drugs as it can lead to substance abuse
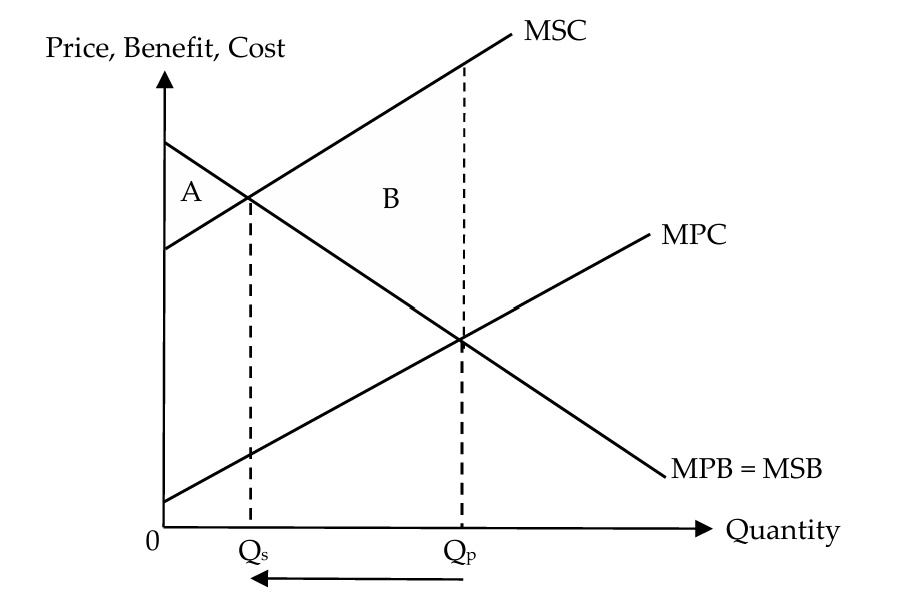
a complete ban can be seen as a quota where the output is set at zero → imposition of a complete ban is socially optimal when the MEC is very large such that MSB
intersects MSC where the socially optimal quantity Qs is at or close to zerowith a complete ban, there is no production and consumption ⇒ eradicates all negative externalities as well as benefits generated from the production or consumption of the good or service
with the imposition of a ban in a market where there is
significant MEC, the welfare loss will be area A, since MSB > MSC for output between 0 and Qs. Since area A is less than area B (which is the original welfare loss without a ban), it is better to ban the good when the extent of MEC is large, as social welfare improves overall
the higher the MSC and the lower the MSB of the production or consumption activity, the smaller the welfare loss (area A) will be ⇒ makes the complete ban more effective
rules and regulations on production or consumption methods
laws can also be passed to make the installation of cleaner technologies mandatory
as a result, the external costs (MEC) of consumption will be reduced → MSC will shift downwards and thus the socially optimal quantity Qs will increase and be closer to the private optimal quantity Qp ⇒ reduces the extent of over-consumption and hence deadweight loss generated, achieving greater allocative efficiency
e.g.: industries in Singapore are required to install, operate and maintain air pollution control equipment efficiently to meet emission standards
through the implementation of stringent emission standards by NEA, all petrol-driven vehicles are fitted with catalytic converters before they can be registered for use in Singapore
in particular, diesel vehicles in Singapore have to comply with the Euro VI emission standards from 2018.
limitations of rules and regulations
information gap
in order to design effective rules regarding pollution abatement methods, governments need to have a good understanding of the specific industries and alternative technologies available to these industries ⇒ often not easy to obtain, making it difficult to implement the policy
due to imperfect information, government may not know the optimal level of output or emissions
if the legal level of output or emissions is set too low, it could lead to greater deadweight loss than without government intervention, causing government failure
due to imperfect information, governments may not know the level of penalty or consequence that is harsh enough to deter firms
if penalties are not harsh enough, consumers and firms may not be deterred from violating the
regulation, rendering the policy ineffectiveon the other hand, overly harsh penalties will result in unintended consequences ⇒ determining
the appropriate level of penalties can be challengingin the case of a ban, the government may not have perfection information on the extent of the negative externalities, to help decide if such an extreme
measure is requiredif the amount of MEC is not significant, a complete ban can result in greater welfare loss than no intervention at all
a complete ban also removes all the benefits of producing or consuming the good or service ⇒ deadweight loss to society, and allocative inefficiency will continue to persist
if the extent of MEC is small and/or the extent of MSB is large, banning the production or consumption of the good or service tends to result in a larger welfare loss as compared to the situation without intervention ⇒ government failure results
high administrative costs → unsustainable in the long term
rules and regulations can incur high administrative and monitoring costs
includes administrative costs of deploying inspection teams, installing of monitoring equipment and the prosecution of offenders
such high administrative cost could cause the implementation of rules and regulations to be unsustainable and hence ineffective in the long term
unintended consequences of rules and regulations
high costs to firms
legal restrictions are blunt instruments where all firms are
subjected to the same rules regardless of their pollution abatement costsfor firms that incur high pollution abatement costs, they are subjected to the same limit on emissions as firms with lower abatement costs, and have no choice but to adhere
to the regulationsuch laws lead to lower pollution levels at a relatively high cost to the industry
trade-off with macroeconomic aims
if penalties for violating the rules are too harsh (or cause firms to incur high cost), a government runs the risk of chasing firms away to other countries, driving away potential investments ⇒ slow down economic growth and increase unemployment
opportunity cost of implementation
the high administrative costs of implementing the policy measure may outweigh the benefits arising from reducing the extent of market failure ⇒ government failure
an opportunity cost can be incurred if the implementation and enforcement of the rules and regulation is financed through a reduction of spending in other areas → if the welfare loss in the other market is larger than the welfare gained in the initial market ⇒ government failure
other arguments for rules and regulations
laws compel producers and consumers to take actions to limit the level of production or consumption to the socially optimal level ⇒ more straightforward to devise, more easily understood by firms, and easier to implement, as compared to taxes
outcomes in terms of reduction in production and consumption are more certain and can be achieved faster as compared to taxes and tradable pollution permits
as long as the penalties are harsh enough and there are effective monitoring, rules and regulation would serve as an effective deterrent to prevent violation of the legislation and the desired reduction within the stipulated time frame could be achieved
tradable pollution permits → for case of pollution (negative externalities)
when there is pollution generated from production activities, a measure is to issue tradable pollution permits to firms to limit the amount of pollution
e.g. the European Union Emissions Trading System (EU ETS) is a greenhouse gas emissions trading scheme to combat global warming, under the ‘cap and trade’ principle, a maximum (cap) is set on the total amount of greenhouse gases that can be emitted by all participating plants and countries, and permits for emissions are then auctioned off or allocated for free
the government first decides on a permissible level of pollution for the entire industry and sets a quota on the level of emissions produced → should coincide with the socially optimal level of production
the permissible level of pollution is then divided into smaller units, and corresponding permits are issued to firms based on certain criteria, for example, firms’ past output or emissions level
these permits can then be traded between firms, where the permit price is determined by the market demand and supply of such permits
a firm whose pollution abatement (reduction) costs exceed the current permit price will find it cheaper to buy more
permits to pollute than to reduce its level of pollutiona firm that faces lower pollution abatement costs than the current permit price will choose to reduce its level of pollution and sell its excess permits to other firms
this gives firms the incentive to adopt cleaner production techniques to avoid an increase in their cost of production due to the larger number of permits required, or to increase their revenue through the sale of their permits
when firms adopt cleaner methods of production, external costs are also reduced, causing MSC to shift downwards towards MPC in the long run, reducing deadweight loss
limitations of tradable pollution permits
high administrative costs → unsustainable in the long term
it is difficult to measure and monitor firms’ adherence to their respective pollution limits, and this will lead to the government incurring high administrative costs
such high administrative cost could cause the implementation of the tradable permits to be unsustainable and hence ineffective in the long term
information gap
as information is imperfect, regulating authorities may not
know the socially optimal level of pollution in realityif the government underestimates the optimal level of pollution, too few permits may be introduced ⇒ underproduction of the good or service, which leads to welfare loss
increased pollution in certain regions
may lead to emission being concentrated in certain geographical areas if many firms in that particular region
has the purchasing power to buy the excess permits from other firms in other regions ⇒ severe air pollution in that region and lowering the non-material living standards of the residents
unintended consequences of tradable pollution permits
trade-off with macroeconomic aims
as the need to purchase permits would increase firms’ cost of production, there could be a fall in investment, employment and economic growth if heavy polluting firms find permits too costly and choose to relocate their production to other countries instead
opportunity cost of implementation
the high administrative costs of implementing the tradable permits may outweigh the benefits arising from reducing the extent of market failure ⇒ government failure
opportunity cost can be incurred if the implementation and
enforcement of the tradable permits is financed through a reduction of spending in other areas → if the welfare loss in the other market is larger than the welfare gained in the initial market ⇒ government failure
other arguments for tradable pollution permits
firms with lower pollution abatement costs would have the financial incentive to reduce the externalities produced, as they can increase their revenue by selling excess permits ⇒ firms are motivated to develop methods to reduce pollution as much as possible
in contrast, for other government interventions like
rules and regulations, firms may not have the incentive to reduce emissions further once they meet the limit stipulated by the government
emissions trading, by allowing the firms to trade the pollution permits ensures that pollution abatement is carried out by the firms that can do so at the lowest cost
these firms, by cutting down emissions, will be left with unused permits that they can sell to offset their costs
the other firms that find it costly to cut pollution
can buy the unused permitsthe target can still be met but at a much lower total cost as compared to rules and regulations, where all firms regardless of pollution abatement costs, have to reduce their pollution levels
compared to taxes, the outcome in terms of reduction in pollution level can be achieved with more certainty (by placing a legal maximum on total negative externalities produced) with strict monitoring and enforcement
case study of singapore → policies targeted at reducing congestion and pollution to address negative externalities arising from car usage [taxes]
the government can intervene to improve society’s welfare by levying an indirect tax equal to the amount of MEC generated at the socially optimal level, Qs ⇒ raise the MPC by the amount of the indirect tax (tax = MEC at Qs)
with increased costs of road usage, motorists are compelled to internalise the negative externalities
as MPC shifts upwards to MPC’, traffic volume will be reduced to Qs, reducing congestion + reduces the amount of emissions, hence reducing pollution
at Qs, deadweight loss is eliminated and allocative efficiency (MSB = MSC) is achieved
in singapore, the Electronic Road Pricing (ERP) system acts like a tax, raising the MPC to discourage motorists from the use of specific roads during peak hours
based on a pay-as-you-use principle, motorists are charged when they use priced roads during peak hours
charges are flexible and vary according to peak travel times and road use
case study of singapore → policies targeted at reducing congestion and pollution to address negative externalities arising from car usage [quota to control car ownership]
in Singapore, the Land Transport Authority (LTA) also implemented a Vehicle Quota System (VQS) to limit vehicle population per annum → regulates the growth rate of vehicles by restricting the number of new vehicles allowed for registration
under the VQS, a newly registered vehicle in Singapore must first obtain a Certificate of Entitlement (COE) → represents a right to vehicle ownership and use of the
limited road space for 10 years
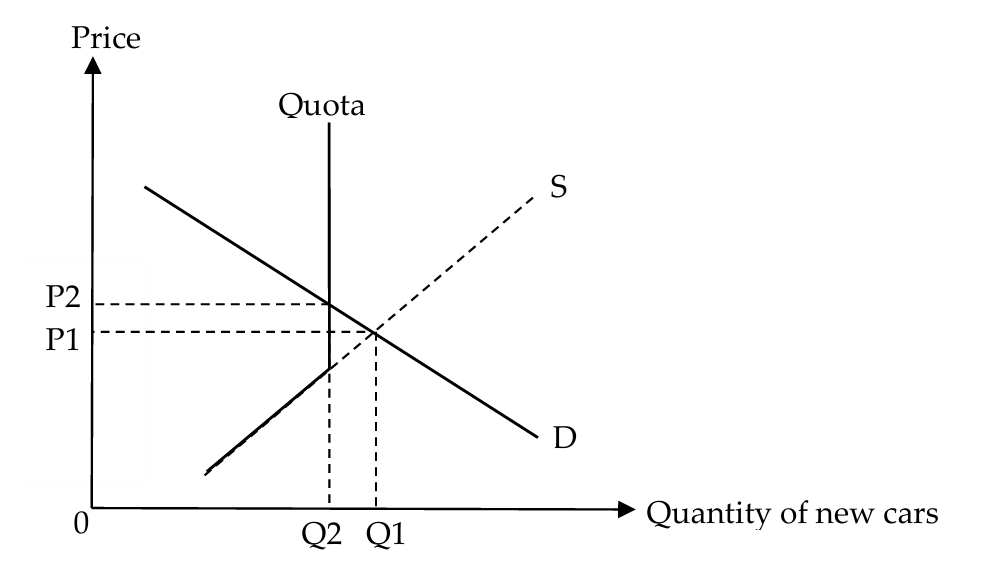
under the VQS, the supply of new cars is perfectly price
inelastic in any given month as it is determined by the number of COEs releasedthe price of new cars is determined by the supply of COEs and the demand for new cars
with the quota of COEs set at Q2, the quantity of new cars is
now lower at Q2 ⇒ the price of cars is at P2, which is higher than the market clearing price, P1with a lower quantity of new cars and hence lower emissions, congestion and pollution are reduced
as the number of new cars on the road falls, the number of car trips falls and becomes closer to the socially optimal level, the deadweight loss and extent of allocative inefficiency is reduced
case study of singapore → policies targeted at reducing congestion to address negative externalities arising from car usage [improving alternative means of transport]
public transport is a substitute for private transport
subsidising train and bus fares, increasing the supply of trains, buses and taxis, and developing the road
infrastructures to improve the public transportation network ⇒ make public transport a more attractive option to commuters
in Singapore, the LTA has made plans to shorten waiting time and reduce crowding by increasing the capacity of the rail and bus systems, improving reliability and spreading out demand by encouraging off-peak travel + the bus network will be
complemented with more extensive infrastructure for cycling and walking, so that alternative modes of transport could be made more attractive for people + the rail network will also be expanded significantlybesides extensions to existing Circle, North East and Downtown line, the LTA will build a new 50-km Cross Island Line to provide a faster commute between the East and West regions in Singapore
the first phase of the Cross-Island Line (CRL), Singapore's eighth MRT line and its longest fully underground line, will be opened by 2029
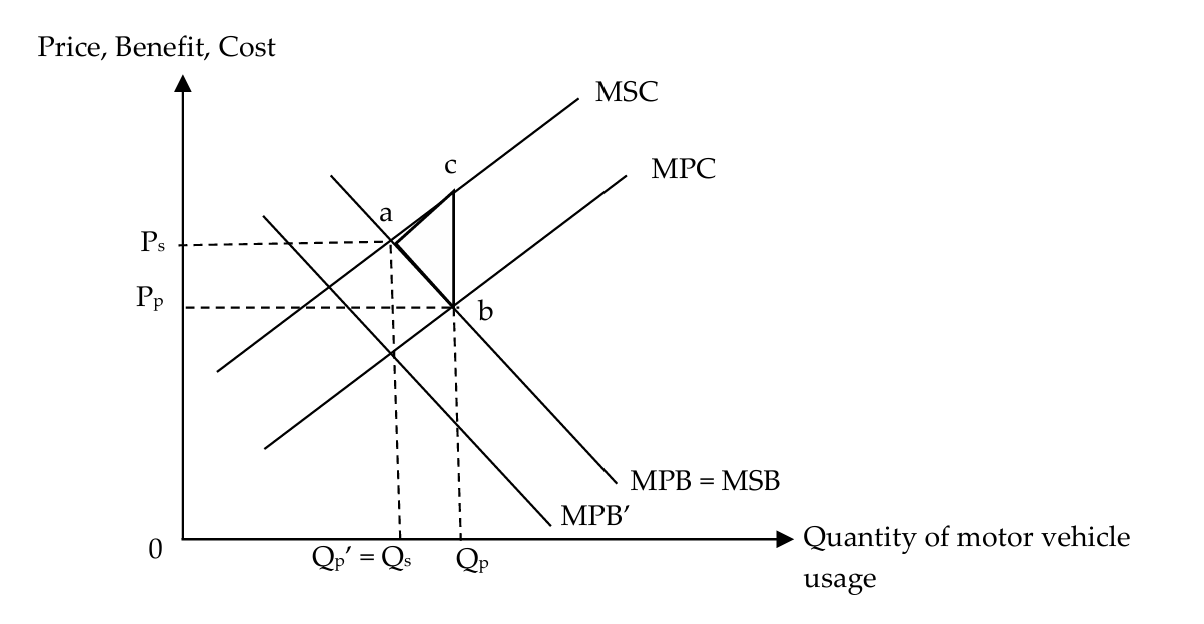
as the alternative modes of transport become more attractive, more individuals may switch to public transport
as the other modes of transport become more accessible, the MPB of travelling by cars falls, causing the MPB curve to shift downwards to MPB’ ⇒ reduces the private optimal quantity to Qp’, thus reducing the extent of overconsumption of car trips and the resultant deadweight loss
improvements to public transport can also be justified on grounds of equity
making public transport, an essential service more affordable and easily accessible, poorer members of society who cannot afford to travel by car benefit, thus reducing inequity in society
case study of singapore → policies targeted at reducing congestion to address negative externalities arising from car usage [rules and regulations]
to reduce the amount of pollution produced from vehicle usage, the Singapore government introduced a new Vehicular Emissions Scheme (VES) in 2018 to encourage consumers to shift to less pollutive vehicle model
takes into consideration a vehicle’s carbon dioxide emissions as well as its emissions of four other pollutants (hydrocarbons (HC), carbon monoxide (CO), nitrogen oxides (NOX) and particulate matter (PM))
cars with low emissions will qualify for rebates while
cars with high emissions will incur a corresponding registration surcharge
government has mandated all in-use vehicles to undergo periodic inspection at an authorised vehicle inspection centre at regular intervals
owners of vehicles that fail the smoke emission tests during the inspection are not allowed to renew their vehicle road taxes
ensure that vehicles on the roads are properly
maintained to minimise emissions. In addition, it is illegal to remove the catalytic converters and muffler from the vehicles as these systems help to minimise the air and
noise pollution posed by the vehicle engines
these measures reduce the MEC generated from consumption of car trips ⇒ the MSC curve shifts downwards, increasing the socially optimal quantity, and reducing the extent of overconsumption of car trips → deadweight loss is reduced, thus reducing the extent of allocative inefficiency
government considerations → policies to address negative externalities arising from car usage
policies through controlling car usage and car ownership
the COE quota and the ERP system
car owners in Singapore pay for high car, road and petrol taxes
although these policies have helped to reduce car usage and car ownership in Singapore, there are also limitations to these policies
limitations of ERP
although the ERP is targeted at car owners who contribute to the congestion, demand for road use in Singapore is highly price inelastic especially during peak hours when car owners may find it more challenging to find alternatives to get to work on time
a given increase in price of road usage due to the ERP will lead to a less than proportionate fall in its quantity demanded
the effectiveness of ERP as a traffic management policy may be limited → in order to reduce road usage significantly, a high
ERP charge is necessary, which is politically unpopular
limitations of VQS
can be a rather blunt instrument because all car owners are penalised regardless of whether they actually contribute to congestion
regulates the overall level of car ownership, but does not directly control the car usage on a particular stretch of road that causes the congestion
the high COE prices substantially raise car prices ⇒ car owners increase their vehicle usage to spread out the high ownership costs due to the sunk cost fallacy, thus worsening the congestion problem
limitations of improving public transport
although measures have been taken to make public transport a more attractive alternative, motorists (i.e. car drivers) may not perceive public transport to be a close substitute to private transport due to the difference in convenience and comfort ⇒ motorists might not be willing to switch to public transport
the effectiveness of such a policy depends on how users perceive the closeness of the alternative substitute to be → a weak perceived substitute would make the policy less effective
unintended consequences of rules and regulations
although measures have been taken to make public transport a more attractive alternative, motorists (i.e. car drivers) may not perceive public transport to be a close substitute to private transport due to the difference in convenience and comfort ⇒ motorists might not be willing to switch to public transport
the effectiveness of such a policy depends on how users perceive the closeness of the alternative substitute to be → a weak perceived substitute would make the policy less effective