Social Research Practices unit 2
1/49
There's no tags or description
Looks like no tags are added yet.
Name | Mastery | Learn | Test | Matching | Spaced |
|---|
No study sessions yet.
50 Terms
What is a normal curve?
An important concept in stats used in combination with the mean and standard deviation to make precise descriptive statements about empirical distributions.
What are the properties of the normal curve?
Unimodal (Single peak), bell shaped, symmetrical,unskewed, tails extend to infinity, mode/mean/median are the same.
What is the normal curve good for?
We can use this property to describe areas above or below any given point (think confidence intervals.)
General relationships of the normal curve:
± 1s = 68.26%
± 2s = 95.44%
± 3s = 99.72%
between mean & 1 s = 34.13%
between mean & 2 s = 47.72%
between mean & 3 s = 49.86%
What are Z-scores?
Scores that have been standardized to the theoretical normal curve.
What do Z-scores represent?
How different a raw score is from the mean in standard deviation units.
To find area between two z-scores on
opposite sides of the mean:
Find the areas between each score and the mean from column b
Add the two areas
To find area between two z-scores on
the same side of the mean:
Find the area between each score and the mean from column b
Subtract the smaller area from the larger area
Appendix A columns meanings
Column A = Z scores
Column B = area
between the score (Z) and the mean
Column C = area
beyond the score (Z) into the tail
Probability Samples
Sampling techniques where every unit in the population has a known, non-zero probability of being selected. (Random Samples)
Nonprobability Samples
Convenience Samples (not generalizable)
Samples must be representative of the population, meaning…
Accurate to demographic’s characteristics.
How can we ensure samples are representative?
Samples drawn according to the rule of EPSEM (equal probability
of selection method), in which every case in the population has the
same chance of being selected for the sample are likely to be
representative
Population
total number of a group
sample
number of people in a group taken from a population to gather data from
Parameter
characteristics of a population
Statistics
are mathematical characteristics of samples (estimated parameters)
EPSEM
equal probability of selection method, is a sample where all population units have the same probability of selection
EPSEM Sampling techniques
Simple Random Sampling, Systematic Random Sampling, Stratified Random Sampling, Cluster Sampling
sampling distribution
The theoretical, probabilistic distribution of a statistic for all
possible samples of a given size (N)
Every application of inferential statistics involves 3 different distributions-
Population: empirical; unknown
Sampling Distribution: theoretical; known
Sample: empirical; known
Information from the
sample is linked to the population via the sampling distribution
nonprobablity samples
essentially convenience samples
representative
reproduces the important characteristics of the population
Properties of the Sampling Distribution:
1. Normal in shape
2. Has a mean equal to the population mean (μ)
3. Has a standard deviation (standard error, σ) equal to the
population standard deviation divided by the square root of N
The first theorem
If we sample properly (random selection and a
sufficient number of cases) the population mean and
standard deviation should be equal to the sample
mean and standard deviation.
The central Limit Theorem
the sampling distribution of the mean will always be normally distributed, as long as the sample size is large enough. (this is why we want at least a sample size of 100)
Why is the central limit theorem important?
it removes the constraint of normality in the
population…
AKA, if the n is big enough we can apply it without double checking, if it’s too small then we have to check with population
Additionally considerations with sampling distributions
The sampling distribution is normal so we can use Appendix A to find areas
We do not know the value of the population mean (μ) but the
mean of the sampling distribution is the same value as μ
We do not know the value of the population standard
deviation (σ) but the standard deviation of the sampling
distribution is equal to σ divided by the square root of N
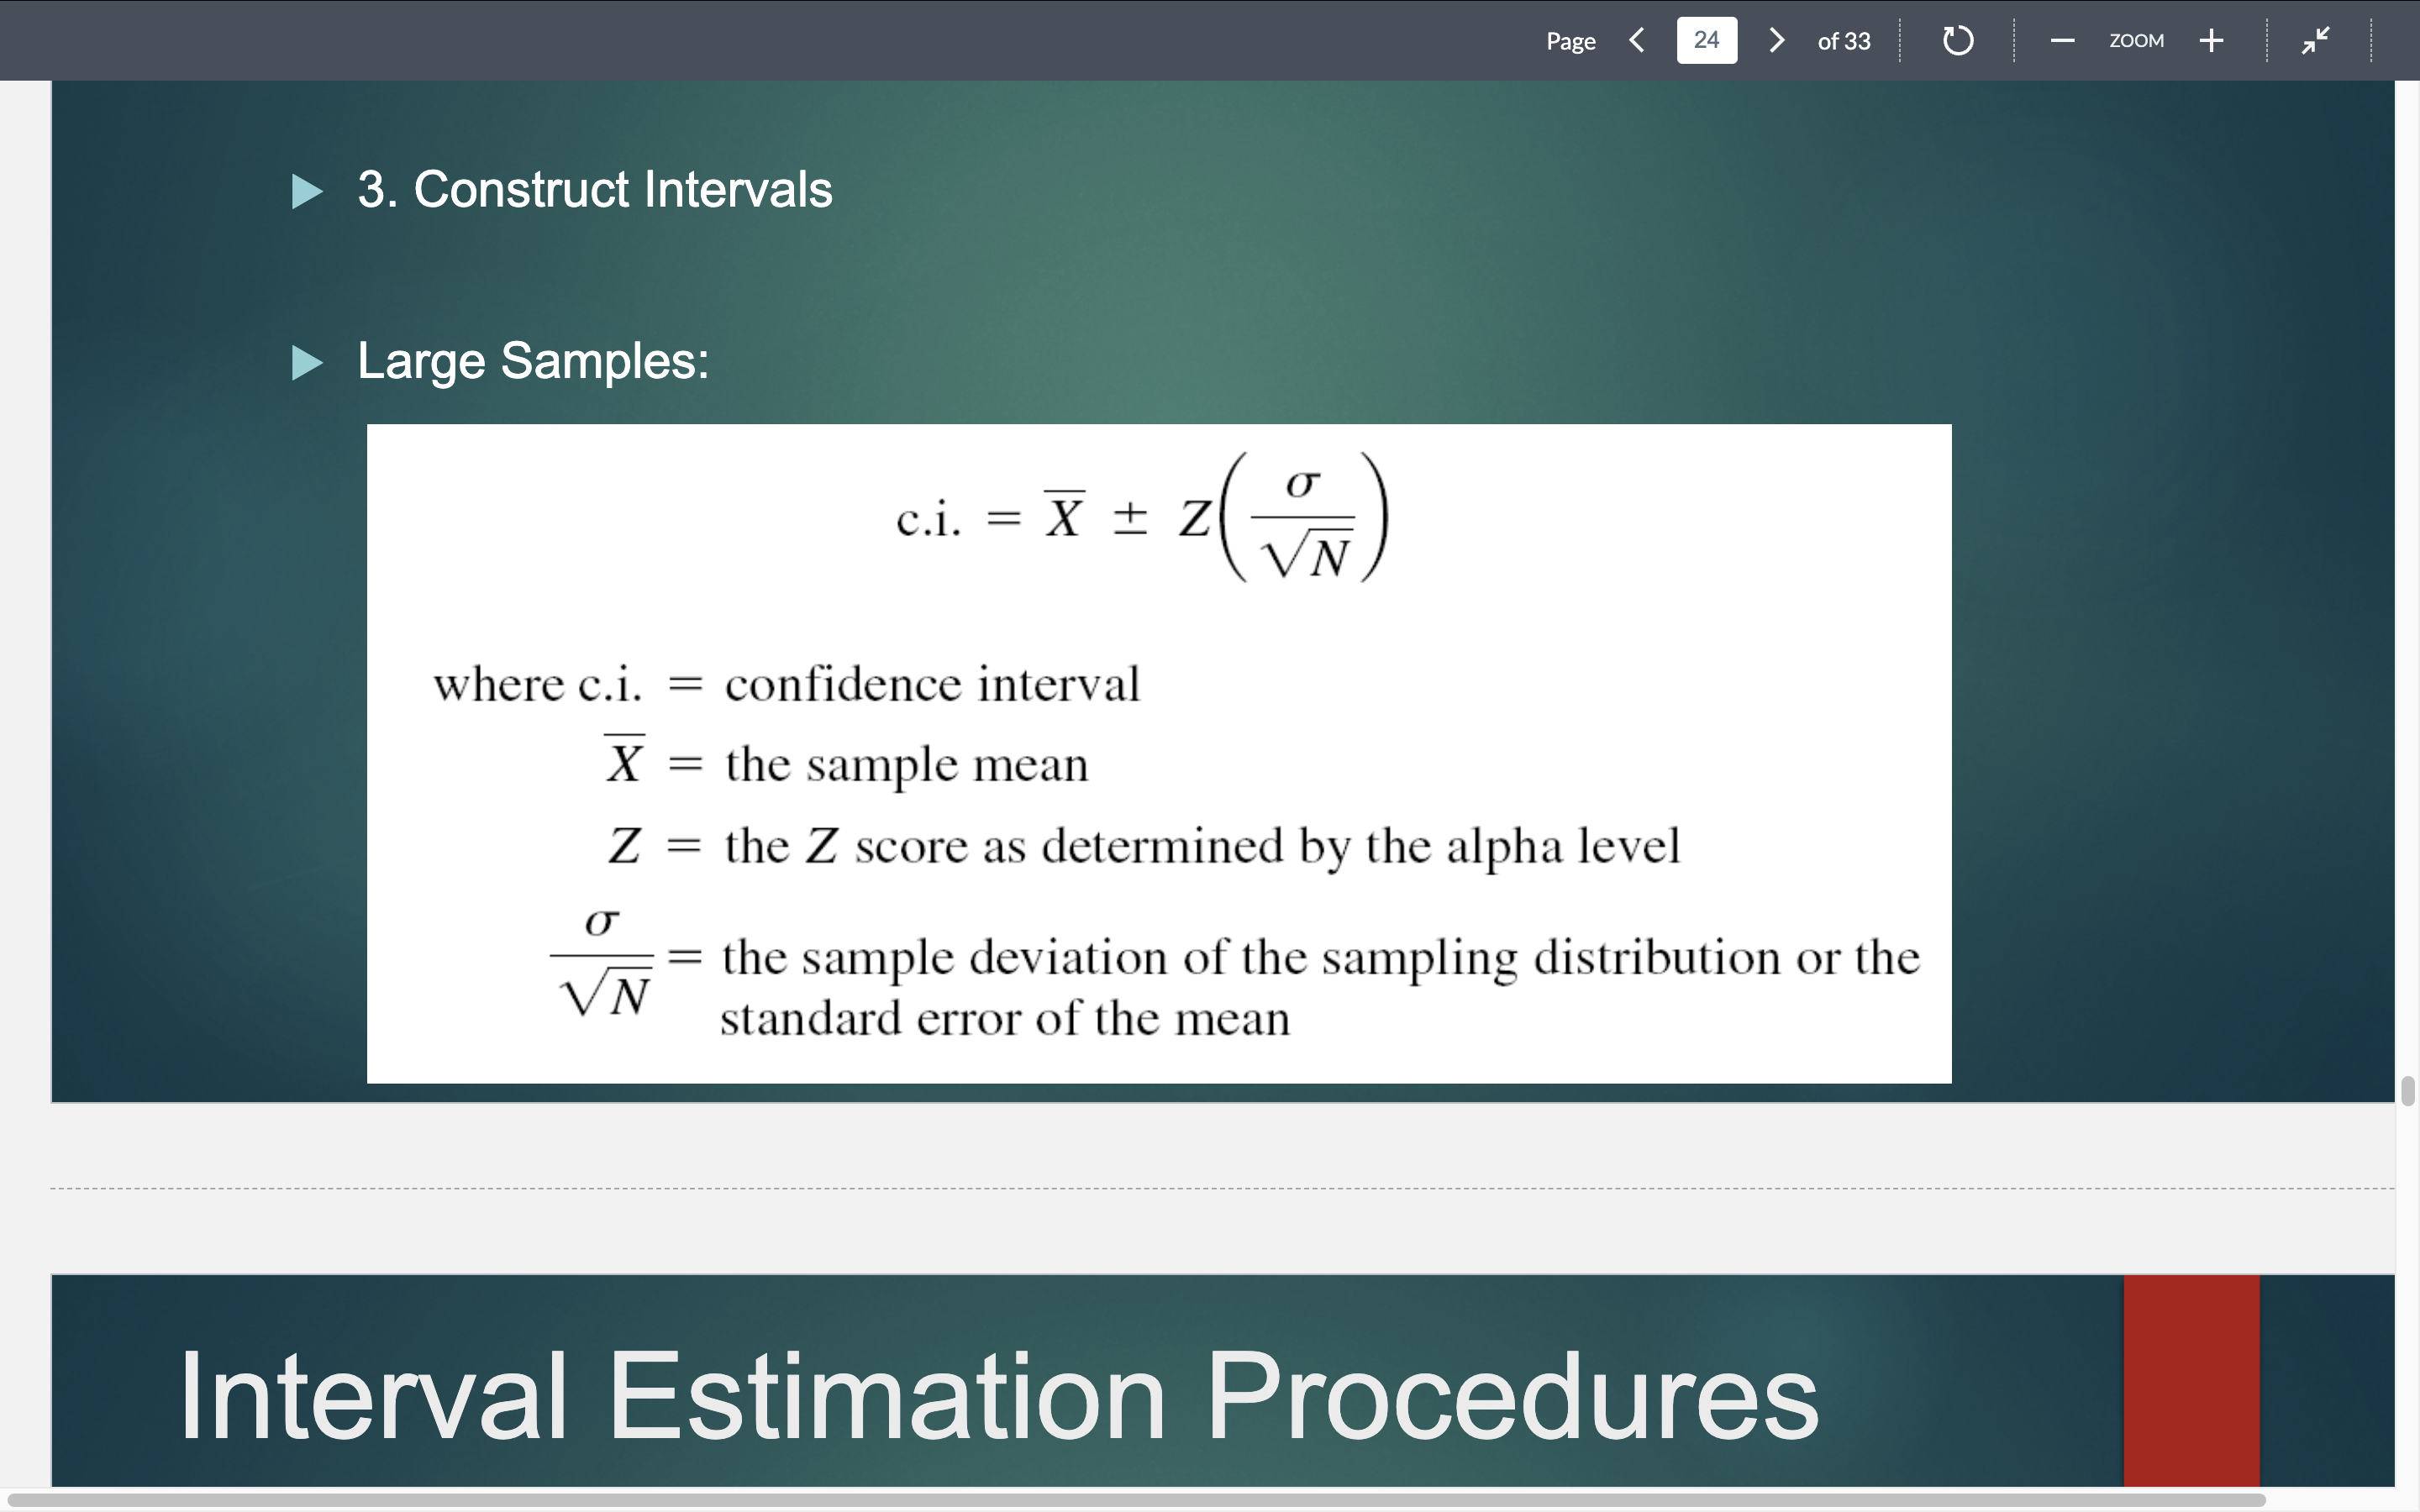
confidence intervals
space we know a value is likely to fall in (bulk of the curve)
Margin of Error
outside the confidence interval, tolerable room for mistake
UNLESS TOLD OTHERWISE, ASSUME YOUR ALPHA =
.05
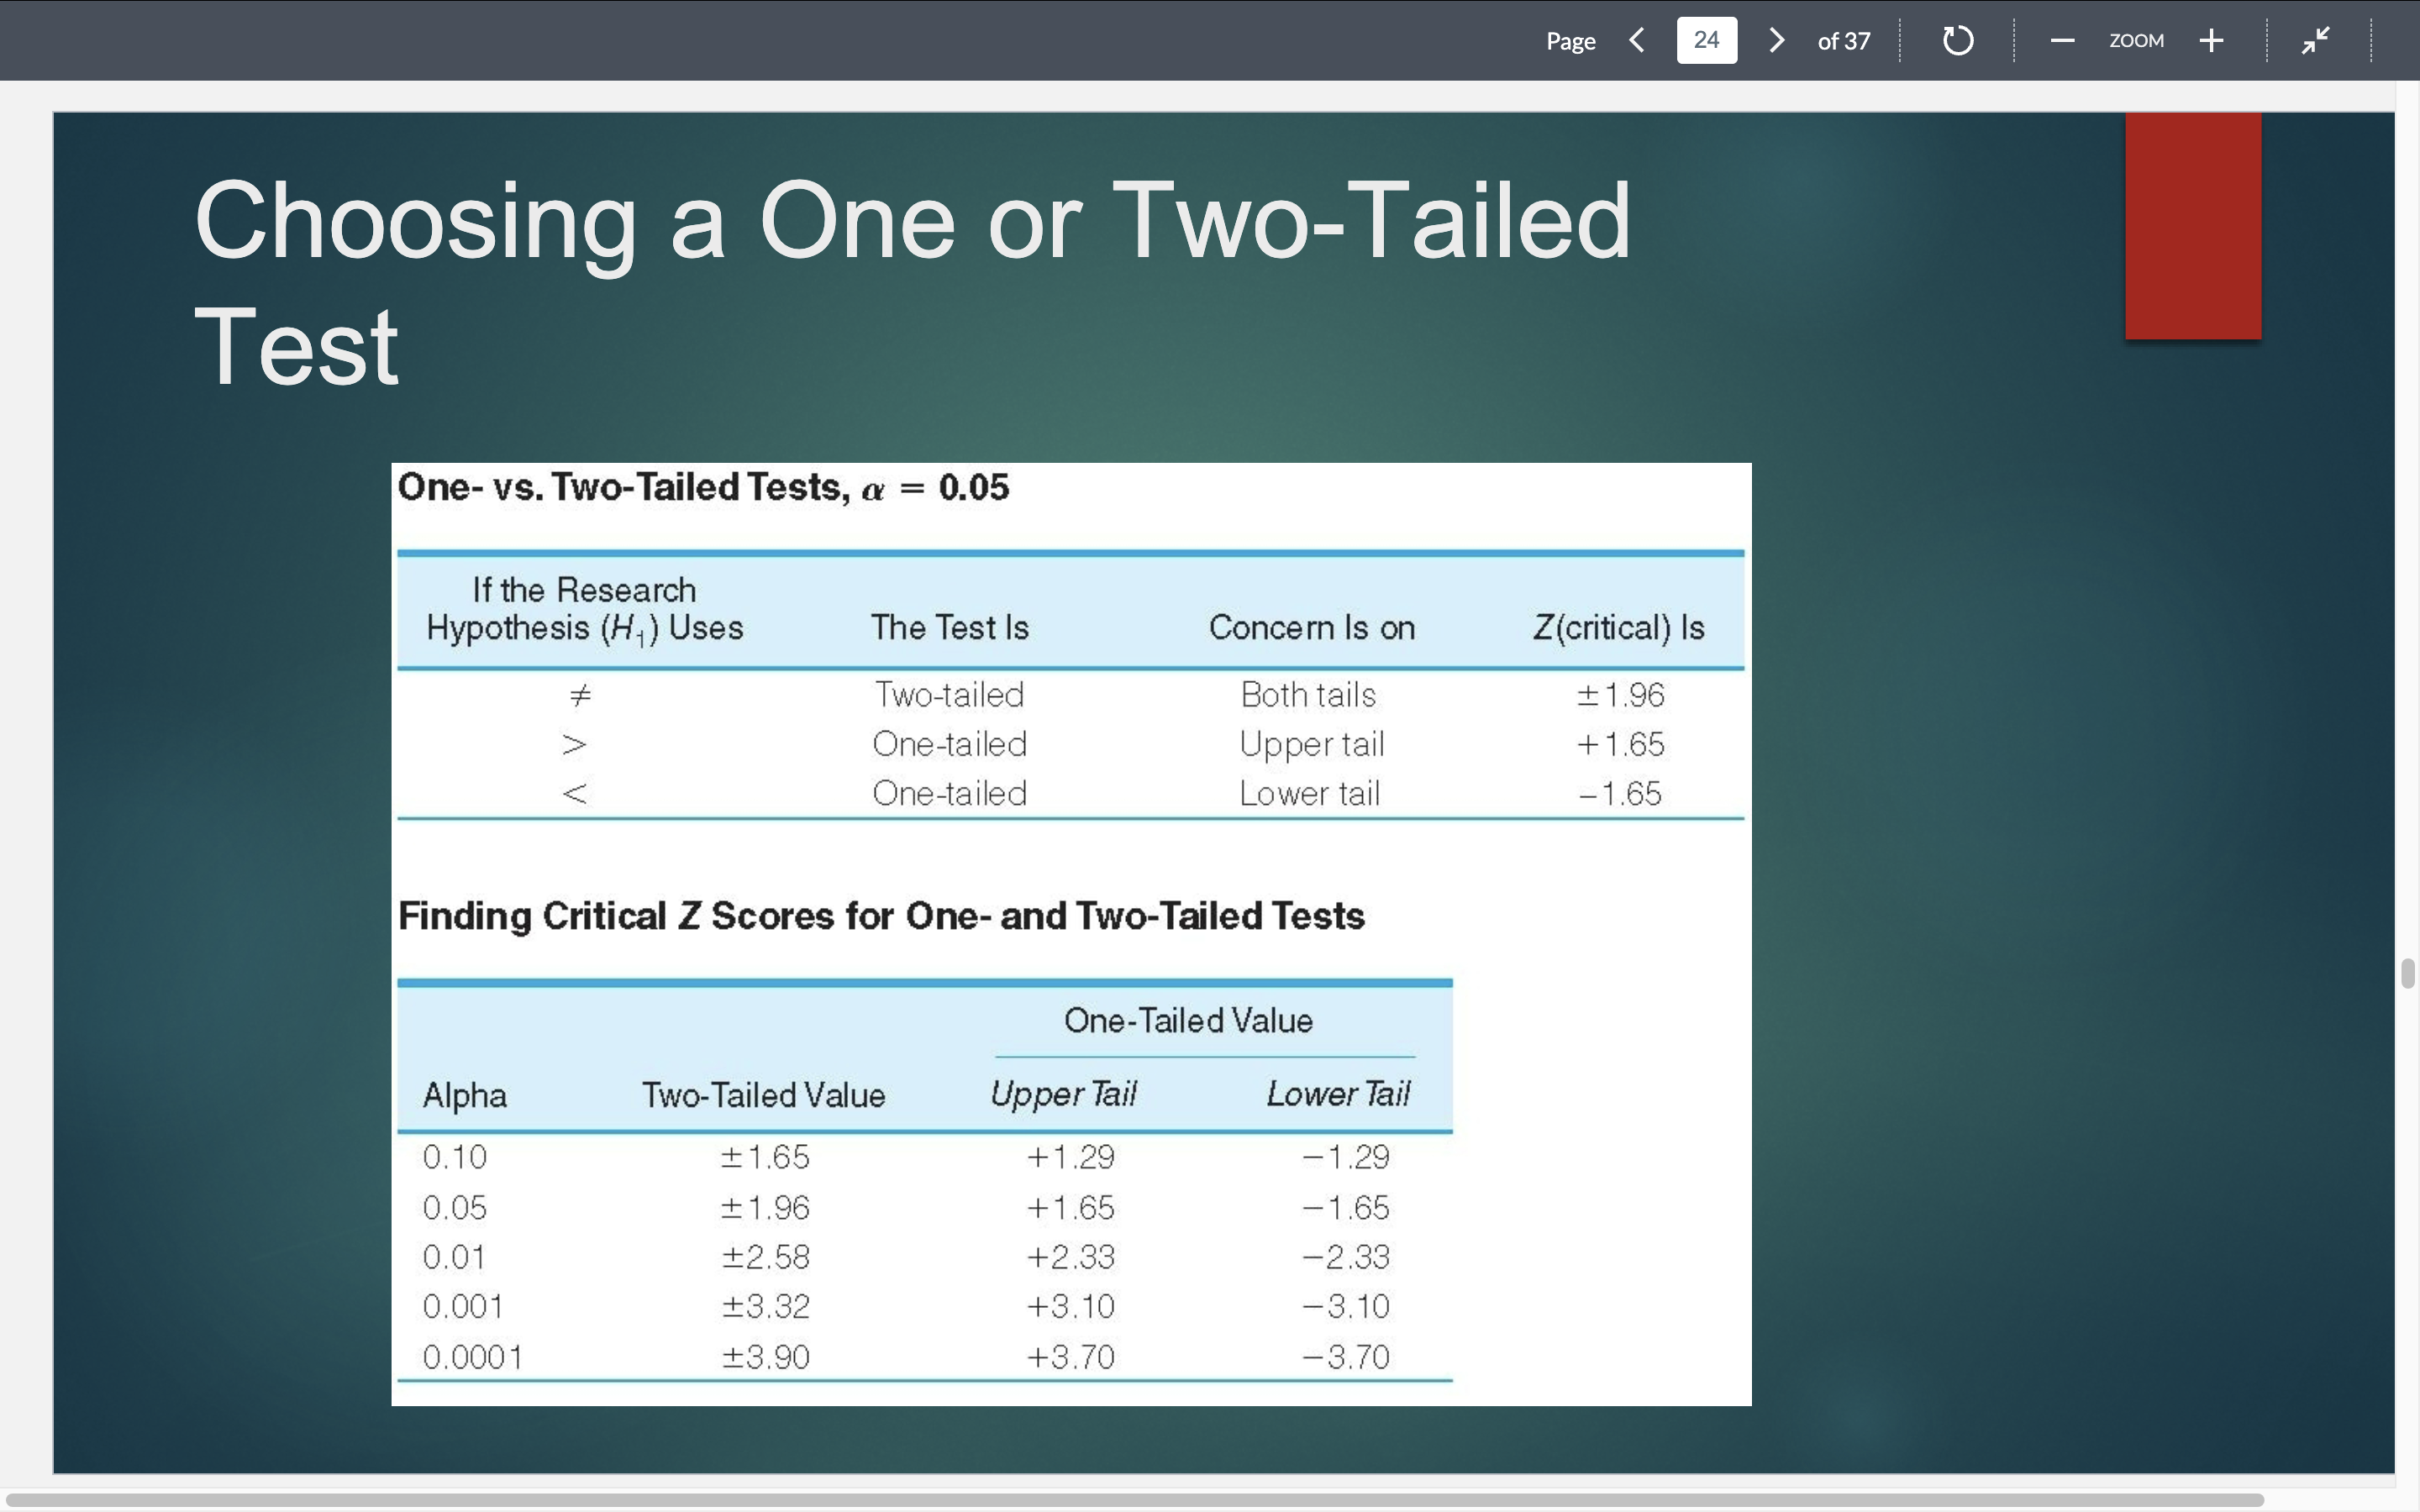
An alpha of .05 corresponds to Z scores of
± 1.96
An alpha of .01 corresponds to Z scores of
± 2.58
finding confidence interval
1-a
constructing confidence level
how to interpret a confidence interval
“I am x% confident the result will be between this and that. (alpha) is how likely it is to be incorrect”
What is hypothesis testing designed to do?
detect significant differences
What are significant differences?
differences that did not occur by random chance
What is a null hypothesis?
differences are due to chance
What are critical values?
the two sides of the z-score, essentially. If your hypothesis test finds that the value you found is outside of the bounds of your z-score, then reject H0 (SIGNIFICANT DIFFERENCE IF OUTSIDE OF Z-score.
Five step model
1. Write down the null hypothesis (Ho)
2. Look at your N. Is it greater or less than 100?
- N > 100, use Z-score (Appendix A)
- N < 100, use t-score (Appendix B)
3. Set your alpha, determine the critical values
4. Calculate the test statistic
5. Interpret the results of the test
One tailed versus Two tailed
one tailed has an expectation stating which way your findings will be off.
Alpha level is the probability that
the decision to reject the null hypothesis is incorrect (type 1 error)
type one error
rejecting a true null hypothesis (false positive. “You ONE… but you lost pal…)
type two error
False negative “Idk why ur so round in the stomach, but ur not pregnant….” (you’re totally pregnant.)
T column is used…
when n is less than 100
T column uses _______.
degrees of freedom instead of z-scores
Two sample’s hnull is
There is no difference between the parameters of the two
populations
5 step process for two sample testing
—Step 1: Write the Null Hypothesis
Ho: μ1 = μ2
There is no difference between the populations
—Step 2: Look at the N
Total N ≥ 100 (add both sample ns)
—Step 3: Choose alpha, Get critical
values (z-scores if n>/=100. t-sores if less)
—Step 4: find Test Statistic
—Step 5: Interpret
*** If Obtained is between the critical values = not significant***
*** If Obtained is outside of the critical values = significant***
Hypothesis Test for Means
Two-Sample Test of Means (Small Samples)
Largely the same as with sampling test, add the fact…
1. Calculate the pooled estimate of the standard error
2. Calculate the obtained Z score
(Longer equation to work, essentially)
Also, the interpretation is only looking to see if the found t-value is GREATER than critical t. If found is greater than OG, then it is significant.
What are the limitations of Hypothesis Testing?
relies exclusively on data and doesn't provide a comprehensive understanding of the subject being studied