Unit 3: Economic activity 3.1 - 3.1
1/19
There's no tags or description
Looks like no tags are added yet.
Name | Mastery | Learn | Test | Matching | Spaced |
|---|
No study sessions yet.
20 Terms
GDP (definition)
The value of total output produced in an economy over a period of time.
GDP (methods to calculate)
Income: Wages + Rent + Interest + Profit
Output: sum of 1st, 2nd, 3rd sectors’ outputs
Expenditure: C + I + G + (X – M) (This will give you GDP at market prices. To get GDP at factor costs you add subsidies and take away taxes)
Limitations to using GDP to measure economic activity
GDP does not take into account negative effects on the environment such as pollution or use of natural resources
Shadow economy (also known as black markets) is not taken into account including those working illegally
People who are doing unpaid work (volunteering or within a family) are not included
Everything that is produced and consumed by people themselves is not included in GDP (e.g. potatoes grown by Smith and consumed by his family are left unrecorded)
Improvements in the quality of output produced are not considered
Circular flow of economy (injections vs leakages)
If injections > leakages in the circular flow, national income increases.
If leakages > injections in the circular flow, national income decreases.
Nominal GDP (definition
Nominal GDP measures the value of all final goods and services produced in an economy within a given time period (typically one year), using current price levels. This means that nominal GDP is not adjusted for changes in price levels over time (non-inflation adjusted).
Nominal GNI
Gross national income (GNI) measures the value of all income earned by the country’s citizens including income earned from abroad.
NOMINAL GNI (formula)
GNI = GDP + net income from abroad
Net income from abroad = Income from abroad – Income sent abroad
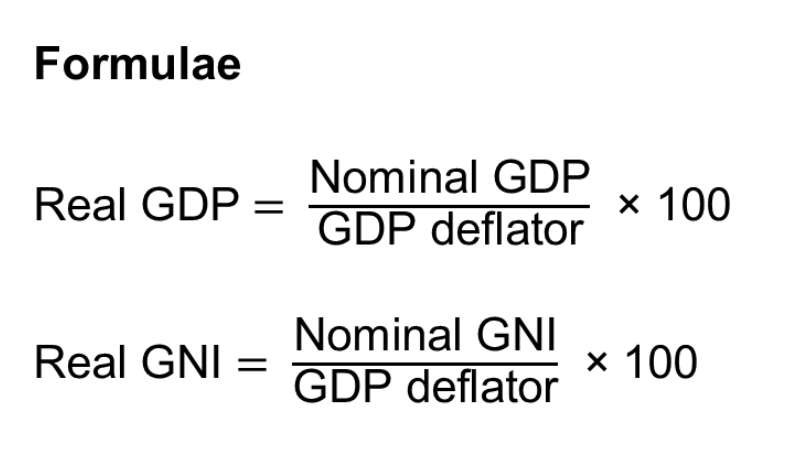
Real GDP and GNI (definition)
Real GDP and real GNI are measures of economic activity which are calculated using constant prices, meaning the values are adjusted for changes in price levels over time. So, GDP/GNI adjusted for inflation.
Real GDP and GNI (formulae)
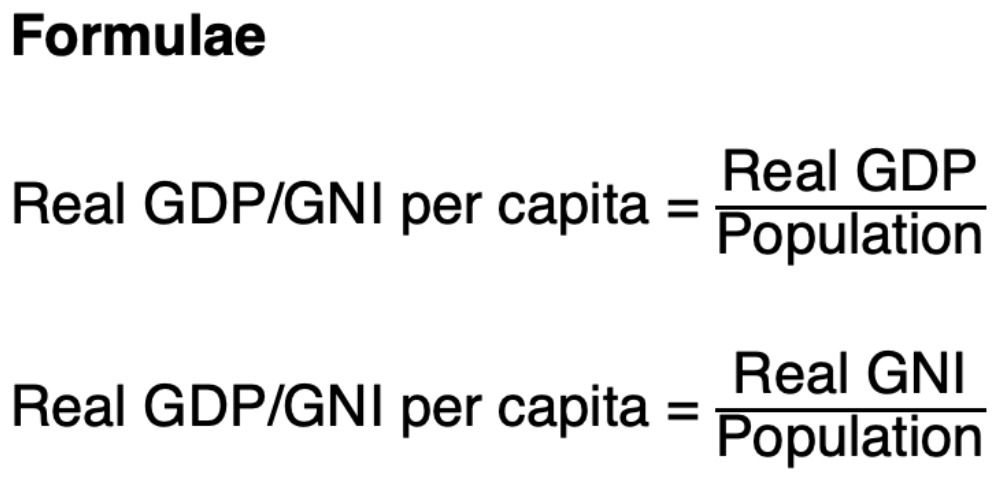
Real GDP/GNI per capita
Real GDP per capita and GNI per capita are economic indicators that compare the average wealth of citizens in different countries. R
Real GDP/GNI formulae
Purchasing power parity (PPP)
Refers to the exchange rate needed to buy the same basket of goods and services in different countries using the same amount of money, i.e., the exchange rate needed for the same purchasing power across countries.
Purchasing power
Refers to the amount of goods and services that can be bought with one unit of a currency.
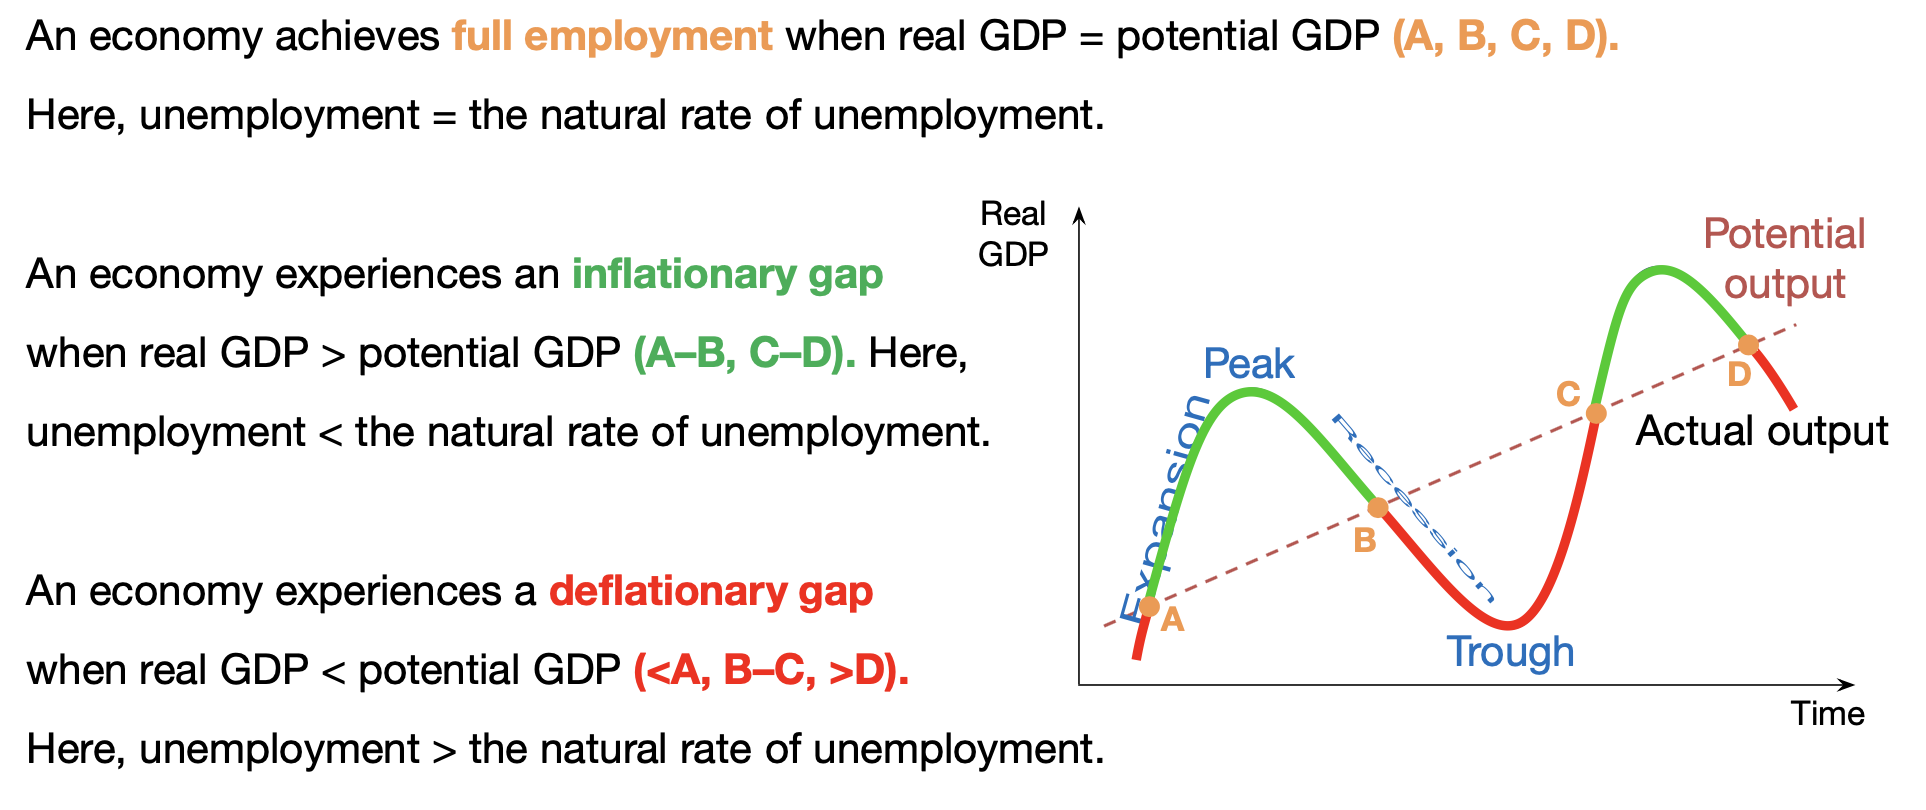
Business Cycle
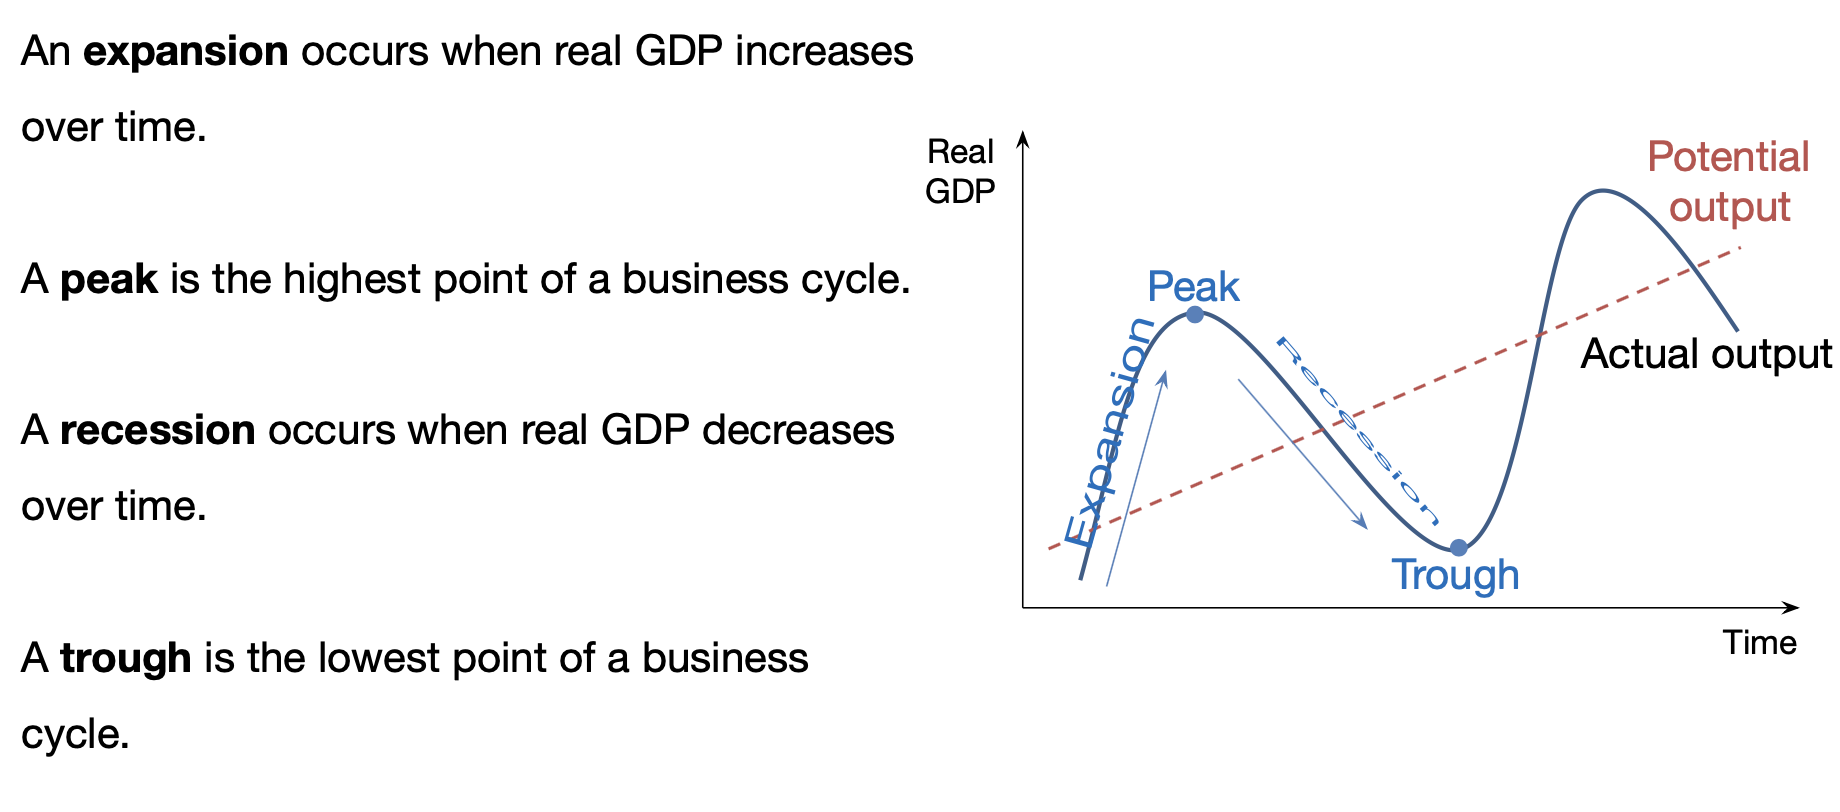
Business cycle – output and unemployment
Green GDP
Gross Domestic Products that takes into account the monetary value of loss of biodiversity, damage done (costs) to the environment.
(Green GDP = GDP – costs to the environment)
Alternate measures for wellbeing
OECD Better Life Index (BLI)
Happiness Index
Happy Planet Index (HPI)
OECD better life index
housing
income
jobs
community
education
environment
civic engagement
health
life satisfaction
safety
work–life balance.
However, the BLI has been criticised as it focuses on a rather narrow set of indicators. It ignores others such as community involvement and degradation of the environment. It is also criticised because the criteria are influenced by the personal preferences of the participant. It is also possible to change the ranking by changing the weight of each variable.
Happiness Index (World Happiness Report)
Psychological Well-Being
Optimism, sense of purpose/accomplishmentHealth
Energy levels and ability to perform everyday activitiesTime Balance
Enjoyment, sense of leisure, frequency of feeling rushedCommunity
Sense of belonging, volunteer levels, sense of safety in the communitySocial Support
Satisfaction with friends and family, feeling loved, and degree of lonelinessEducation, Arts, and Culture
Access to cultural and educational events and diversityEnvironment
Access to nature, pollution levels, and level of conservationGovernance
Trust in government, sense of corruption, and competency of authoritiesMaterial Well-Being
Financial security and meeting basic needsWork
Compensation, autonomy, and productivity
The indicator is measured using the
Cantril ladder
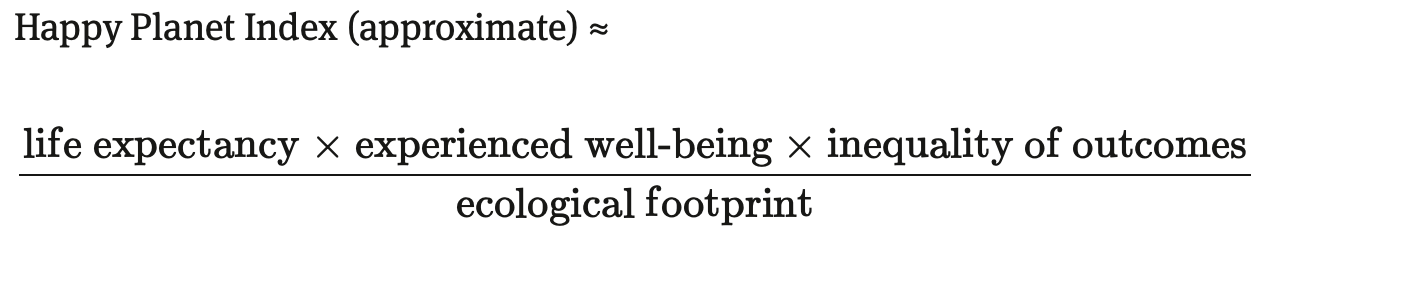
Happy Planet Index (HPI)
The Happy Planet Index (HPI) uses four indicators to demonstrate how efficiently residents of different countries are using environmental resources to lead long, happy lives. These indicators are:
well-being, which is how satisfied people are with the quality of their lives
life expectancy, which is how long people are expected to live for
inequality of outcomes, which measures the inequalities among people within a country and is expressed as a percentage
ecological footprint, which is the average impact that people make on the environment
Because of the inclusion of ecological factors, some of the wealthier countries do not figure at higher ranks in the list.