(Population Trends: DTM Models) Geo 2024
1/6
Earn XP
Name | Mastery | Learn | Test | Matching | Spaced | Call with Kai |
|---|
No analytics yet
Send a link to your students to track their progress
7 Terms
The Origin of the DTM model
-A model which works to show the various stages stages of population through the Industrial Revolution and Present (since 1929)
→ based on historic birth and death trends
-Model does not account for migration
DTM Stage: 1) HIGH STATIONARY
Birth Rate = High
Death Rate = High
Natural Increase = Low to zero - fluctuating
Reasons for Pattern = Wars, pandemics, agricultural (large families = workforce), high infant mortality, inadequate sanitation and health care
Country Examples = all countries up to 1800s
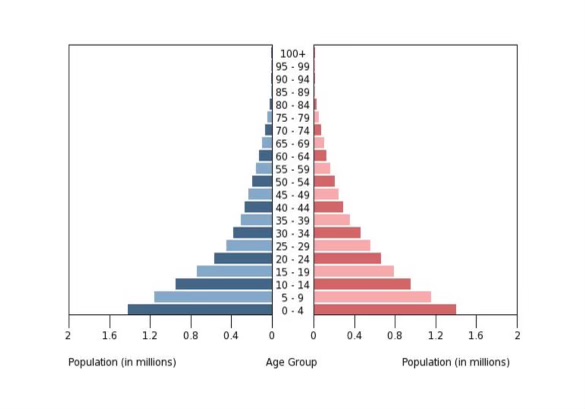
DTM Stage: 2) EARLY EXPANDING
Birth Rate = High
Death Rate = Decreasing
Natural Increase = High
Reasons for Pattern = Modern medicine introduced - “germ theory of disease,” (infant mortality rate = decreasing), improvements in agriculture and sanitation, education
Country Examples = Guatemala, Palestine, Yemen
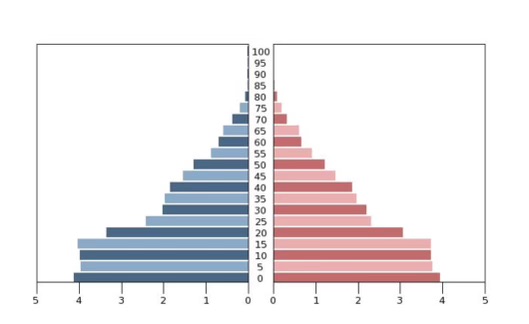
DTM Stage: 3) LATE EXPANDING
Birth Rate = Decreasing
Death Rate = Low
Natural Increase = High but decreasing
Reasons for Pattern = Increase in women’s status, education and birth control, improved medicine
Country Examples = Jamaica, India
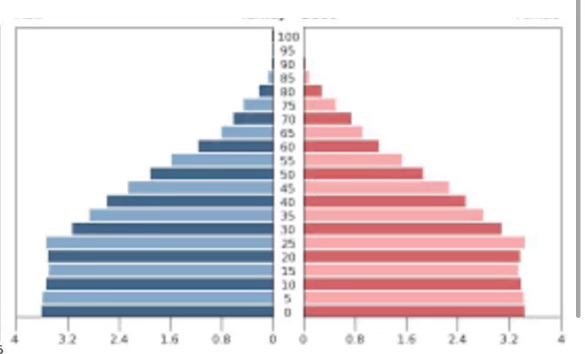
DTM Stage: 4) LOW STATIONARY
Birth Rate = Low
Death Rate = Low
Natural Increase = Low to Zero
Reasons for Pattern = Stronger economy, healthcare, education, working women, fertility rate = 2 or lower
Country Examples = Most developed countries
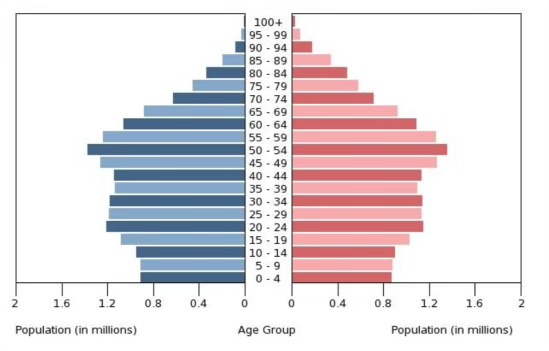
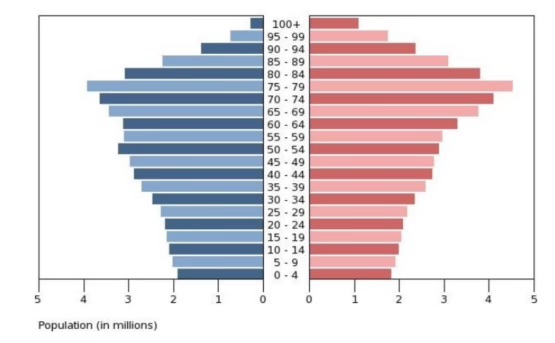
DTM Stage: 5) DECLINING
Birth Rate = Low
Death Rate = Low (but higher than birth rate)
Natural Increase = Decreasing
Reasons for Pattern = Aging population, population policies (Ex. china’s one-child policy), some growth due to net migration rates
Country Examples = Germany
TRICK QUESTION ABOUT POPULATION: How many children does one need to have to increase the population?
a couple needs 3 kids to add to the population → replaces two parents, plus one more → steady increase