Looks like no one added any tags here yet for you.
The true nature of most variables is to distribute ___
normally
___ ___ usually gets a distribution closer to distributing normally
More data
Ways to describe types of curves:
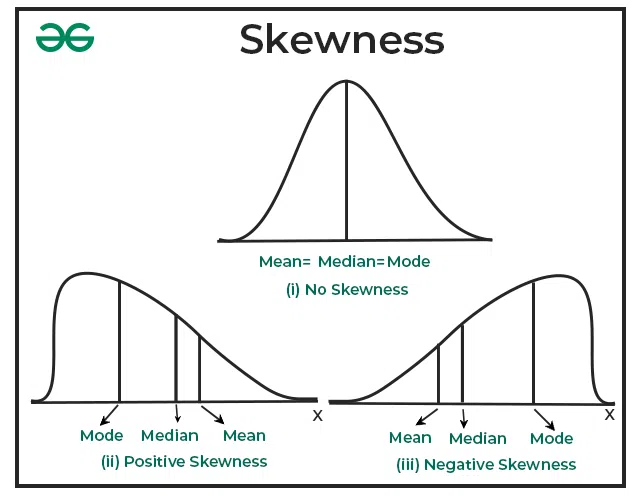
Skewness
Kurtosis
Modality
Skewness
What direction the tail is pulled; where the outliers are
Positive skew
Negative skew
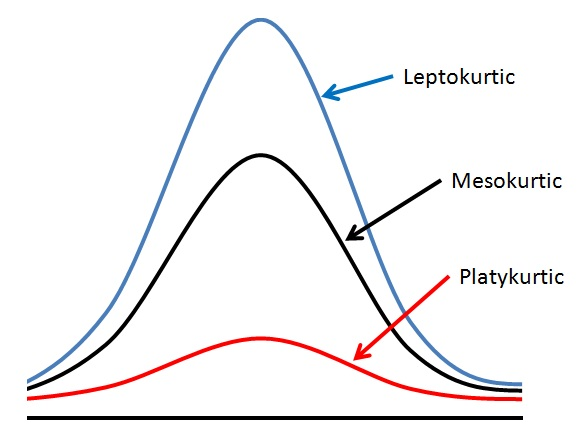
Kurtosis
Describes the observed data around the mean; the “tailedness” of the distribution
Leptokurtic: tall; tails are “fatter” (more tail relative to the center)
Mesokurtic: normal
Platykurtic: flat, even distribution; tails are “skinnier” (less tail relative to the center)
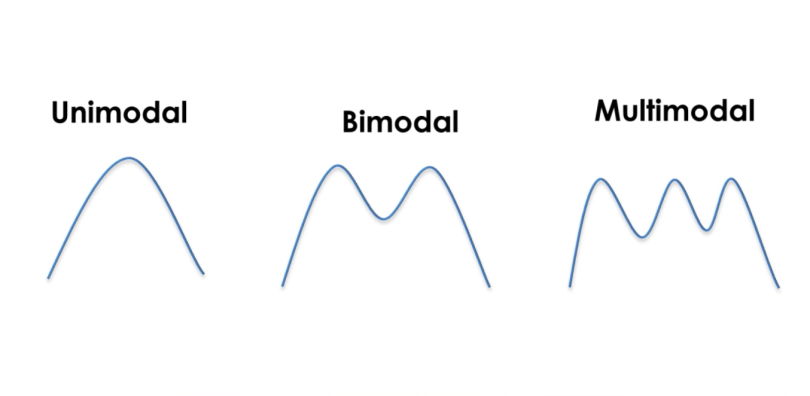
Modality
The number of “peaks” (modes) in the distribution
Uniform (0)
Unimodal
Bimodal
Multimodal
Population vs. sample
Population
Parameters
μ (mu; mean)
σ (sigma; standard deviation)
Sample
Statistics
x̄ (mean)
S (standard deviation)
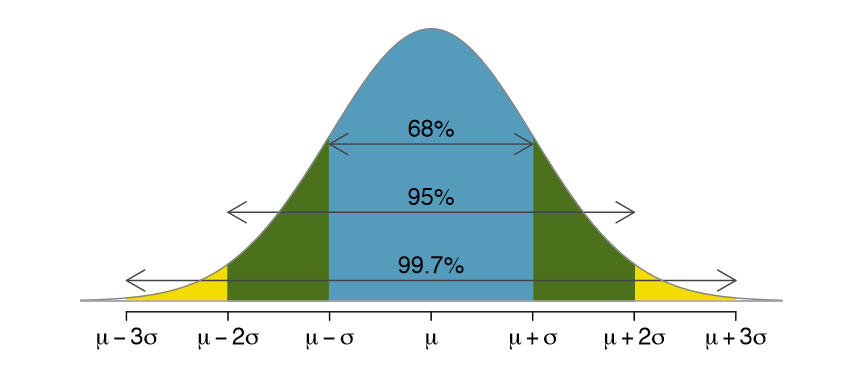
Z-score
The number of standard deviations a score is from the mean; standardizes units
Allows for comparison of extreme scores across populations
Allows for comparison of extreme scores across measurement scales
Determines percentiles and outliers
What is considered an extreme z-score?
Around -2, around +2
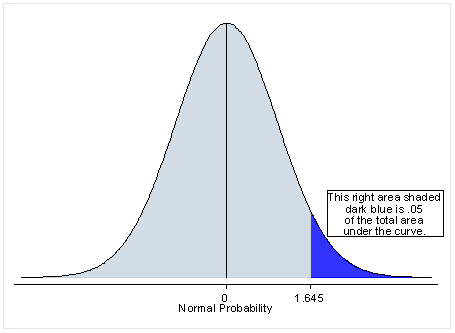
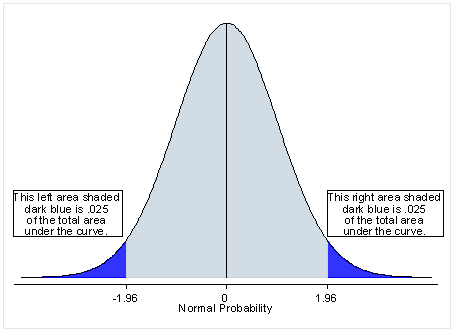
What is considered an outlier, assuming a normal distribution and a p-value of 0.05?
z = -1.96 (or less), z = +1.96 (or more)
The sign signifies direction
Falls into the last 2.5% (5%) total; tail ends
So this is a 95% confidence interval
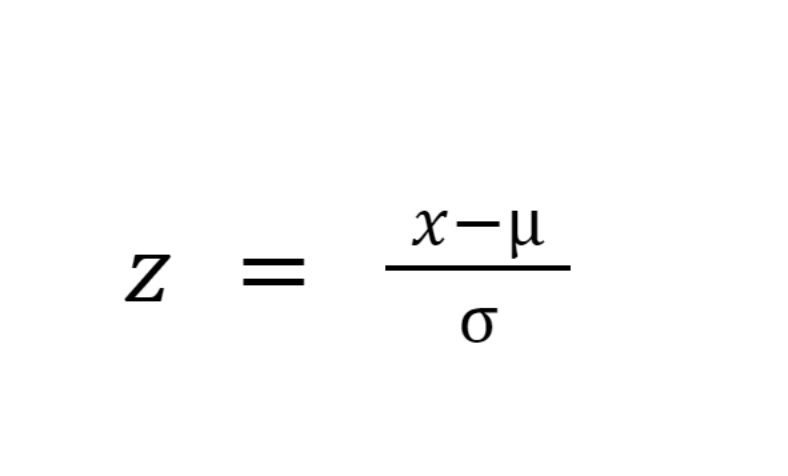
z-score equation
z = (x-μ) / σ
z = z-score
x = sample mean
μ = population mean
σ = population standard deviation
Steps of hypothesis testing:
State null and alternative hypotheses
Set decision rule (Where is the cutoff for significance?)
One-tailed test
Two-tailed test (gen. practice)
Calculate statistic
Null hypothesis
The effect being studied does not exist; no statistical significance exists
y = x
Alternative hypothesis
A direct contradiction of the null hypothesis; statistical significance exists
y > x
y < x
z-test
Continuous variable compared to a population with a known standard deviation
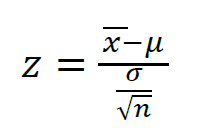
z-test equation
z = (x̄ -μ) / σx̄
σx̄ = σ / √N
σx̄: population standard error of the mean
With a sample size under ___, you cannot…
30, assume a normal distribution
Critical value
Depending on the sample size, the value that indicates the threshold of significance; if z or t are beyond it, then it is statistically significant
A smaller sample size (N) will…
increase the critical value (CV)
One-sample t-test
Use when comparing one sample to the population mean, and if the population mean is estimated and the standard deviation is unknown
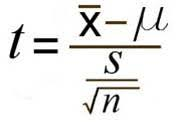
One-sample t-test formula
t = (x̄ -μ) / Sx̄
Sx̄ = S / √N
Sx̄: standard error of the sample mean
Tests of statistical significance:
z score
z test
One sample t-test
Independent sample t-test
Paired sample t-test
Z score tests…
a single score against a sample
Z test tests…
a sample against a population (with a known standard deviation)
One sample t-test tests…
a sample against a population (with an unknown standard deviation)
Independent sample t-test tests…
two independent samples against each other
Paired sample t-test tests…
paired samples against each other
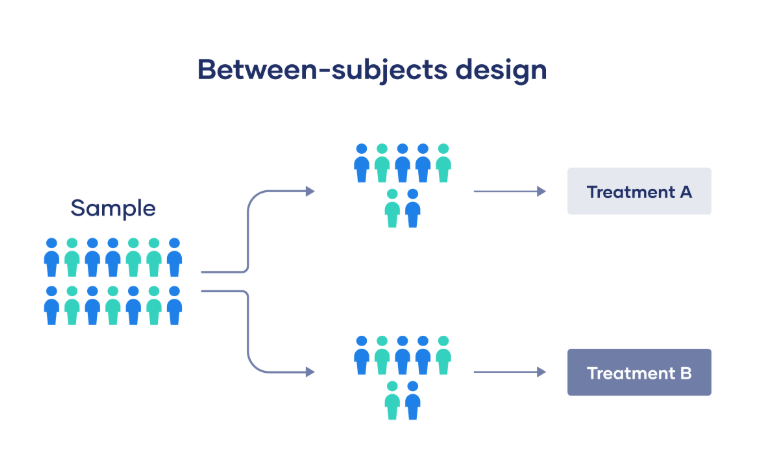
Between-subjects design
Group A vs. Group B; every participant experiences only one condition, and you compare group differences between participants in various condition
Participant effects
Independent samples t-test
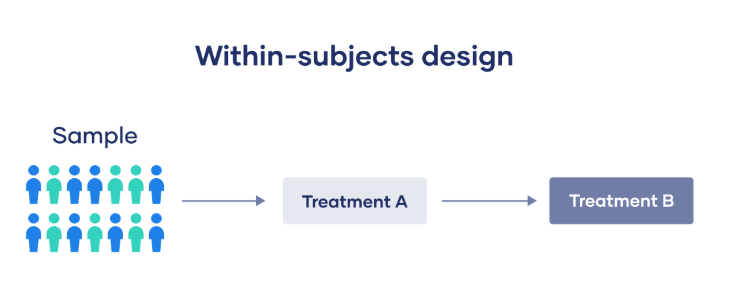
Within-subjects design
Group A.1 vs. Group A.2; every participant experiences every condition (at diff. times)
Order effects
Paired samples t-test
Degrees of freedom (df)
The maximum number of logically independent values
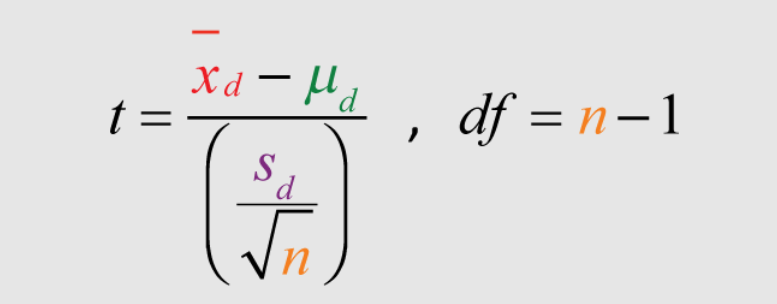
Formula: N - 1 (per group)
E.g., two separate samples of 20; df=18
E.g., one sample of 30; df=29
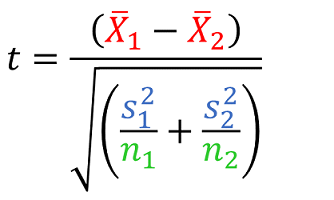
Independent sample t-test formula
t = (x̄1 - x̄2) / (Sx̄1 - Sx̄2)
Sx̄1 - Sx̄2 = √(S12 / N1) + (S22 / N2)
Sx̄1 - Sx̄2: standard error of the difference in means
Use an independent samples t-test if…
Comparing one sample to another sample
Samples are independent
IV is categorical
DV is continuous
When estimating t-value, look at…
Sample size
Means
Variance
Paired sample t-test formula
t = x̄D - μD / SDˉ
SDˉ = SD / √N
x̄D = Σ(x1 - x2) / N
SD = √Σ((x1 - x2) - xD) 2 / df
Use a paired samples t-test if…
Comparing one sample to another sample
The samples are paired (same subjects, different conditions)
IV is categorical
DV is continuous
One-tailed hypothesis
When the hypothesis has ONE direction of interest (EITHER greater than the null or less than the null)
One-tailed test significance (p = 0.05)
5% error in one direction (one tail)
This may make it easier to attain significance, as the margin is entirely concentrated on one side
Two-tailed hypothesis/test
When the hypothesis has no particular direction of interest (greater than OR less than the null)
Two-tailed test significance (p = 0.05)
2.5% error in BOTH directions (both tails)
This may make it more difficult to attain significance, as there is a smaller margin
How effect size influences t-value
Larger effect size leads to higher t-value
How power influences t-value
Higher power increases t-value
How variability influences t-value
More variability decreases t-value