Biostats exam 2
1/46
There's no tags or description
Looks like no tags are added yet.
Name | Mastery | Learn | Test | Matching | Spaced | Call with Kai |
|---|
No analytics yet
Send a link to your students to track their progress
47 Terms
What is a central tendency score
a calculated value or measure that represents, or is typical of the ENTIRE distribution of scores
what are 3 examples of central tendency
Mean, median, mode
What is the definition of mean
arithmetic average of all scores
Mean is appropriate for ______ or ______ data but not _____ or ____ scaled data.
appropriate for ratio or interval
NOT nominal or ordinal
The _____ is the point in a distribution that divides the scores in two equal parts
median
Median is appropriate for ____, ____, or ____ data, but not ____.
Median is appropriate for ratio, interval, or ordinal data, but not nominal.
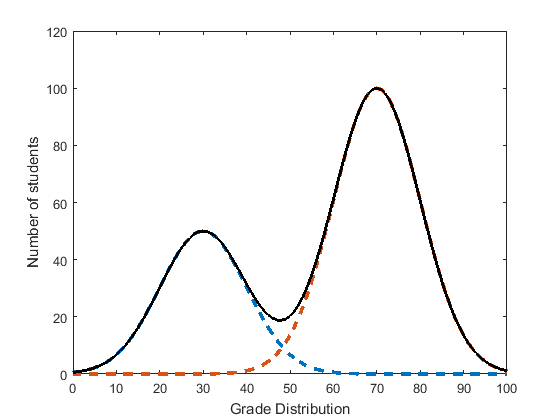
The ______ is the most frequently appearing score(s) in a distribution
mode
If there is 2 modes, known as ____ _____
bimodal distribution
Mode is appropriate for ____ and _____ data.
ordinal, nominal
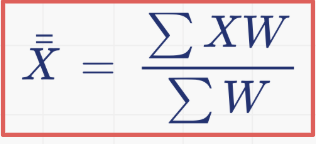
the ____ _____ is the best estimate of the population parameter μ.
weighted mean
Weighted mean formula
weighted mean = sum (number x weighting factor)/sum of all weights
What is variability
a measure of dispersion
how disperse a group of scores are from each other or the degree to which individual scores in a data set differ from one another.
what type of statistic is variability
descriptive
what are 3 measures of variability
Range, Interquartile Range, Standard Deviation
Range calculation
HIGHEST score in a data set minus the LOWEST score.
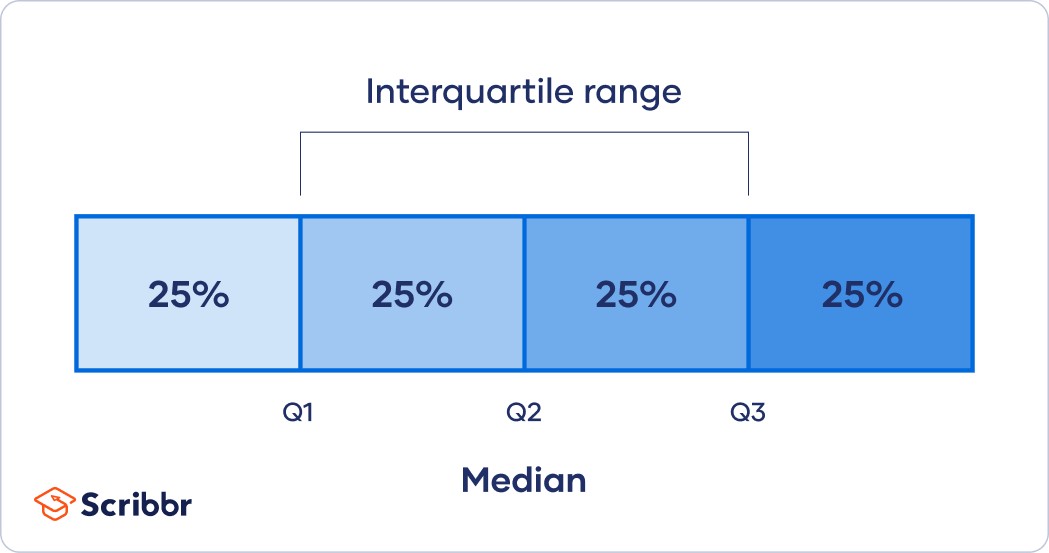
What is the interquartile range
A range of scores that make up the middle 50% of the distribution of scores (between the 25th percentile score and the 75th percentile score)
IQR calculation
75th percentile - 25th percentile
What is standard deviation
a calculated number that represents the average deviation (distance) between the mean and the observed scores
what are the 3 types of standard deviations
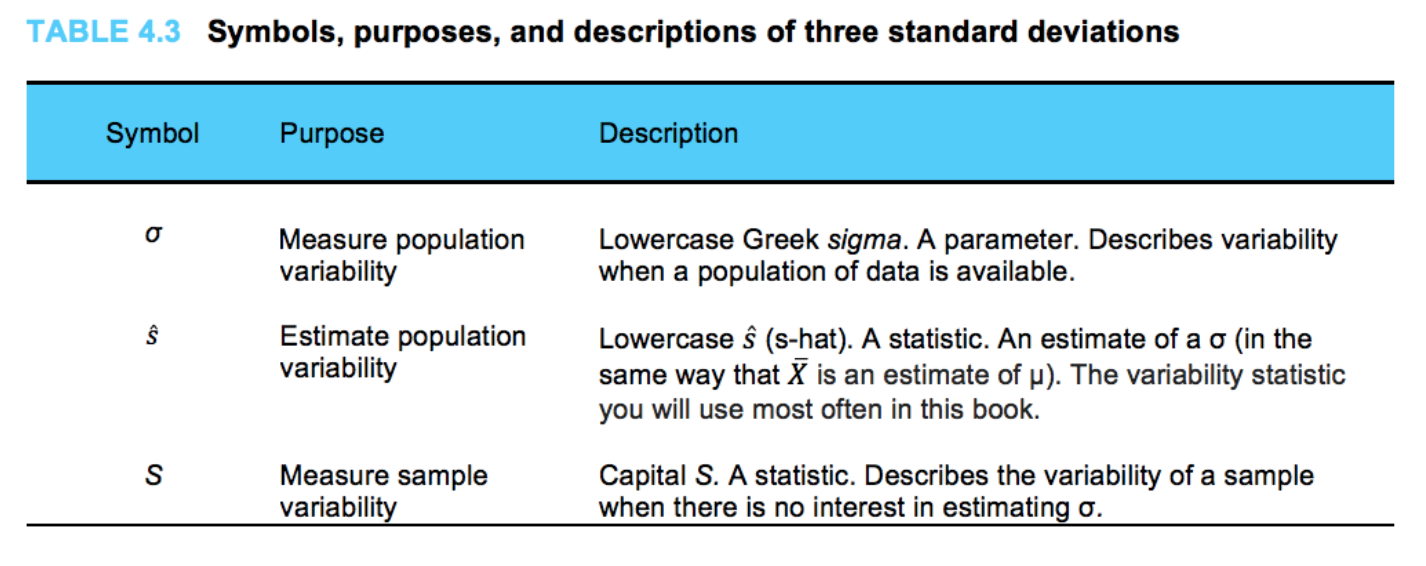
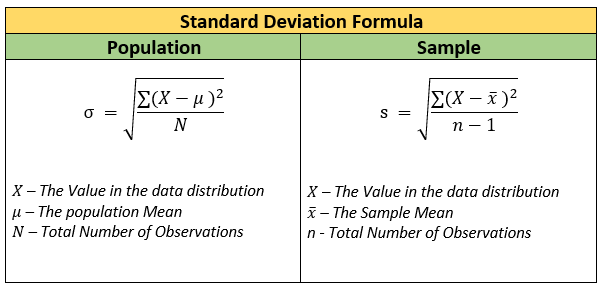
What is the difference btwn standard deviation of population vs sample
population: its Greek symbol is σ and it is a parameter.
used when known, if unknown, use estimate
sample: Represented by capital S because it is a statistic.
Calculation: Find the deviation score, a raw score in a data set, minus the mean.
Raw scores greater than the mean have ______ deviations.
Raw scores less than the mean have _____ deviations.
greater= positive
less= negative
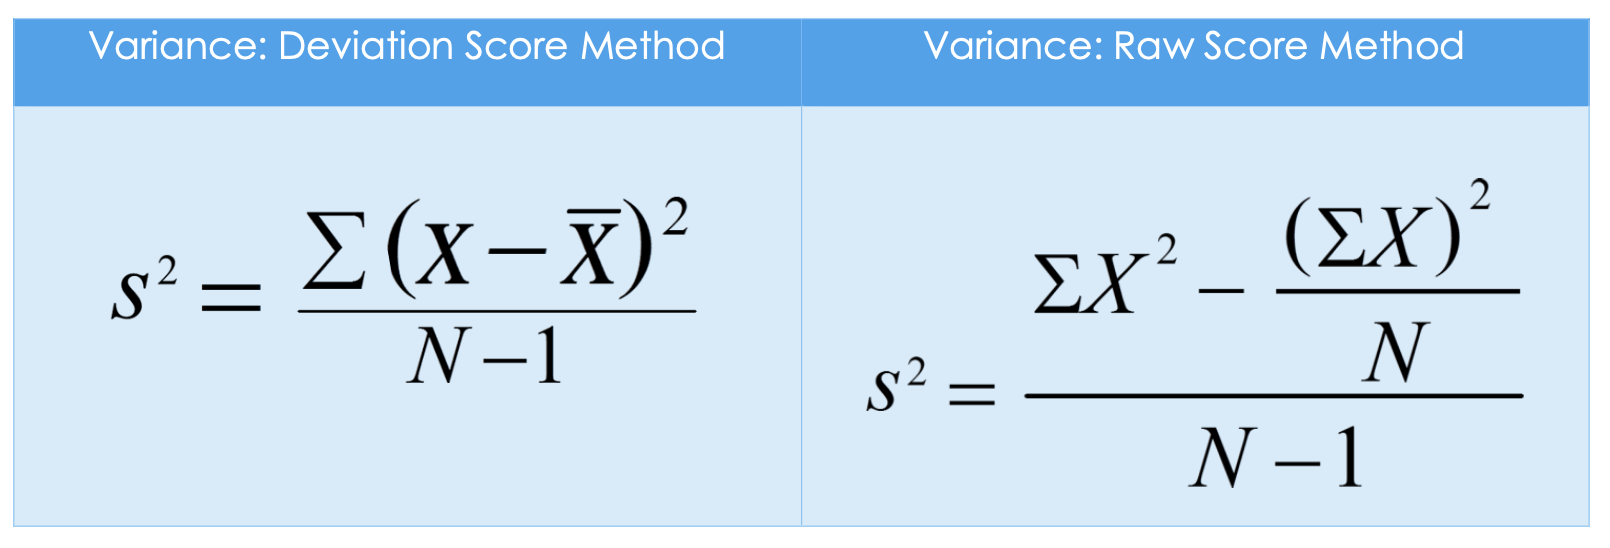
what is the formula for standard deviation
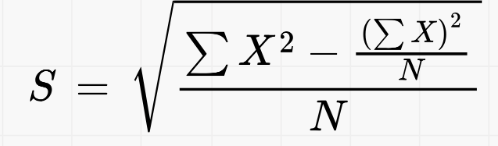
What is the formula for the raw score method of standard deviation
Adjusted Standard Deviation (Ŝ) formula
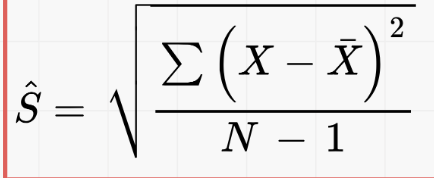
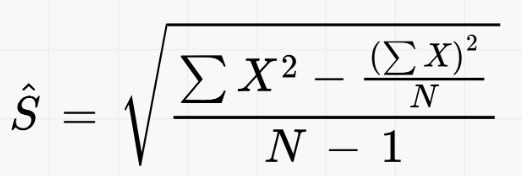
What is the difference between Ŝ and σ
same formula but Ŝ is N-1
What is variance
another descriptive statistic that is also a measure of dispersion (variability); more helpful in inferential statistic calculations
σ2
S2
How to calculate variance from standard deviation
standard deviation squared
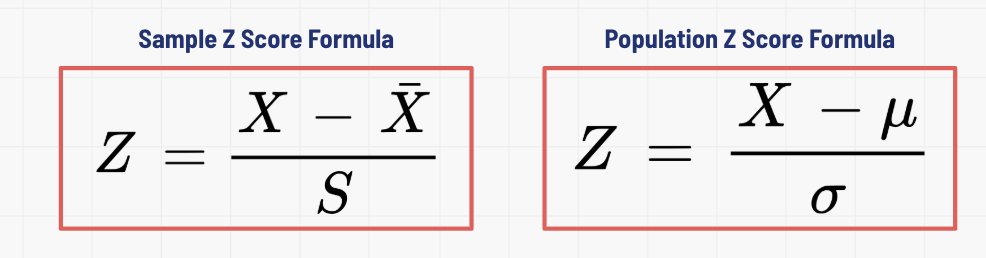
What is a z score
combines a raw score (X) with the mean and standard deviation of a distribution to know the relative standing of the raw score in that distribution
What is the purpose of a z score
extracts meaning from a distribution of scores, shows score’s relationship to the mean and standard deviation
aka standard score
Z score formula
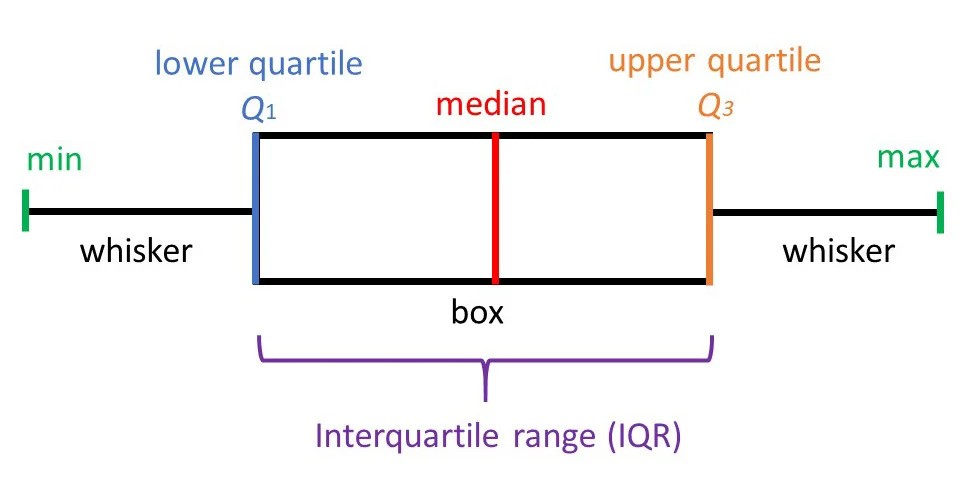
what are the 3 distributions that are shown in a box plot
Central tendency (mean, median)
Variability (range, standard deviation)
Form or shape (normal vs skewed)
what does the dot in the box of a box plot mean
Mean (X̄)
what does the vertical line in the box plot mean
median
what do the left and right sides of the box mean
25th and 75th percentiles
what do the whiskers/horizontal lines mean
range
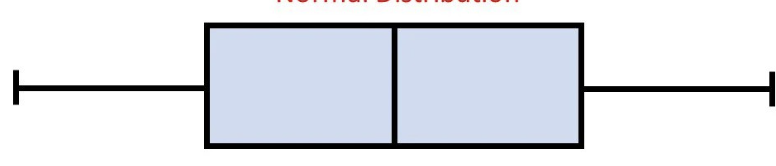
what kind of box plot distribution is this
normal distribution
what kind of box plot distribution is this
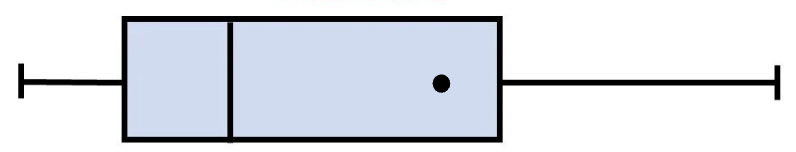
positive skew
what kind of box plot distribution is this
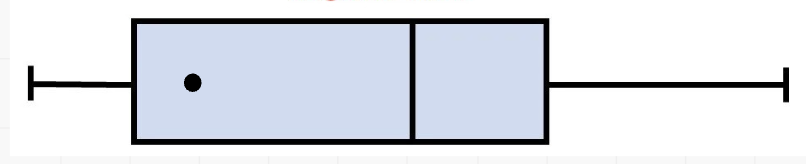
Negative skew
In a positive skew, how does the mean relate to the median
Mean > Median
In a negative skew, how does the mean relate to the median
Mean < Median
What does the effect size show
a calculation that allows us to answer the following question: “How much difference is there?” or “How meaningful is the difference?”
what is the formula for effect size
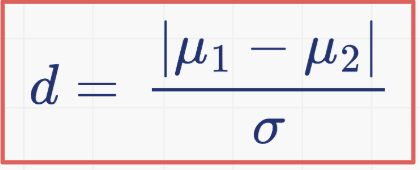
What does d < 0.2 mean
meaningless effect size
what does d=
what does d= 0.5-0.79 mean
medium effect size
what does d= 0.80 or larger mean
large effect size
what is univariate vs bivariate data mean
univariate= one variable data
bivariate= relationship btwn 2 variables