AP Environmental Science Review
1/197
Earn XP
Description and Tags
All AP Classroom questions for the first semester
Name | Mastery | Learn | Test | Matching | Spaced |
|---|
No study sessions yet.
198 Terms
This biome contains plants that are adapted to prevent water loss due to the low average rainfall and high temperatures year-round.
Desert
This biome is characterized by long dry seasons and is dominated by grasses, shrubs, and grazing animals.
Savanna
This biome is warm and wet, with little seasonal variation in temperature and frequent precipitation.
Tropical Rainforest
Which of the following statements is true of aquatic biomes?
A.
Freshwater and marine biomes are evenly distributed on Earth.
B.
Freshwater biomes are a vital source of drinking water.
C.
Freshwater biomes supply a greater portion of Earth’s oxygen than marine biomes.
D.
Marine biomes include streams, rivers, ponds, and lakes.
Freshwater biomes are a vital source of drinking water.
Which of the following biomes is best characterized as an area that forms the narrow band along the coast that experiences a range of environmental conditions (including daily changes in sunlight, temperature, and water) ?
A
Open ocean
B
Lakes
C
Coral reefs
D
Intertidal zones
Intertidal zones
Where is the majority of fresh water found on Earth?
Ice caps and glaciers
Which of the following best describes gross primary productivity in an ecosystem?
A
Gross primary productivity is the total amount of energy captured by producers plus the energy used by consumers over time.
B
Gross primary productivity is the total amount of energy captured by producers minus the energy that producers respire over time.
C
Gross primary productivity is the total amount of energy lost as heat during energy transfer between trophic levels.
D
Gross primary productivity is the total amount of solar energy captured by producers through photosynthesis over time.
Gross primary productivity is the total amount of solar energy captured by producers through photosynthesis over time.
Which of the following best describes the net primary productivity of an ecosystem?
A
Net primary productivity is the amount of energy captured by producers through photosynthesis over time.
B
Net primary productivity is the amount of energy lost by producers through respiration over time.
C
Net primary productivity is the amount of energy lost through respiration by producers subtracted from the gross primary productivity of an ecosystem.
D
Net primary productivity is the amount of energy lost through respiration by producers added to the gross primary productivity of an ecosystem.
Scientists calculated the net primary productivity at two different forest sites. Both forests have the same gross primary productivity. Forest A has a net primary productivity of 1,650 kcal/m²/year, and forest B has a net primary productivity of 1,110 kcal/m²/year.
Which of the following statements is best supported by the data?
Responses
A
Forest A has a higher rate of decomposition by bacteria than forest B.
B
Forest A has more biodiversity than forest B.
C
Forest A producers have lower rates of cellular respiration than forest B producers.
D
Forest A producers have more biomass than forest B producers.
Forest A producers have lower rates of cellular respiration than forest B producers.
In a given ecosystem, producers convert solar energy into 15,000 kcal of chemical energy stored in organic compounds. Which of the following is the most likely amount of energy available to secondary consumers?
150 kcal
Algae in an aquatic food chain convert solar energy into 93,000 kilocalories of plant tissue.
Which of the following values best represents the amount of energy available for primary consumers in the food chain?
9,300 kcal
Algae in an aquatic food chain convert solar energy into 93,000 kilocalories of plant tissue.
Which of the following values best represents the amount of energy available for secondary consumers in the food chain?
930 kcal
Which of the following statements about levels of biodiversity is correct?
A
Genetic biodiversity is a measure of the total number of genes in a community.
B
A narrow distribution of habitats leads to an increase in species diversity.
C
Global hotspots are areas where species diversity is thriving due to habitat restoration.
D
A population with high genetic biodiversity is better able to respond to environmental stressors.
A population with high genetic biodiversity is better able to respond to environmental stressors.
Which of the following best explains how environmental stressors, such as wildfires, can affect biodiversity in an ecosystem?
A
After an environmental stress, a genetic bottleneck may occur, which will increase genetic diversity.
B
Habitat diversity will increase the available niches if the landscape becomes more uniform after a disturbance.
C
Ecosystems with more species diversity are more likely to recover after a disturbance than ecosystems with low species diversity.
D
Smaller populations are less likely to go extinct than larger populations, so the species diversity will remain constant.
Ecosystems with more species diversity are more likely to recover after a disturbance than ecosystems with low species diversity.
Which of the following examples illustrates the community with the highest biodiversity?
The chart showing all 10
Based on the theory of island biogeography, which of the following is the most likely reason that an island in the ocean that is 5 kilometers from a continent would have a higher number of species than one that is 15 kilometers from a continent?
A
There are more species that have the ability to travel 5 kilometers than can travel 15 kilometers.
B
Islands that are closer to continents always have a wider range of habitats than more distant islands do.
C
There are smaller populations of each species on islands that are at greater distances from continents.
D
Islands that are closer to continents always have more ecological niches than more distant islands do.
There are more species that have the ability to travel 5 kilometers than can travel 15 kilometers.
A 163 square-kilometer small island is found 2000 km from the mainland. A second, larger, 230,000 km island is found 1000 km from the mainland. Based on the theory of island biogeography, which of the following statements is most likely true about the small island when compared with the large island?
A
The rate of immigration is lower for the small island than for the large island.
B
The small island has niches that are more like the mainland than the large island.
C
The small island has more available resources than the large island.
D
The rate of species extinction is lower on the small island than on the large island.
The rate of immigration is lower for the small island than for the large island.
Highly specialized species tend to evolve on islands because of the environmental conditions and resource availability.
Based on the theory of island biogeography, which of the following would most likely experience the greatest decline of specialist species if an invasive species emigrated from the mainland?
A
A small island a far distance from the mainland
B
A small island in close proximity to the mainland
C
A large island a far distance from the mainland
D
A large island in close proximity to the mainland
A small island in close proximity to the mainland
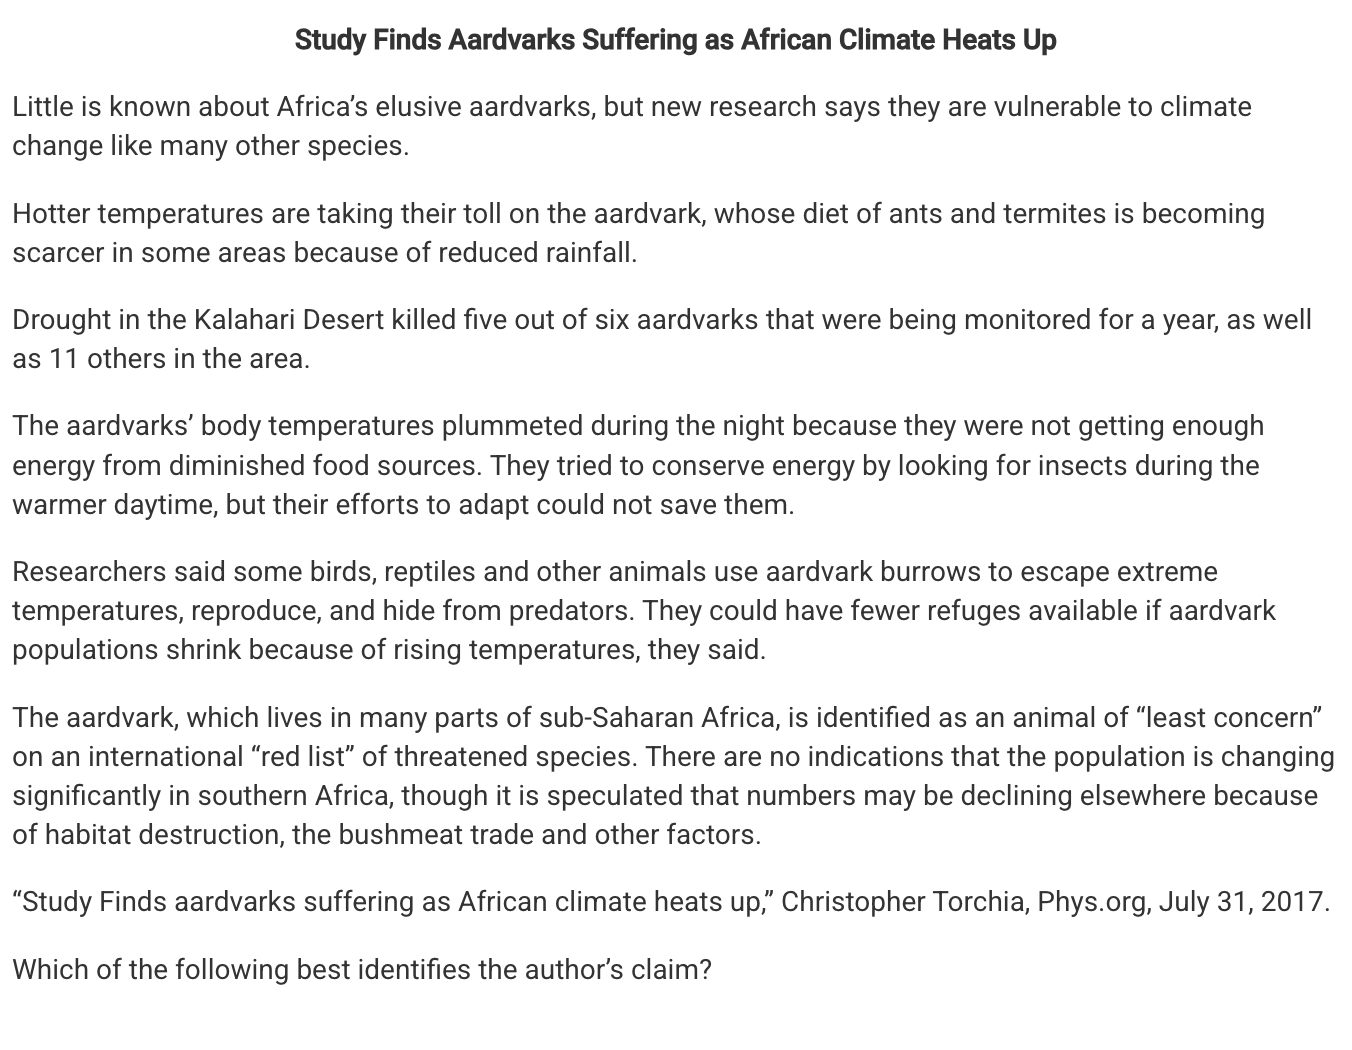
Which of the following best identifies the author’s claim?
A
Aardvarks are shifting the location of their territories as a response to global climate change.
B
Aardvarks are a keystone species and their decline could have a trophic cascade effect on the ecosystem.
C
The loss of aardvarks described in the study was an isolated incident because most aardvark populations are increasing globally.
D
Providing aardvarks with more burrows will help them maintain their body temperature and increase survival rates.
Aardvarks are a keystone species and their decline could have a trophic cascade effect on the ecosystem.
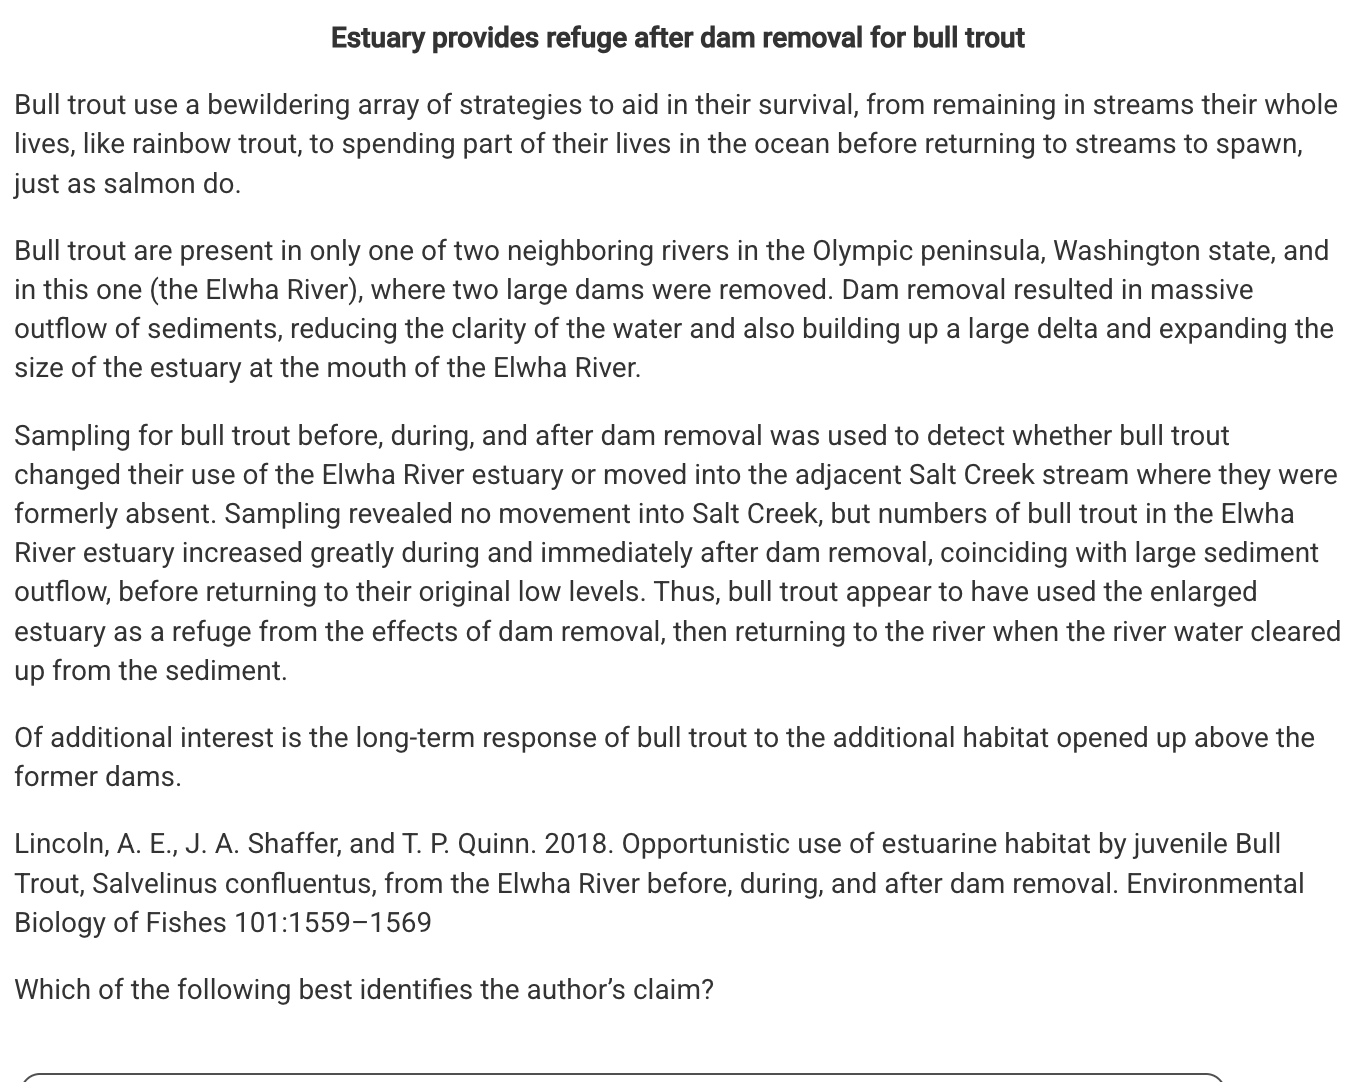
Which of the following best identifies the author’s claim?
A
Bull trout experienced high mortality rates as a result of the formation of the estuary and sediments released during dam deconstruction.
B
Bull trout are adaptable to a variety of habitats and were able to survive in the river habitat during the dam deconstruction.
C
Bull trout remained in the estuary system after the dam deconstruction because the disruption had irreversibly altered the river habitat.
D
Bull trout are unable to live in high sediment loaded waters and migrated to avoid the conditions introduced during dam deconstruction.
Bull trout are unable to live in high sediment loaded waters and migrated to avoid the conditions introduced during dam deconstruction.
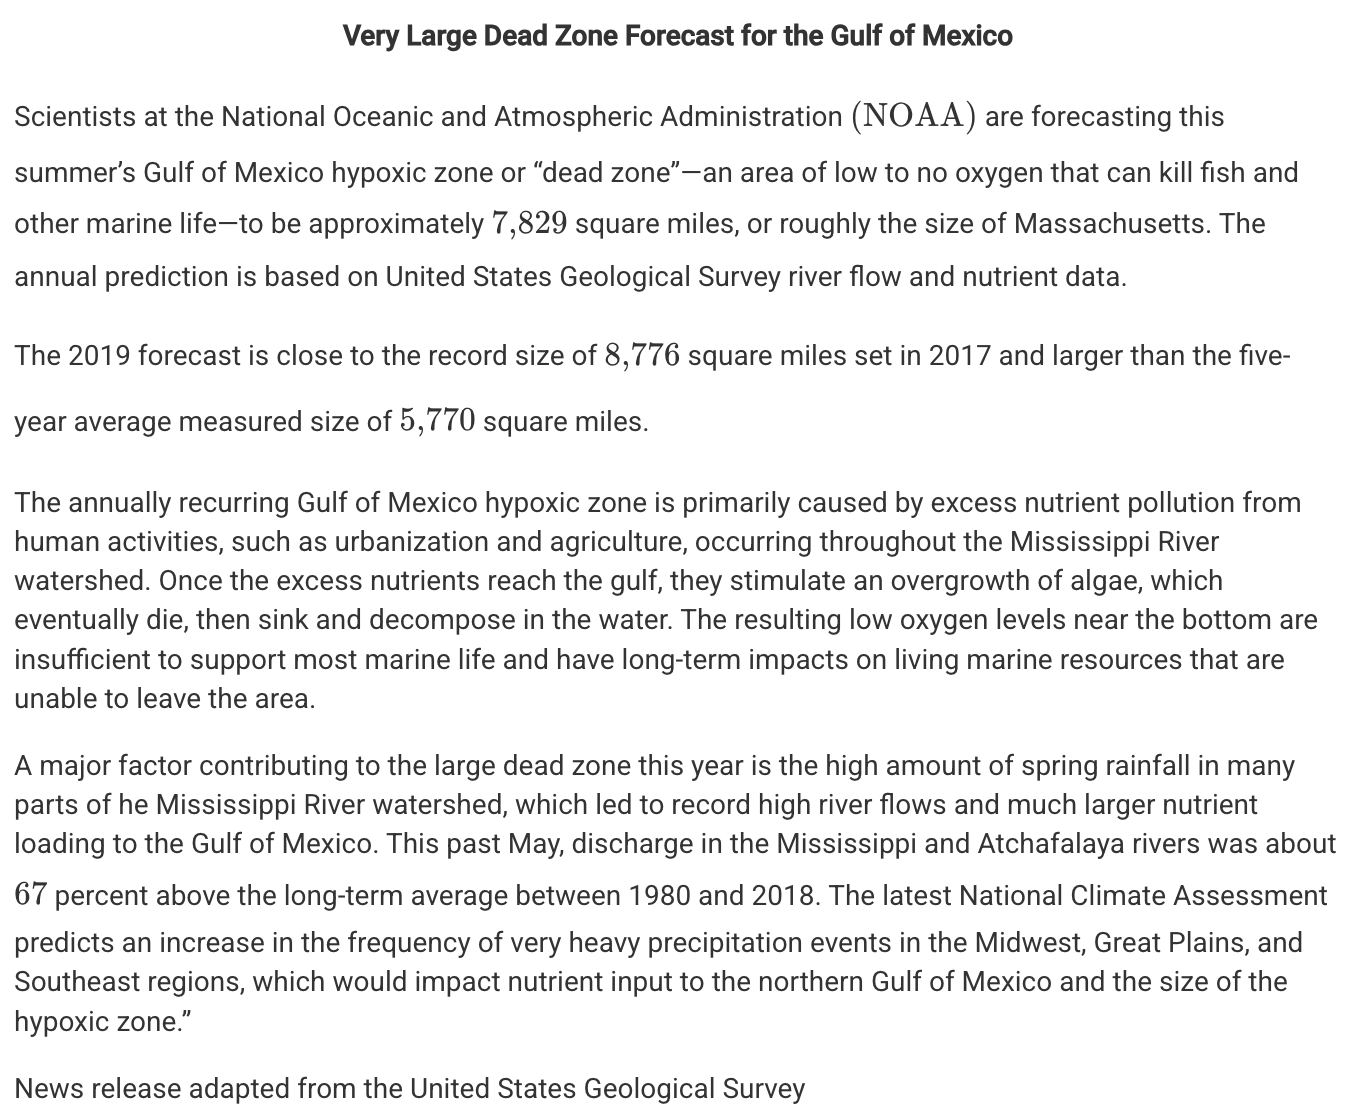
Which of the following best identifies the author's claim?
A
The increased size of the hypoxic zone in the Gulf of Mexico is forecasted to benefit the fishing industry in the United States.
B
The increased rainfall events in the United States are decreasing the tolerance of fish and other marine species in the Gulf of Mexico because of a decreased concentration of oxygen.
C
Many marine species are migrating away from the Gulf of Mexico as a result of increased nutrient pollution from increased rainfall events.
D
The large hypoxic zone in the Gulf of Mexico is directly linked to climate change in the Mississippi River watershed.
The increased rainfall events in the United States are decreasing the tolerance of fish and other marine species in the Gulf of Mexico because of a decreased concentration of oxygen.
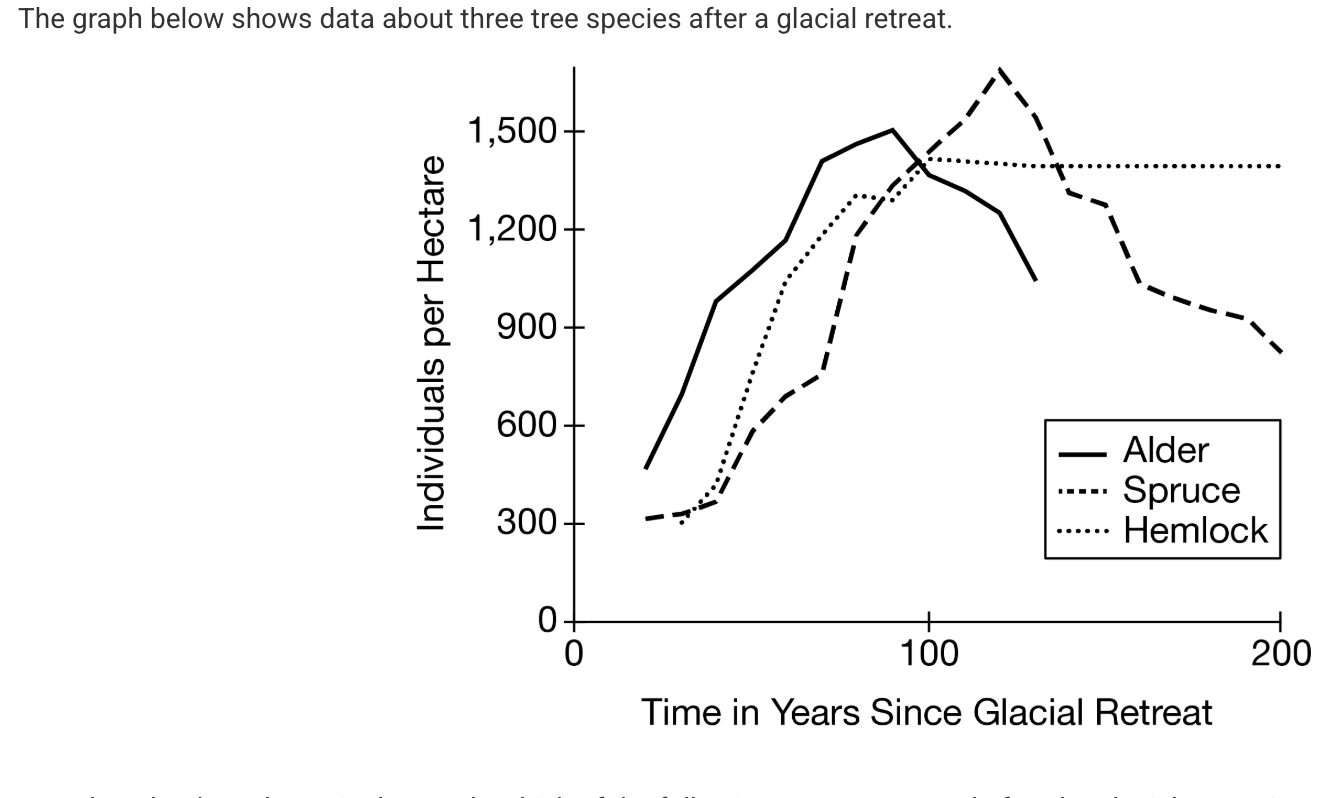
Based on the data shown in the graph, which of the following events occurred after the glacial retreat?
A
Primary succession
B
Flooding
C
Sea level rise
D
Global climate change
Primary succession
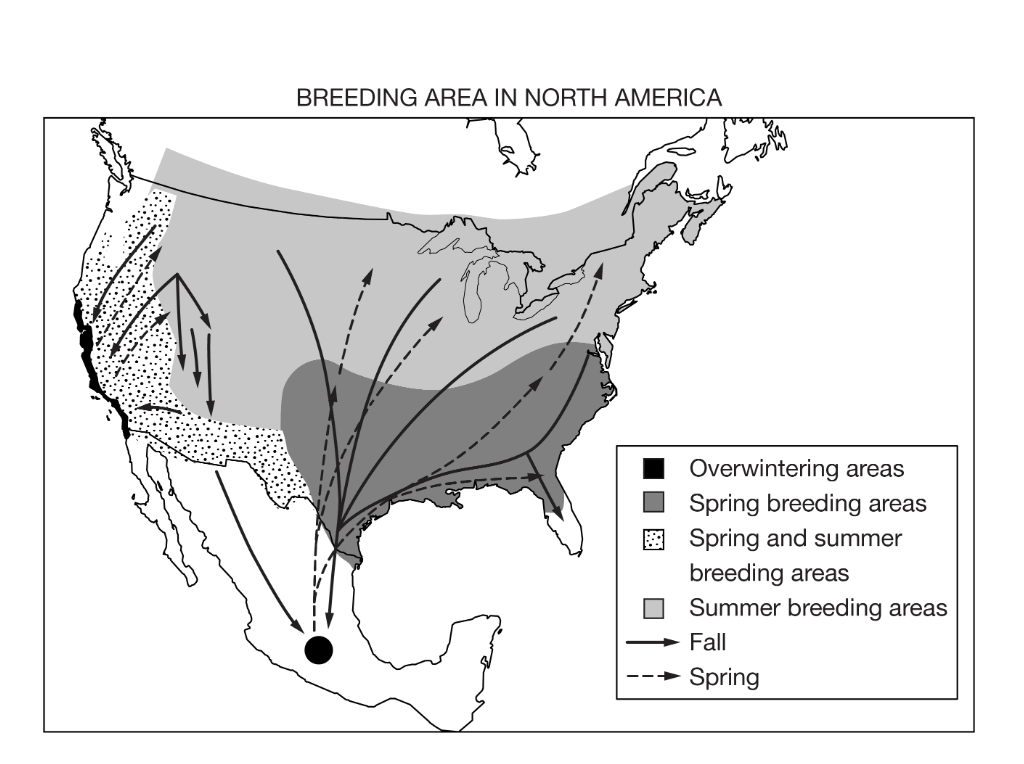
Which of the following explanations is best supported by the data shown in the map above?
A
Earth’s climate has changed over geological time, and plates on Earth’s crust have shifted.
B
Sea level rise has led to an increased concentration of wildlife inland as the coastal areas flood.
C
Organisms adapt to human population growth by changing at the genetic level.
D
Animals migrate seasonally to mate and to find food in different habitats.
Animals migrate seasonally to mate and to find food in different habitats.
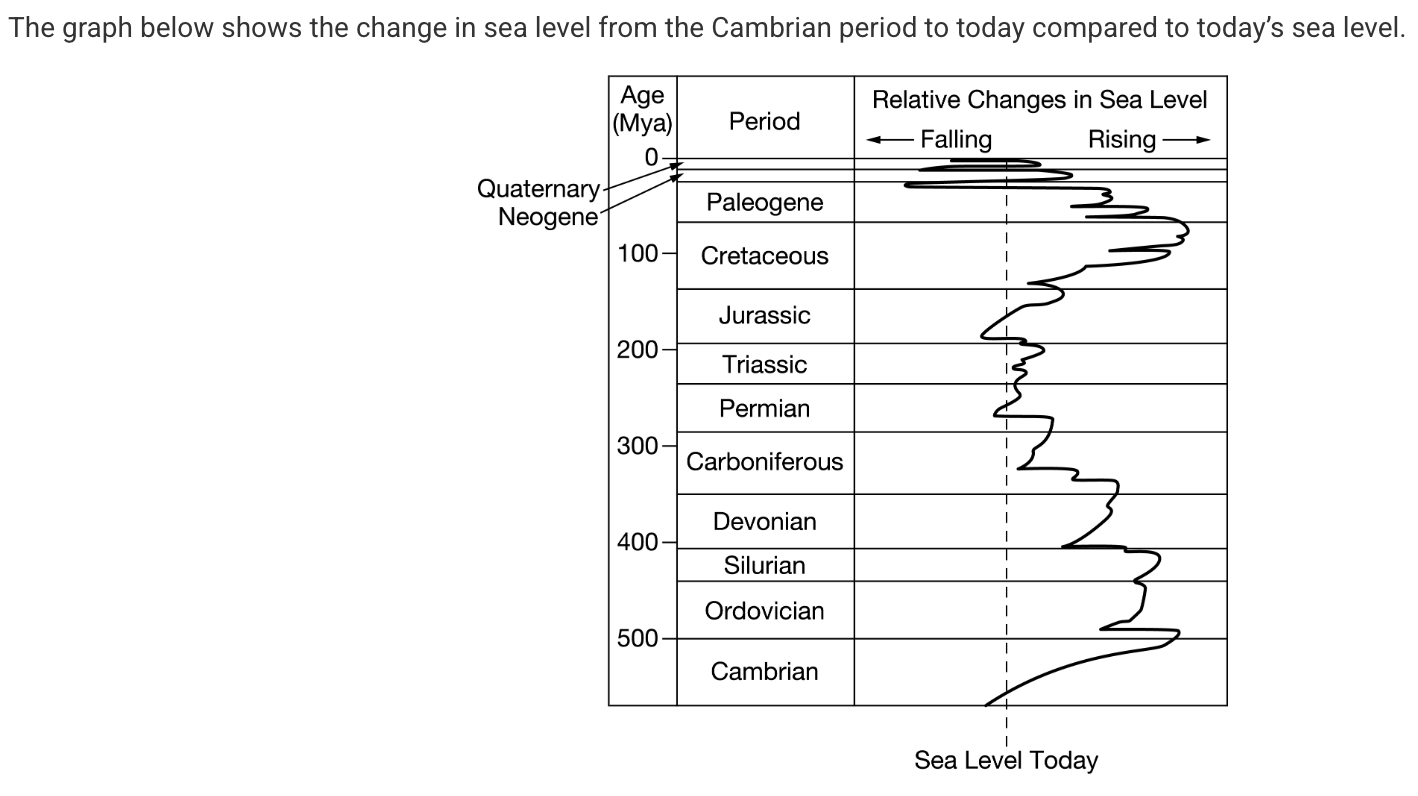
Which of the following statements correctly describes the trends seen in the data?
A
The highest sea level occurred in the Triassic period.
B
The lowest sea level occurred during the Paleogene period.
C
The first rise in sea level occurred during the Cretaceous period.
D
Sea level decreased from the beginning of the Triassic period to the end of the Cretaceous period.
The lowest sea level occurred during the Paleogene period.
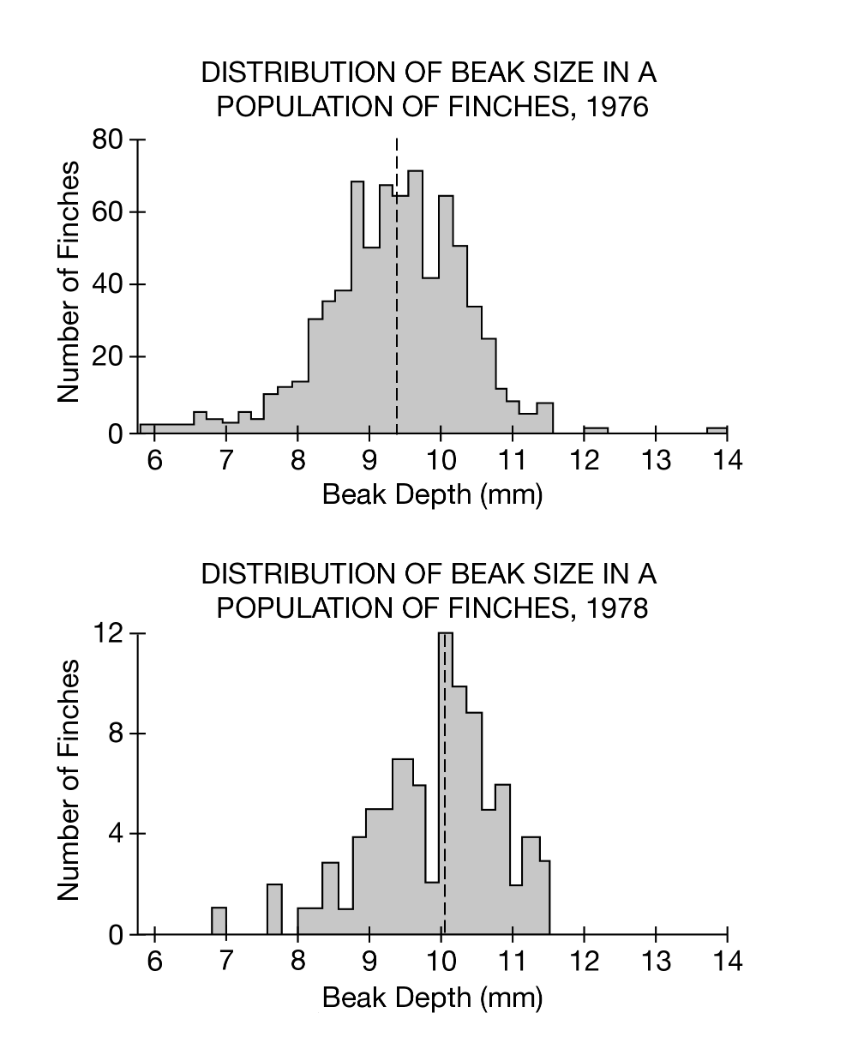
The graphs above show the population size and distribution of beak sizes in a finch population on the island of Daphne Major in the Galapagos in 1976 and 1978. Smaller-beaked finches are better suited for eating grasses and small seeds. Larger-beaked finches are better suited for cracking larger seeds and nuts. In 1977 a drought took place and the vegetation of the island was affected by the lack of rain.
Which of the following was the average beak size of finches on the island of Daphne Major in 1976?
A
8.8 mm
B
9.5 mm
C
10.2 mm
D
13.8 mm
9.5 mm

The graphs above show the population size and distribution of beak sizes in a finch population on the island of Daphne Major in the Galapagos in 1976 and 1978. Smaller-beaked finches are better suited for eating grasses and small seeds. Larger-beaked finches are better suited for cracking larger seeds and nuts. In 1977 a drought took place and the vegetation of the island was affected by the lack of rain.
Which of the following statements best explains the changes in the size and composition of the population of finches after the drought?
A
The total number of finches in the population increased, and the smaller-beaked finches were more successful in the drier environment.
B
The total number of finches in the population increased, and the larger-beaked finches were more successful in the drier environment.
C
The total number of finches in the population decreased, and the smaller-beaked finches were more successful in the drier environment.
D
The total number of finches in the population decreased, and the larger-beaked finches were more successful in the drier environment.
The total number of finches in the population decreased, and the larger-beaked finches were more successful in the drier environment.

The graphs above show the population size and distribution of beak sizes in a finch population on the island of Daphne Major in the Galapagos in 1976 and 1978. Smaller-beaked finches are better suited for eating grasses and small seeds. Larger-beaked finches are better suited for cracking larger seeds and nuts. In 1977 a drought took place and the vegetation of the island was affected by the lack of rain.
Which of the following was the number of finches in the population with a beak size of 10.2 mm in 1978?
A
8
B
12
C
40
D
65
12

Based on the data shown in the graph, which of the following best describes how ecologists could determine when this ecosystem is approaching a climax community?
A
Determine if the keystone species in the ecosystem is present two years after the volcanic eruption
B
Measure the biomass of the pioneer species present before and after the volcanic eruption
C
Record the number and type of producers present every year after the eruption
D
Calculate the net primary productivity of a specific indicator species every year after the eruption
Record the number and type of producers present every year after the eruption
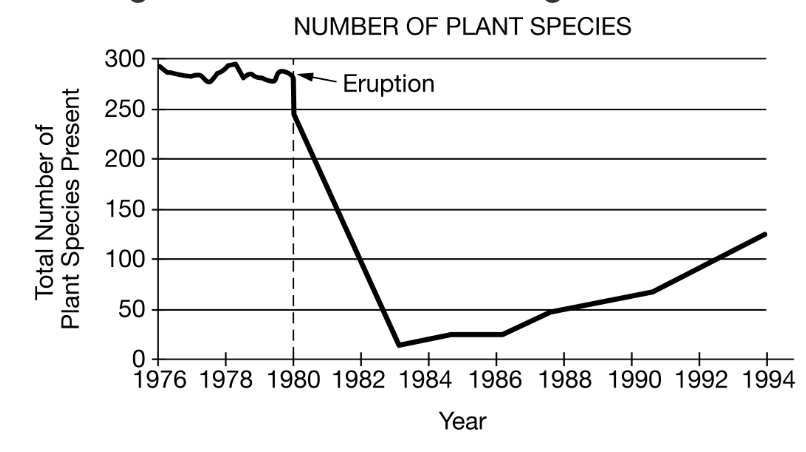
Based on the data shown in the graph, when would the species richness of the ecosystem have been the lowest?
A
Before the volcanic eruption occurred
B
One to four years after the volcanic eruption
C
Four to ten years after the volcanic eruption
D
Ten to fourteen years after the volcanic eruption
One to four years after the volcanic eruption

Which of the following claims is best supported by the data in the graph?
A
The temperature of Earth rises and biodiversity increases immediately after a volcanic eruption.
B
The carrying capacity of plants in the area is approximately 250 species.
C
After the volcanic eruption, pioneer species colonized the area and the ecosystem began to undergo succession.
D
Plant species that are well adapted will survive and reproduce, leading to a change in the ecosystem biodiversity through the process of natural selection.
After the volcanic eruption, pioneer species colonized the area and the ecosystem began to undergo succession.
Which of the following species is most likely to be an invasive species if introduced into a favorable new habitat?
A
Oysters producing 5,000,000,000 offspring per year
B
Fish producing 8,000 offspring per year
C
Rabbit producing 12 offspring per year
D
Bobcats producing 2 offspring per year
Oysters producing 5,000,000,000 offspring per year
Which of the following species is most likely to provide extensive parental care to its offspring?
A
Oysters producing 5,000,000,000 offspring per year
B
Fish producing 8,000 offspring per year
C
Rabbit producing 12 offspring per year
D
Bobcats producing 2 offspring per year
Bobcats producing 2 offspring per year
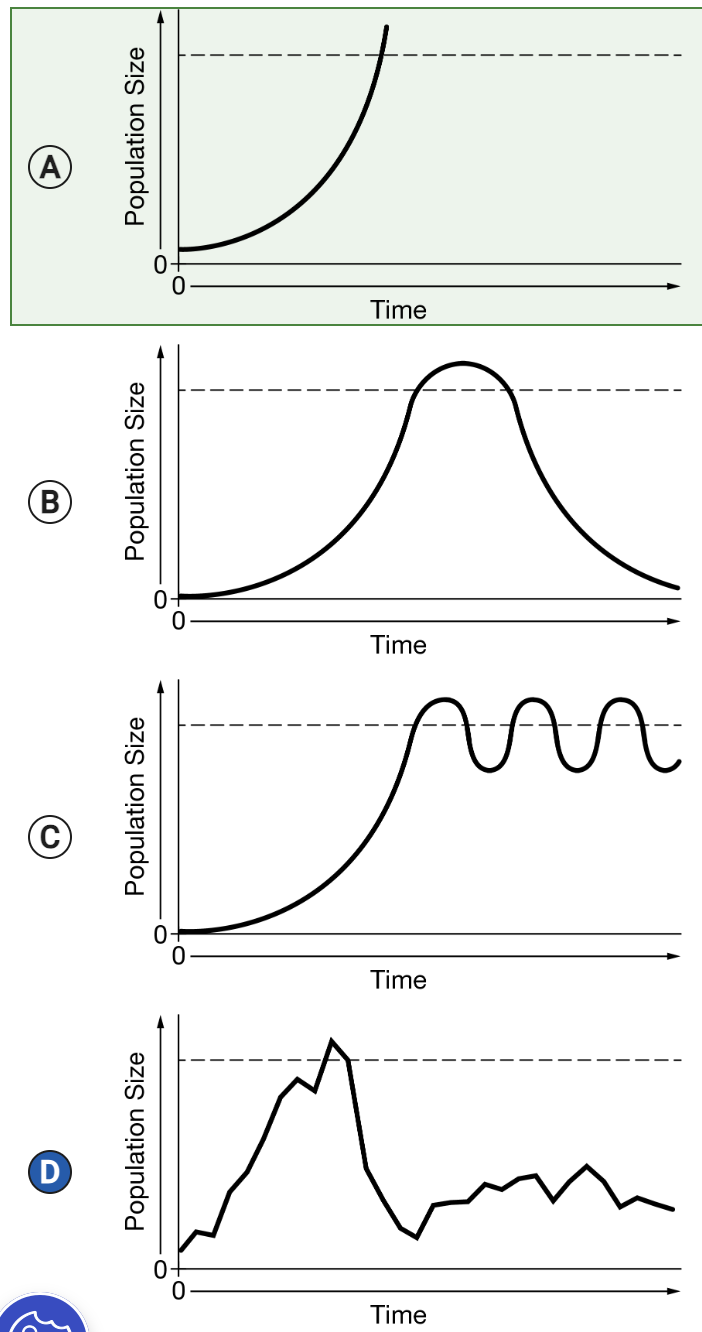
Which of the following graphs best displays population size over time of an r-selected species that has just colonized a new habitat with abundant resources?
The graph showing exponential growth

Cycads are gymnosperms that were diverse and abundant during the Mesozoic era. Extant species of cycads share many traits with those from the Mesozoic era. Cycads bear cones, are long-lived with slow growth rates, show late reproductive maturity, and have very few offspring. Based on this description, the cycads are
A
K-strategists with a Type I survivorship curve.
B
r-strategists with a Type III survivorship curve.
C
K-strategists with a Type III survivorship curve.
D
r-strategists with a Type II survivorship curve.
K-strategists with a Type I survivorship curve.

A certain species of dinosaur laid large numbers of eggs, and the hatchlings had high mortality early in life. But if they survived, the young dinosaurs were able to grow at a rapid pace and disperse into the environment in order to thrive. Based on this information and the graph above, which of the following best characterizes this species of dinosaur?
A
The dinosaurs were r-strategists and exhibited a Type I survivorship curve.
B
The dinosaurs were r-strategists and exhibited a Type III survivorship curve
C
The dinosaurs were K-strategists and exhibited a Type II survivorship curve.
D
The dinosaurs were K-strategists and exhibited a Type I survivorship curve.
The dinosaurs were r-strategists and exhibited a Type III survivorship curve
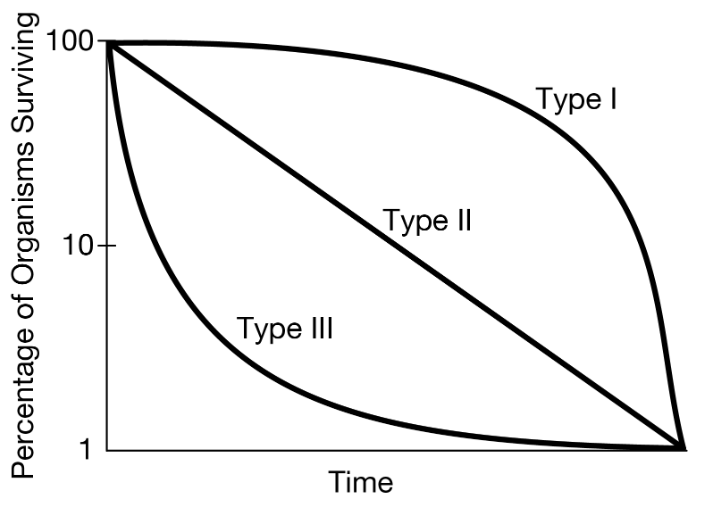
Scientists determined that a species of a reptile dinosaur cohort had 20% survivorship during the first two years of life, but then the survivorship of those individuals that survived to age 2 had a 70% survivorship to middle age. Survivorship declined later in life. Which of the following best illustrates the shape of the survivorship curve for this species?
The graph that flattens out slightly while decreasing

Which of the following claims is best supported by the data in the graph for the population of wolves between 1975 and 1985?
A
The population declined following depletion of food resources after a population overshoot.
B
The population reached its carrying capacity in 1980 because there was abundant prey.
C
The population increased exponentially when a new predator species was introduced to the island.
D
The population declined slightly and then returned to its carrying capacity following the outbreak of a disease.
The population declined following depletion of food resources after a population overshoot.

Which of the following best explains the change in the moose population from 1995 to 1997?
A
The large moose population led to a significant increase in the wolf population from 1995 to 1996, leading to increased predation of moose by wolves.
B
The high density of moose in the population led to a large number of moose emigrating from the island in search of mates and territory.
C
Plants in the area could not support the large population of moose in 1995.
D
The small number of wolves on the island could not support the large number of moose in 1995.
Plants in the area could not support the large population of moose in 1995.
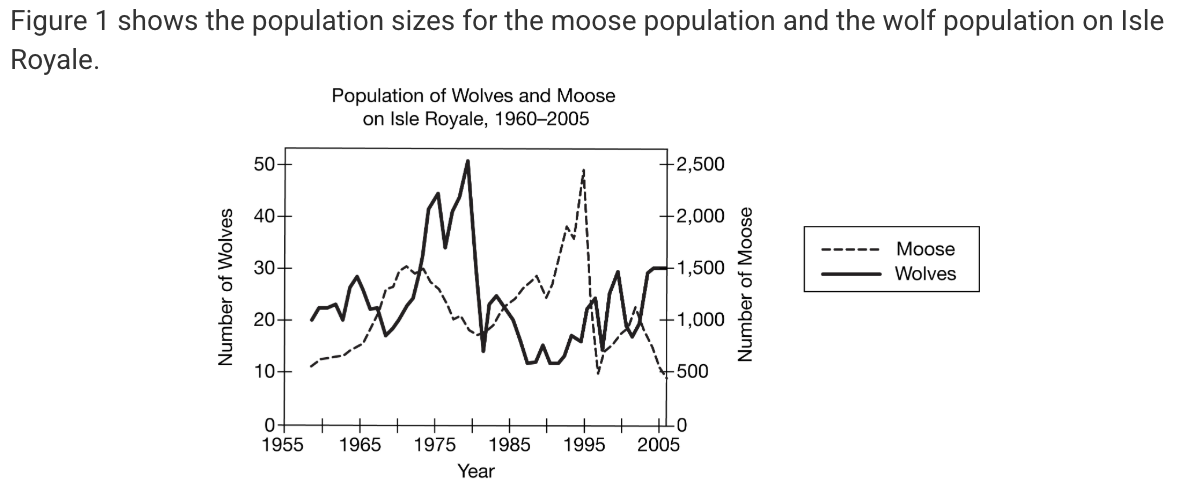
Based on the data in Figure 1, which of the following is the best estimate of the carrying capacity of the moose population?
A
30
B
50
C
1,500
D
2,500
1,500
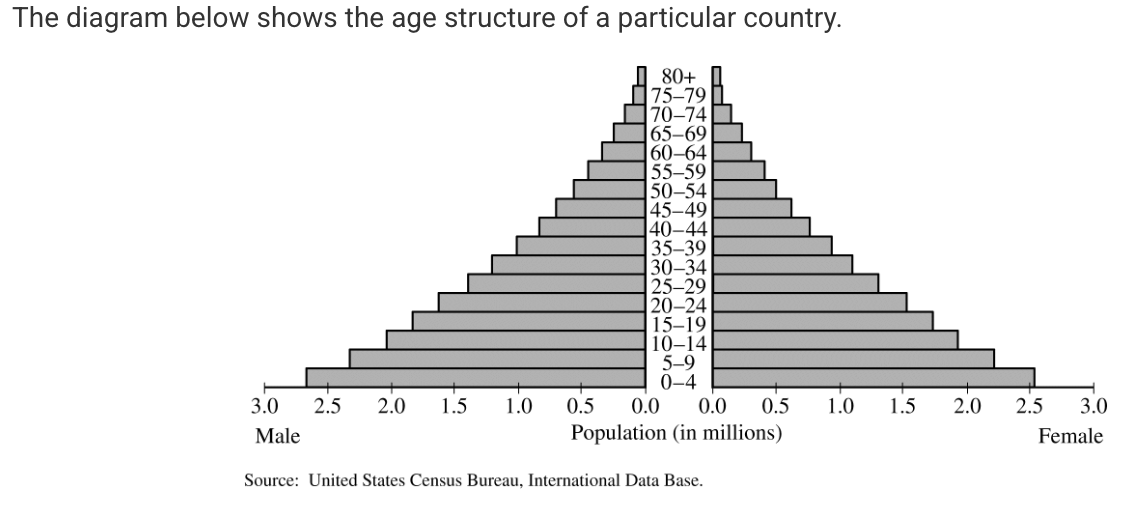
Which of the following characteristics is most closely associated with a country that demonstrates the age structure in the diagram shown above?
A
There is a low infant mortality rate.
B
A high percentage of the population has access to medical care.
C
There is a low population growth rate.
D
There is a high total fertility rate.
There is a high total fertility rate.
Which age-structure diagram best depicts the ages in a population that is in stage 3 of the demographic transition?
The half oval shape one
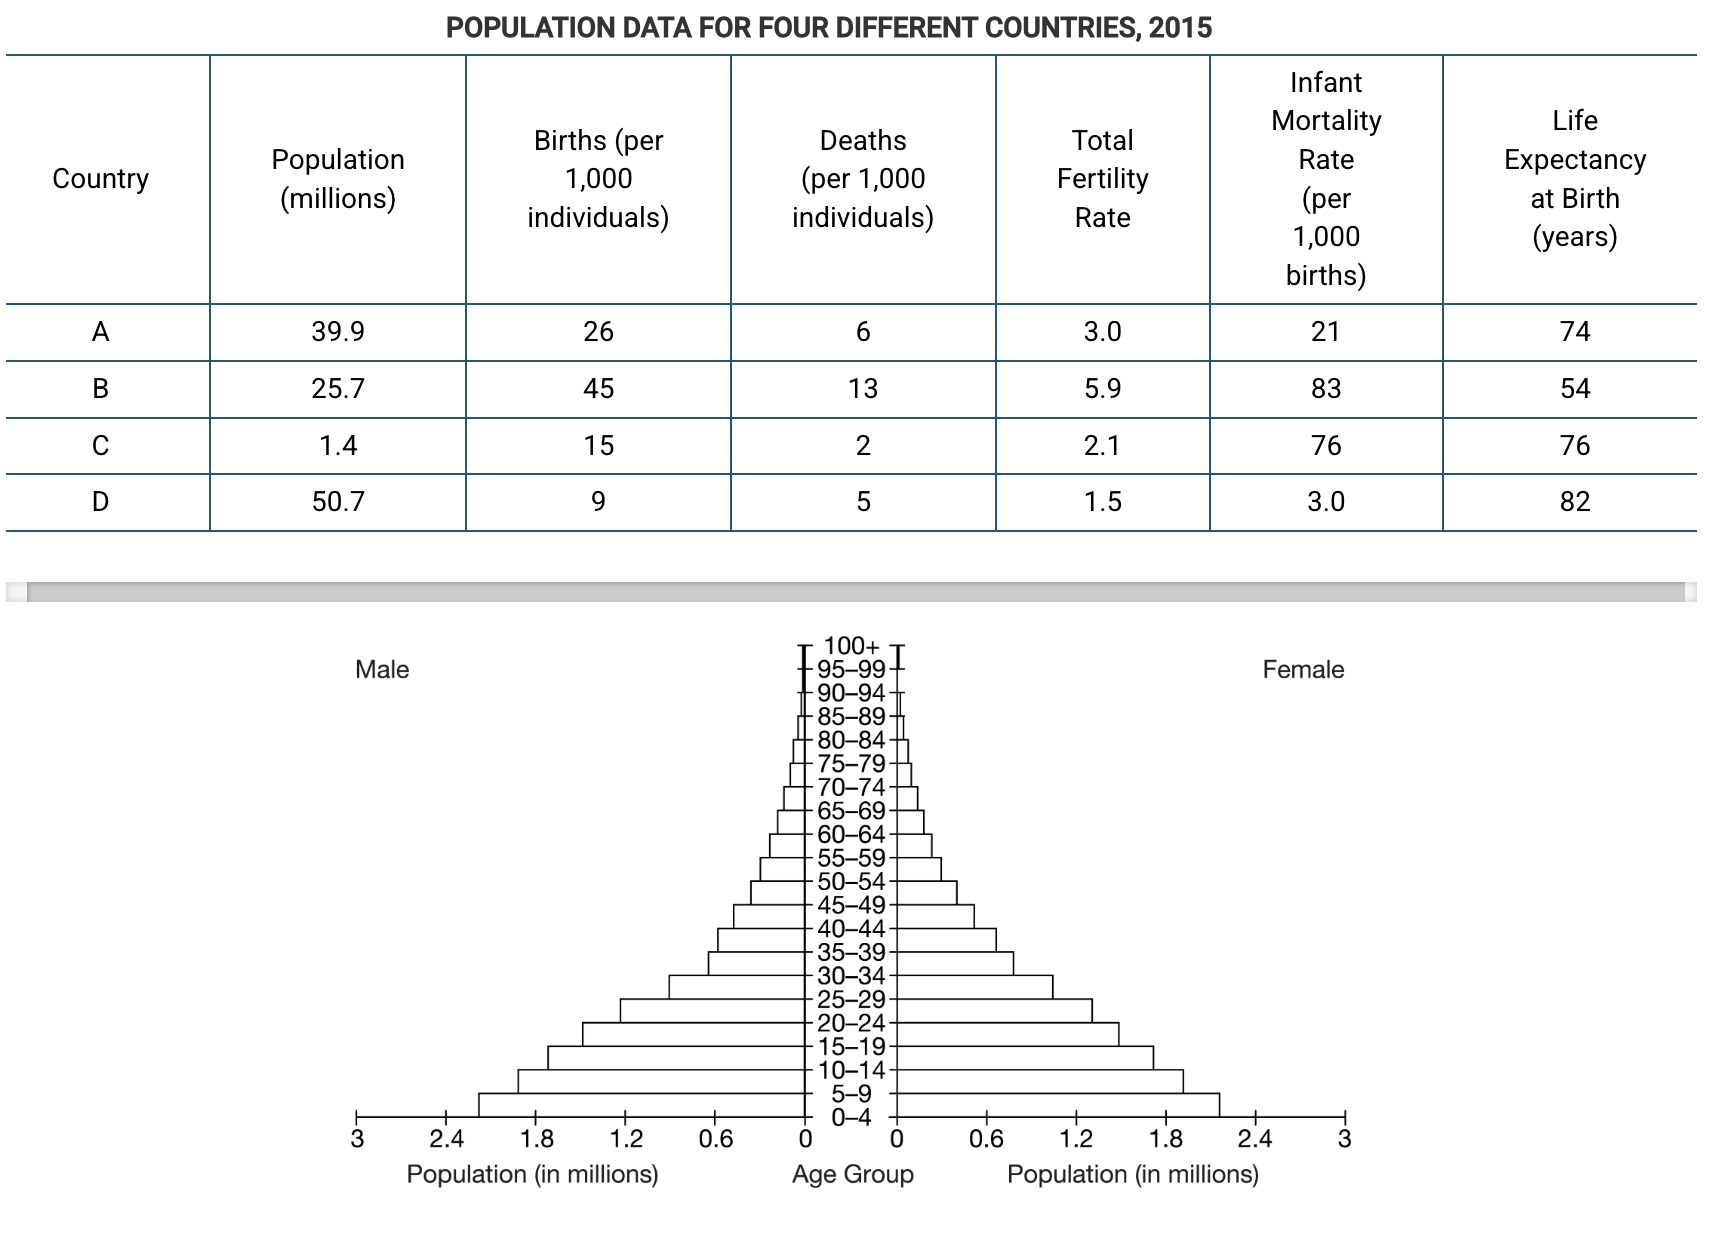
Which of the following countries is most likely represented in the age structure diagram shown above?
A
Country A
B
Country B
C
Country C
D
Country D
Country B
The supply of Earth’s fresh water is fixed and is being depleted at a rapid rate. Which of the following best describes the effects of a limited freshwater supply on human populations?
A
Disease transmission will decrease as access to water decreases, leading to improved public health.
B
Conservation measures will increase per capita water consumption, leading to an improved global economy.
C
Desalinization facilities will be used to process water stored in glaciers and snow packs, leading to new sources of drinking water.
D
World food production will decrease, leading to increased famine.
World food production will decrease, leading to increased famine.
Which of the following best describes the change in the carrying capacity of the human population if growth is limited by conditions set forth by the Malthusian theory?
A
The carrying capacity will increase, and the human population size will grow exponentially.
B
The carrying capacity will remain constant, and the human population size will stabilize.
C
The carrying capacity will remain constant, and the human population size will experience an overshoot.
D
The carrying capacity will decrease, and the human population size will experience a dieback.
The carrying capacity will decrease, and the human population size will experience a dieback.
In 1950, a country had a total fertility rate of 5.9. In 2010, the total fertility rate of the country was 2.3. Which of the following is most likely the reason for the change in total fertility rate?
A
Women had increased educational opportunities and had children later in life.
B
Families had limited access to family planning and contraceptives.
C
There were lower infant mortality rates as a result of increased access to healthcare.
D
The country shifted to a more agricultural-based economy and the need for child labor decreased.
Women had increased educational opportunities and had children later in life.
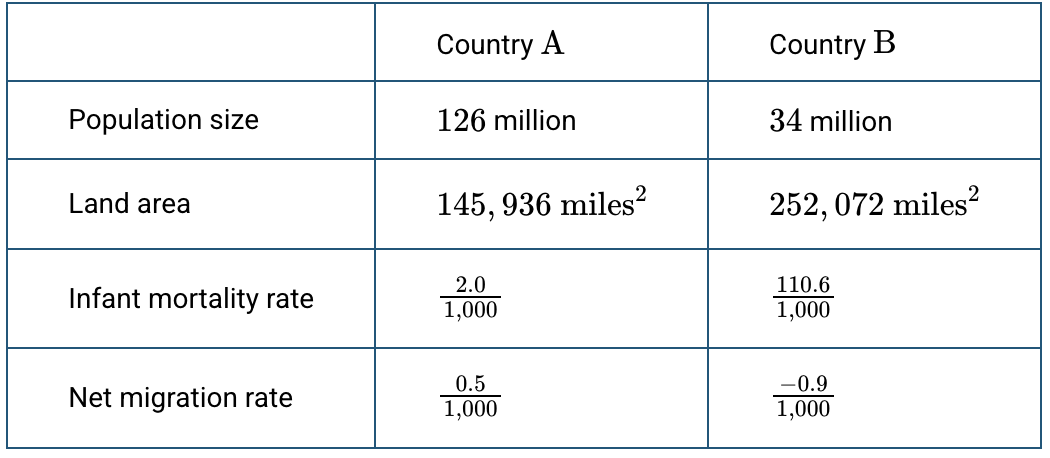
Which of the following characteristics in the table best supports the claim that Country A is a more developed country and that Country B is a less developed country?
A
Population size
B
Land area
C
Infant mortality rate
D
Net migration rate
Infant mortality rate
A country has a birth rate of 35/1000 individuals and a death rate of 13/1000 individuals. The death rate was 37/1000 individuals in 1950, 28/1000 individuals in 1970, and 21/1000 individuals in 1990. Which of the following statements best explains why the country has a declining death rate?
A
The country is in stage 1 of the demographic transition, and infant mortality is high because of poor health services and high levels of poverty.
B
The country is in stage 2 of the demographic transition, and life expectancy has increased because of improvements in public health, sanitation, and access to food.
C
The country is in stage 3 of the demographic transition, and more women are entering the workforce and shifting to having children later in life.
D
The country is in stage 4 of the demographic transition, and the population growth rate is declining.
The country is in stage 2 of the demographic transition, and life expectancy has increased because of improvements in public health, sanitation, and access to food.
In a certain country, the birth rate is high, the death rate is high, and there are many children that are part of the workforce. The country is most likely in which of the following stages of the demographic transition?
A
Stage 1
B
Stage 2
C
Stage 3
D
Stage 4
Stage 1

At which of the following sites is an earthquake most likely to occur as two plates slide sideways past each other?
A
A
B
B
C
C
D
D
C
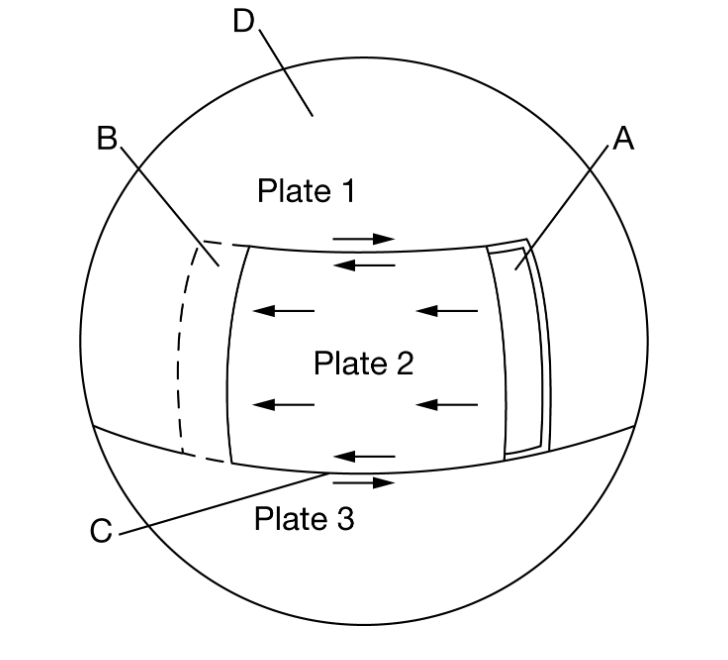
At which of the following sites would activity result in volcanoes, island arcs, and mountains?
A
A
B
B
C
C
D
D
B

At which of the following sites does seafloor spreading result in rifts and possible volcanoes?
A
A
B
B
C
C
D
D
A
Students want to determine the impact of soil erosion from the development of new housing. They plan to measure the density of a species of algae growing along the bottom of a river that flows through their town. The town is built in a heavily forested area, but a large area of trees along the river was recently clear-cut to allow for the construction of a new housing development, which has caused exposed soil to wash into the river. The river flows north to south through the town and is still forested both up- and downstream of the town.
Which of the following would be the best control sample for the study?
A
A sample of water collected just downstream of the southern forest
B
A sample of water collected just downstream of the housing development
C
A sample of water collected just downstream of the northern forest
D
A sample of distilled water
A sample of water collected just downstream of the northern forest
Students want to determine the impact of soil erosion from the development of new housing. They plan to measure the density of a species of algae growing along the bottom of a river that flows through their town. The town is built in a heavily forested area, but a large area of trees along the river was recently clear-cut to allow for the construction of a new housing development, which has caused exposed soil to wash into the river. The river flows north to south through the town and is still forested both up- and downstream of the town.
Which of the following is the dependent variable in the study?
A
The tract of land that was clear-cut for the housing development
B
A tract of land in a heavily forested area outside of town
C
The density of a species of algae growing along the bottom of the river
D
The flow rate of the river from north to south
The density of a species of algae growing along the bottom of the river
Students want to determine the impact of soil erosion from the development of new housing. They plan to measure the density of a species of algae growing along the bottom of a river that flows through their town. The town is built in a heavily forested area, but a large area of trees along the river was recently clear-cut to allow for the construction of a new housing development, which has caused exposed soil to wash into the river. The river flows north to south through the town and is still forested both up- and downstream of the town.
Which of the following explains the variable that would be the best for students to measure to determine the direct impact of soil erosion caused by the construction project on the river?
A
Water temperature, because a decrease in shading in the area would indicate an increase in soil erosion.
B
Nutrient levels, because a decrease in nitrogen and phosphorus would indicate an increase in soil erosion.
C
The pH level, because an increase in pH would indicate an increase in soil erosion.
D
Turbidity, because a decrease in water clarity would indicate an increase in soil erosion.
Turbidity, because a decrease in water clarity would indicate an increase in soil erosion.

Which of the following best describes the independent variable in this research design?
A
The sample of material chosen as the potential container material is the variable being tested, so it is the independent variable.
B
The flow time, which is related to the porosity of each sample, is the variable that is measured, so it is the independent variable.
C
The total volume of water recovered is most likely to be affected by human error and is the variable with the largest range of values, so it is the independent variable.
D
The permeability of each soil sample, which is determined by dividing the total volume of water recovered by the flow time, is the variable that is calculated, so it is the independent variable.
The sample of material chosen as the potential container material is the variable being tested, so it is the independent variable.
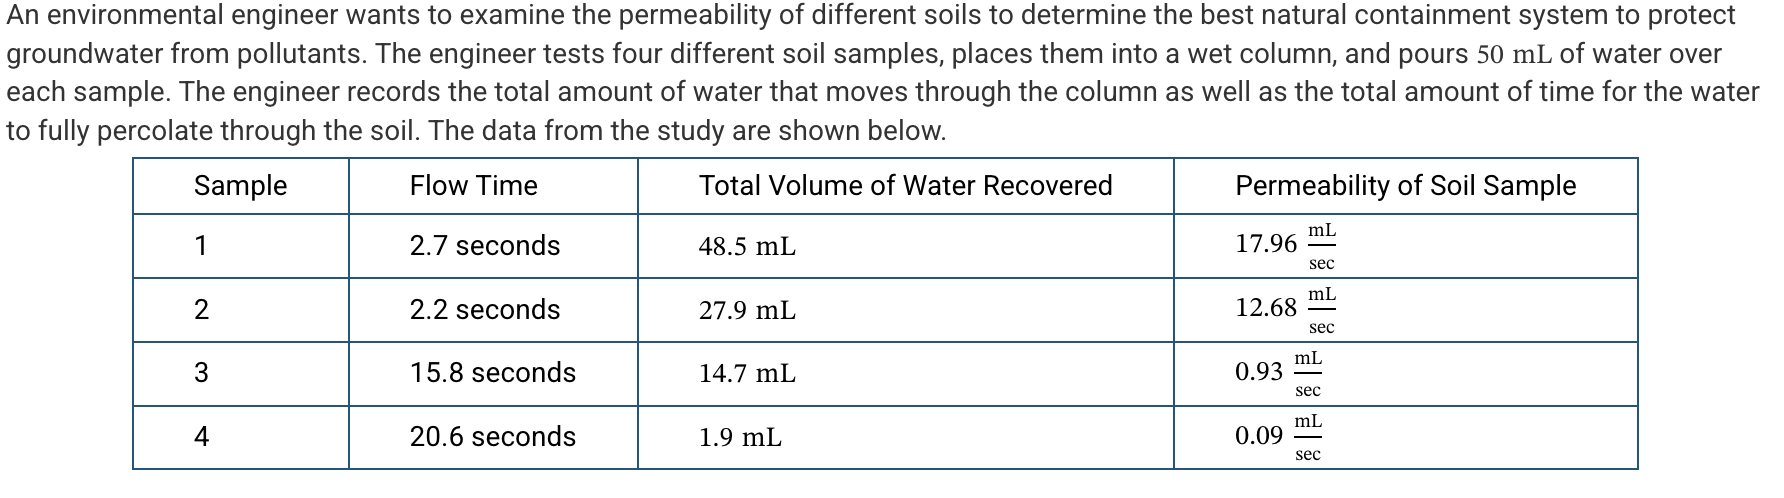
Which of the following best describes why the engineer chose to calculate the permeability of the soil sample in the experimental design in order to evaluate a natural containment system to protect groundwater?
A
Soils that have high permeability would best help protect groundwater because they would allow for faster recharge of the aquifer.
B
Soils that have high permeability would best help protect groundwater because they have higher rates of nutrient and pesticide leaching.
C
Soils that have low permeability would best help protect groundwater because the soil traps pollutants so that chemical and biological breakdown can occur.
D
Soils that have low permeability would best help protect groundwater because the large pore spaces would provide space for pollutants to attach and would have rapid percolation of water.
Soils that have low permeability would best help protect groundwater because the soil traps pollutants so that chemical and biological breakdown can occur.
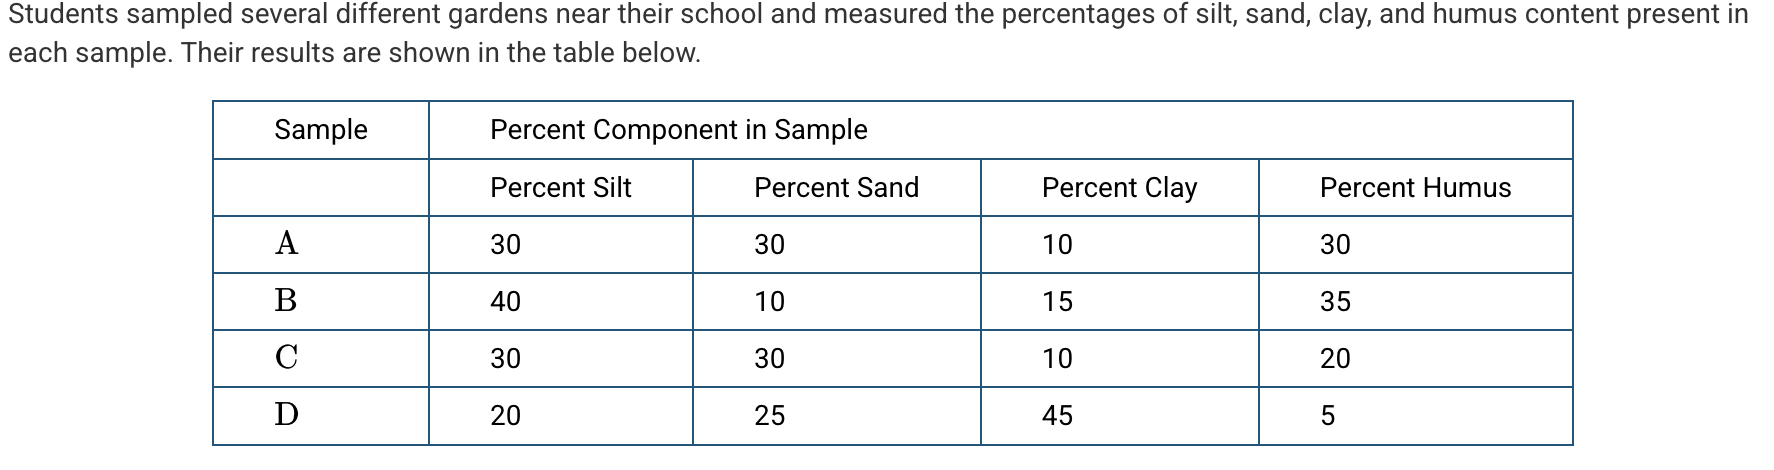
Based on the data in the table above, which of the following samples would be the most prone to becoming waterlogged?
A
Sample A
B
Sample B
C
Sample C
D
Sample D
Sample D
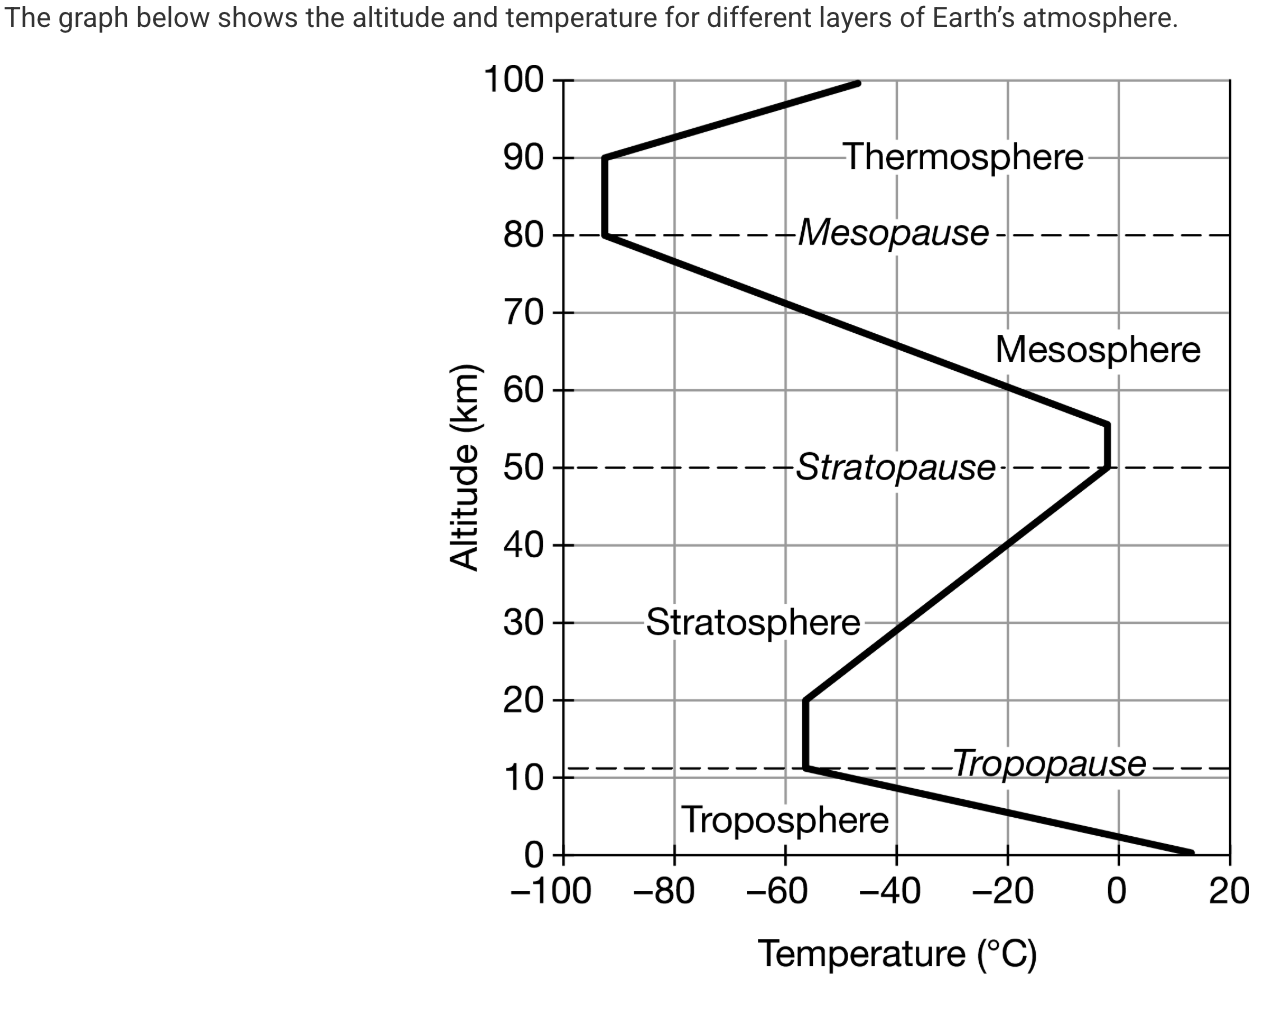
Based on the diagram, which of the following identifies a characteristic of the atmosphere between the stratopause and the tropopause?
A
Cloud formation occurs in the stratosphere.
B
The warmest air is found in the mesosphere.
C
The ozone layer is in the stratosphere.
D
The troposphere is the closest layer to the sun.
The ozone layer is in the stratosphere.
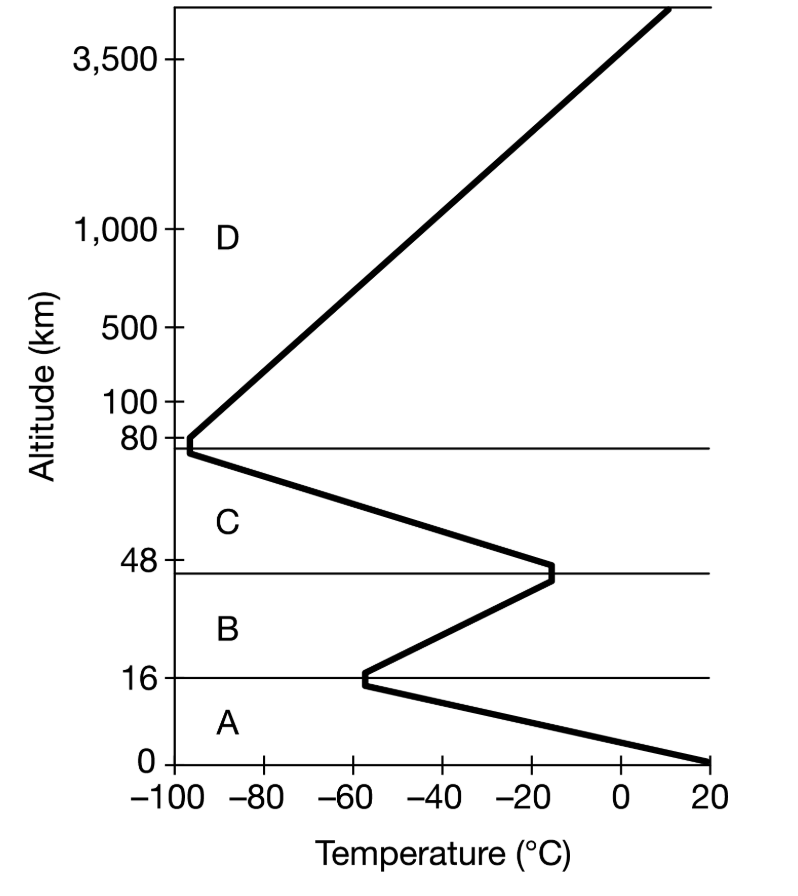
Which of the following correctly characterizes one of Earth’s atmospheric layers?
A
Layer A is the stratosphere, where meteors are found.
B
Layer B is the troposphere, where weather occurs.
C
Layer C is the stratosphere, where the ozone layer is found.
D
Layer D is the thermosphere, where auroras are found.
Layer D is the thermosphere, where auroras are found.
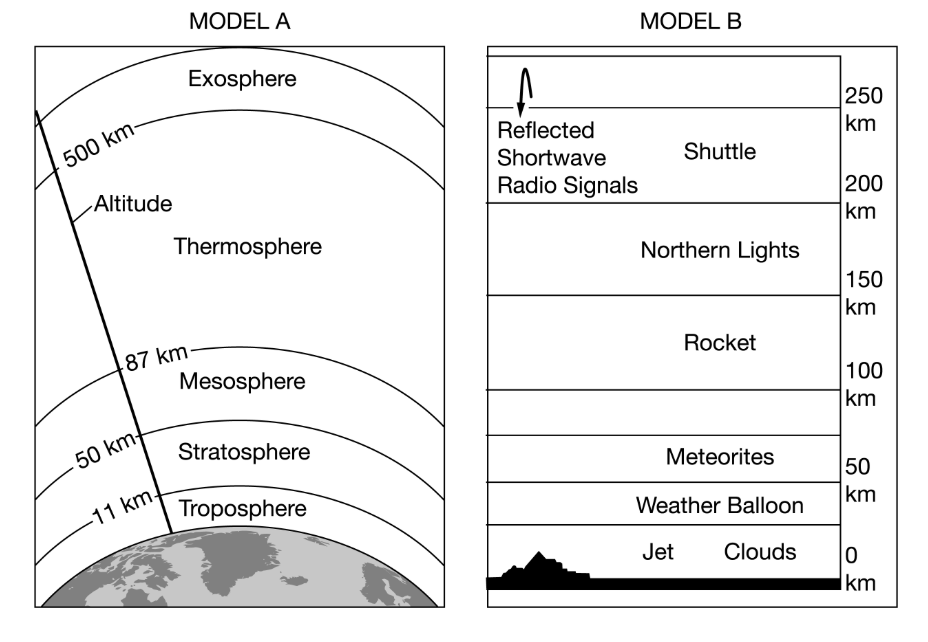
Based on the data in the diagrams, in which layer of the atmosphere would short wave radio signals be reflected?
A
Stratosphere
B
Mesosphere
C
Thermosphere
D
Exosphere
Thermosphere

Which of the following is a biome found at 30 N and 30 S as seen in the diagram?
A
Rain forests
B
Tundras
C
Coniferous forests
D
Deserts
Deserts
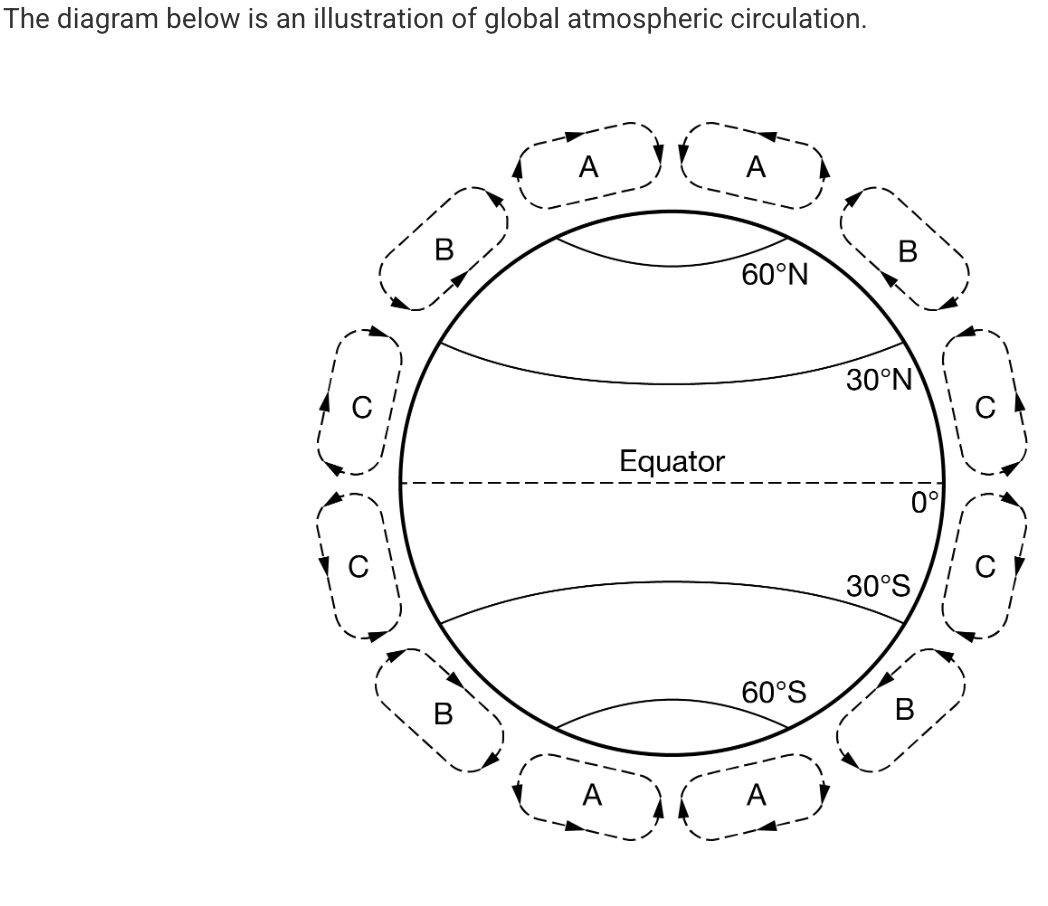
Which of the following is the source of energy driving the circulation pattern labeled C in the diagram?
A
The Coriolis effect
B
Solar radiation
C
Earth’s magnetic field
D
The spinning core of Earth
Solar radiation

Which of the following causes the air to rise high into the atmosphere in the areas labeled A, B, and C on the diagram?
A
El Niño circulation patterns
B
The rotation of Earth shifting the direction of the air upward
C
Warm, moist air that is less dense than the surrounding air
D
Rain shadows over mountain ridges
Warm, moist air that is less dense than the surrounding air
Hoover Dam is the largest dam in the United States, built on the Colorado River to supply hydroelectric power and flood control. Which of the following best describes a downstream environmental effect of Hoover Dam on the Colorado River watershed?
A
The supply of inexpensive electricity led to population growth and industrial development in cities such as Phoenix and Los Angeles.
B
The Lake Mead Recreation Area, formed by the reservoir behind Hoover Dam, is a popular tourist attraction for fishing, swimming, and boating.
C
The drainage basin of the Colorado River includes 246,000 square miles and serves as a source of drinking water for over 40 million people.
D
The damming of the Colorado River led to a change in stream flow, preventing river water and sediments from reaching the delta area.
The damming of the Colorado River led to a change in stream flow, preventing river water and sediments from reaching the delta area.
Which of the following best describes why understanding a watershed and its boundaries is important in designing housing developments along a river?
A
The water contained in a watershed is more likely to become polluted if the soil has high permeability, so it is important to locate all point sources to reduce contamination.
B
Watersheds provide habitats for hundreds of marine species, so it is important to protect their feeding and nesting sites when designing housing for humans.
C
Watersheds provide space for cultivating land to produce food and other products, so it is important to avoid locating a housing development on the most fertile land.
D
Surface water and stormwater runoff will drain downstream within the watershed boundaries, so it is important to understand the flow of water through the watershed.
Surface water and stormwater runoff will drain downstream within the watershed boundaries, so it is important to understand the flow of water through the watershed.
Which of the following should be included in a watershed map to best determine the non–point source of a pollutant, such as fertilizer, found in a river?
A
The total volume of groundwater in the aquifer
B
The total area and the average yearly precipitation of the watershed
C
The land use upstream of the river and water quality indicators in streams that run downstream into the river
D
The total volume of surface water of the river and the land use downstream of the river
The land use upstream of the river and water quality indicators in streams that run downstream into the river
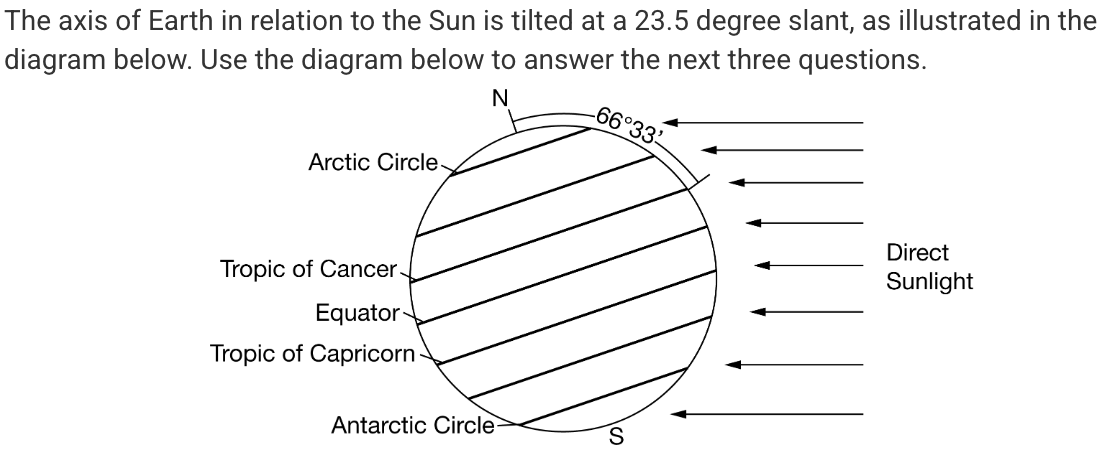
If the diagram illustrates Earth’s relative position on December 21 of a given year, which of the following statements would be correct?
A
The Tropic of Cancer has a shorter day and higher solar radiation intensity because there is an inverse relationship between length of day and radiation intensity.
B
The Tropic of Capricorn has a shorter day and higher solar radiation intensity because there is a direct relationship between length of day and radiation intensity.
C
The equator has twelve hours of daylight and the greatest solar radiation intensity because there is no direct relationship between day length and radiation intensity.
D
The Tropic of Cancer has a shorter day and lower solar radiation intensity because there is a direct relationship between day length and radiation intensity.
The Tropic of Cancer has a shorter day and lower solar radiation intensity because there is a direct relationship between day length and radiation intensity.

Which of the following areas receives the most intense solar radiation at the time of year shown in the diagram, and why?
A
The Antarctic Circle, because it is closest to the Sun.
B
The Tropic of Capricorn, because this latitude is nearly horizontal to incoming solar radiation.
C
The equator, because it is the hottest region and therefore receives the most intense solar radiation.
D
The Tropic of Cancer, because solar radiation spreads out over a wider area at this latitude.
The Tropic of Capricorn, because this latitude is nearly horizontal to incoming solar radiation.

Which of the following correctly describes the season and length of day at the Tropic of Cancer at the time of year shown in the diagram?
A
The Northern Hemisphere is tilted away from the Sun so it is winter at the Tropic of Cancer and daylight is less than twelve hours per day.
B
The Northern Hemisphere is tilted away from the Sun, so it is winter at the Tropic of Cancer and daylight is approximately twelve hours per day.
C
The Southern Hemisphere is tilted toward the Sun, so it is summer at the Tropic of Cancer and daylight is greater than twelve hours per day.
D
The Southern Hemisphere is tilted away from the Sun so it is summer at the Tropic of Cancer and daylight is approximately twelve hours per day.
The Northern Hemisphere is tilted away from the Sun so it is winter at the Tropic of Cancer and daylight is less than twelve hours per day.

In the desert regions of the southwestern United States, daily high and low temperatures will frequently fluctuate by 40 F or more. Which statement below best explains the large variation in temperature?
A
There are no bordering oceans or large bodies of water to provide a stabilizing humidity to the air.
B
The nearby Rocky Mountain range provides a rain shadow effect in the evenings to the west.
C
The flat, light-colored sand formations typical in deserts reflect light from the Sun during the day, but not at night.
D
Desert plants have long tap roots that pull water from deep in the soil, cooling the desert at night.
There are no bordering oceans or large bodies of water to provide a stabilizing humidity to the air.
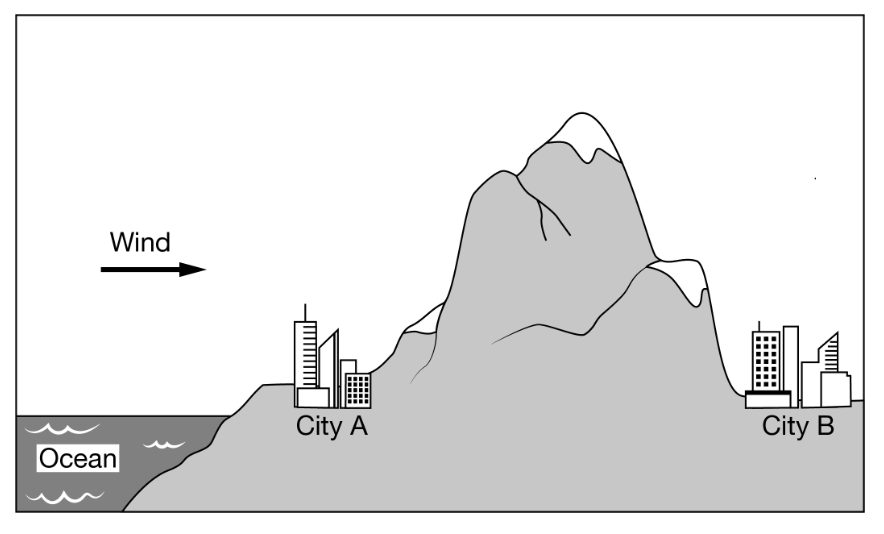
Which of the following best explains why City B regularly receives less precipitation than City A?
A
As air rises up the side of the mountain near City B, the temperature and the relative humidity increase, causing increased precipitation on the other side of the mountain over City A.
B
Air that is forced upward on the side of the mountain near City B leads to the formation of stratospheric clouds.
C
The urban heat island from City B causes a warmer climate that leads to reduced cloud formation.
D
The rain shadow effect causes City B to be drier because the mountain blocks precipitation from reaching the city.
The rain shadow effect causes City B to be drier because the mountain blocks precipitation from reaching the city.
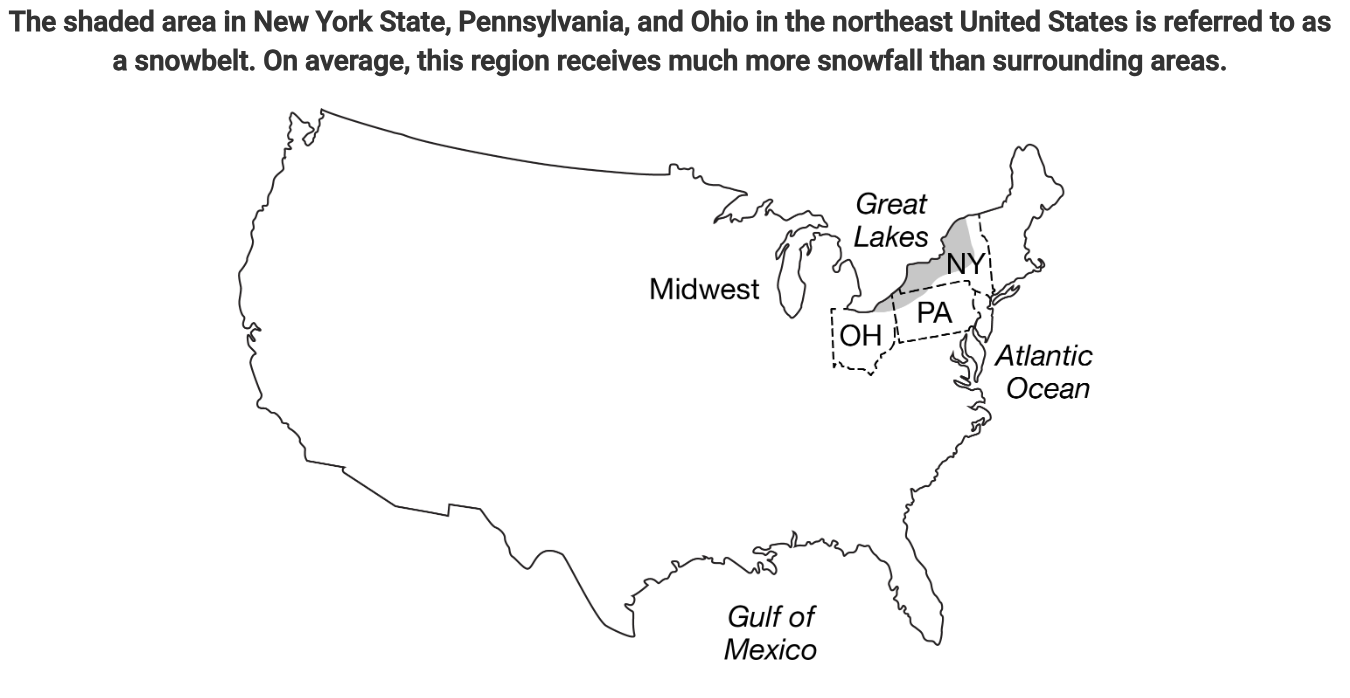
Which of the following best explains why the shaded area receives more snowfall than the other parts of New York, Pennsylvania, and Ohio?
A
Moisture-laden storms from the Gulf of Mexico release precipitation here because of the cool temperatures in the region.
B
Air pollutants from power plants and industrial emissions in the Midwest increase snowfall rates.
C
Moisture picked up from the warmer water in the Great Lakes is deposited as snow downwind.
D
Sea spray from the Atlantic Ocean is carried westward by prevailing winds.
Moisture picked up from the warmer water in the Great Lakes is deposited as snow downwind.
El Niño and La Niña are natural phenomena associated with changing water temperatures in the Pacific Ocean. The occurrence of these events can result in changes in global weather and ocean circulation patterns.
Which of the following changes in eastern Pacific Ocean food webs is typically associated with La Niña events?
A
Decreased populations of squid
B
Decreased populations of anchovies
C
Increased phytoplankton concentrations
D
Increased famine among sea lions and seals
Increased phytoplankton concentrations
El Niño and La Niña are natural phenomena associated with changing water temperatures in the Pacific Ocean. The occurrence of these events can result in changes in global weather and ocean circulation patterns.
Which of the following is a positive effect likely to result from an El Niño event?
A
Increased droughts in Central and South America
B
Reduced chance of winter floods in California and the Pacific Northwest
C
Fewer hurricanes forming in the Central Atlantic basin
D
Fewer heat waves in Australia
Fewer hurricanes forming in the Central Atlantic basin
Which of the following is the most likely effect of a strong El Niño event on the weather patterns in the United States?
A
Wetter weather and cooler temperatures in the Pacific Northwest and warmer temperatures with more snow in the northeastern states
B
Drier weather in the western states and wetter weather in the eastern states
C
Wetter weather and cooler than average temperatures in the southeastern states and warmer temperatures in the Pacific Northwest
D
Overall warmer temperatures and drier conditions throughout the entire United States
Wetter weather and cooler than average temperatures in the southeastern states and warmer temperatures in the Pacific Northwest

Which of the following major storage reservoirs of carbon, stored in the form of carbon dioxide, is not represented in this diagram?
A
Algae
B
Soil bacteria
C
The Moon
D
The ocean
The ocean

Based on the diagram above, which of the following processes reduces the amount of carbon dioxide in the atmosphere?
A
Photosynthesis
B
Cellular respiration
C
Decomposition
D
Burning of fossil fuels
Photosynthesis
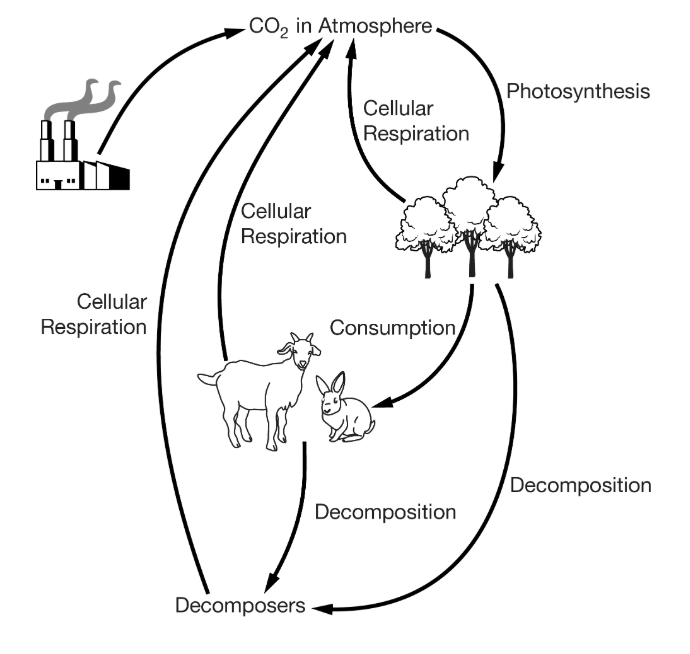
Based on the diagram above, which process most directly results in the storage of carbon as coal and oil over millions of years?
A
Photosynthesis
B
Cellular respiration
C
Decomposition
D
Burning of fossil fuels
Decomposition
Which of the following would be categorized as a cultural ecosystem service of forests?
A
Recreation and scenic areas for tourism
B
Timber and landscape materials
C
Mushroom and plant harvests
D
Soil stabilization and air purification
Recreation and scenic areas for tourism
Which of the following would most likely result from the deforestation of large areas of tropical rain forests caused by slash-and-burn agriculture?
A
Increased ozone thinning because of the release of CFCs
B
Decreased acid rain because of the sequestration of SO²
C
Increased global temperature because of the release of CO²
D
Deceased evaporation because of the loss of the tree canopy
Increased global temperature because of the release of CO²
Which of the following correctly describes the disruption of an ecosystem service by an anthropogenic activity?
A
Provisioning services are disrupted by increased combustion of fossil fuels, which leads to an increase in air pollution.
B
Regulating services are disrupted by flash flooding from a hurricane, which decreases available food resources.
C
Supporting services are disrupted by an earthquake that causes habitat destruction, which displaces plants and animals.
D
Cultural services are disrupted by a tornado that causes the loss of acres of forest, which reduces the amount of harvestable timber.
Provisioning services are disrupted by increased combustion of fossil fuels, which leads to an increase in air pollution.
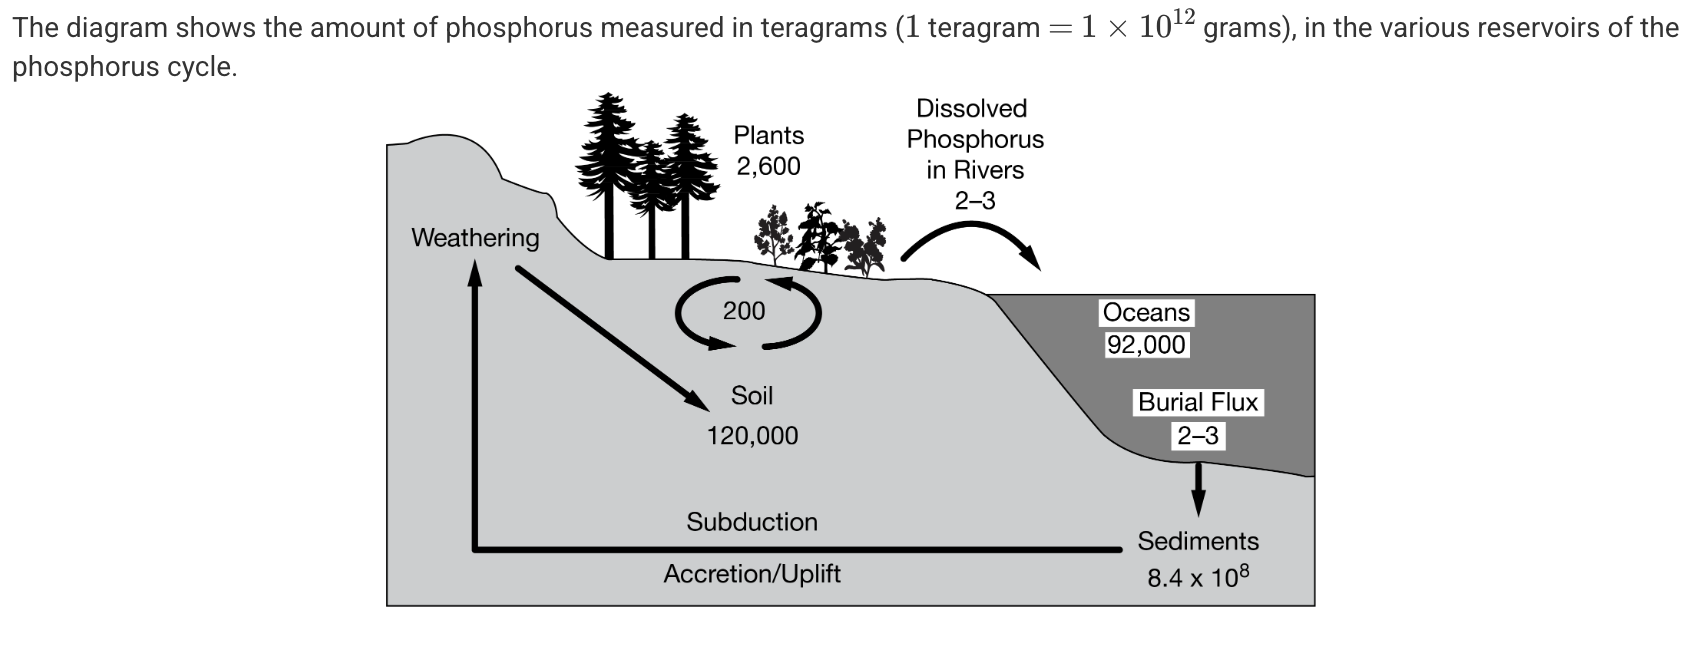
Which of the following is the best explanation for why there is such a small amount of phosphorus that moves into aquatic systems?
A
Phosphorus is highly stable in the atmosphere and remains there for long periods of time.
B
The amount of phosphorus in the cycle has been greatly reduced because of the use of catalytic converters in automobiles.
C
There is not a gaseous phase of the phosphorus cycle, and therefore the movement of phosphorus into oceanic reservoirs is very slow.
D
The phosphorus cycle occurs so rapidly that it does not exist in any one reservoir for a very long time.
There is not a gaseous phase of the phosphorus cycle, and therefore the movement of phosphorus into oceanic reservoirs is very slow.
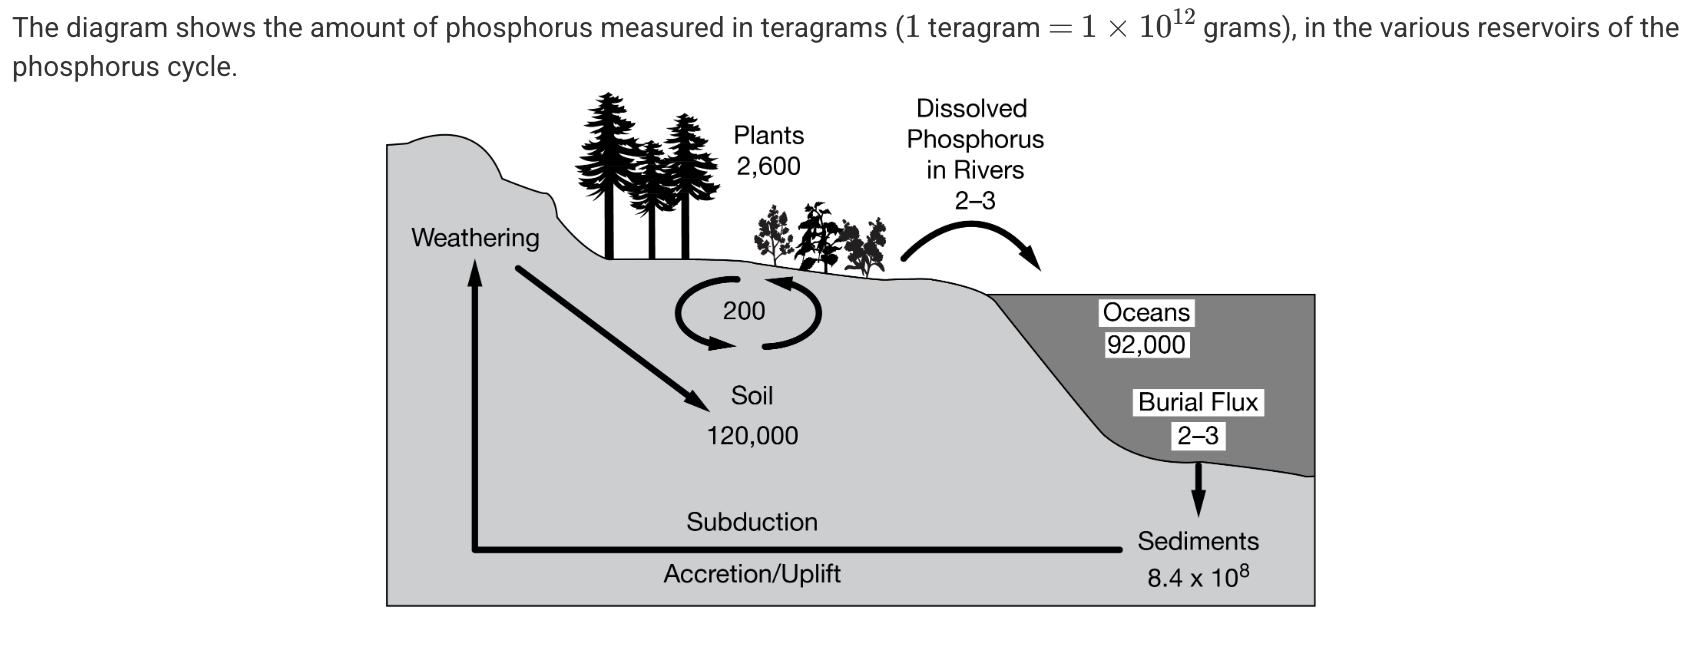
According to the diagram, the movement of phosphorus between biological organisms and soil is in a steady state in an undisturbed system. Which of the following best explains the reason for this steady movement?
A
Phosphorus is taken up by plants during photosynthesis to create carbohydrates.
B
A decrease in buffer zones prevents phosphorus runoff in waterways.
C
There is a rapid influx of phosphorus from the weathering of rocks.
D
Readily available organic phosphorus in the soil is assimilated by plants.
Readily available organic phosphorus in the soil is assimilated by plants.

Based on the diagram, which of the following reservoirs contains the most phosphorus?
A
Plants
B
Sediments
C
Soil
D
Oceans
Sediments
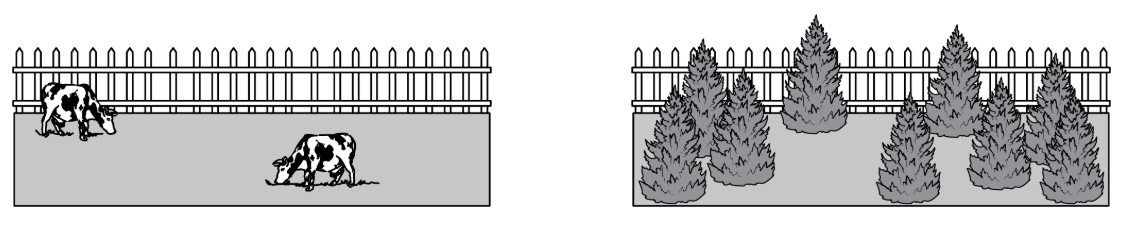
The diagrams above show an area that was once a pasture that has since undergone changes to the vegetation over time. Which of the following changes in the hydrologic cycle is most likely to occur as a result of the change in vegetation in the area?
A
Increased infiltration
B
Increased runoff
C
Decreased transpiration
D
Decreased precipitation
Increased infiltration

Which letter correctly identifies the part of the hydrologic cycle that is most directly affected by impervious building materials, such as concrete and asphalt?
A
A
B
B
C
C
D
D
D
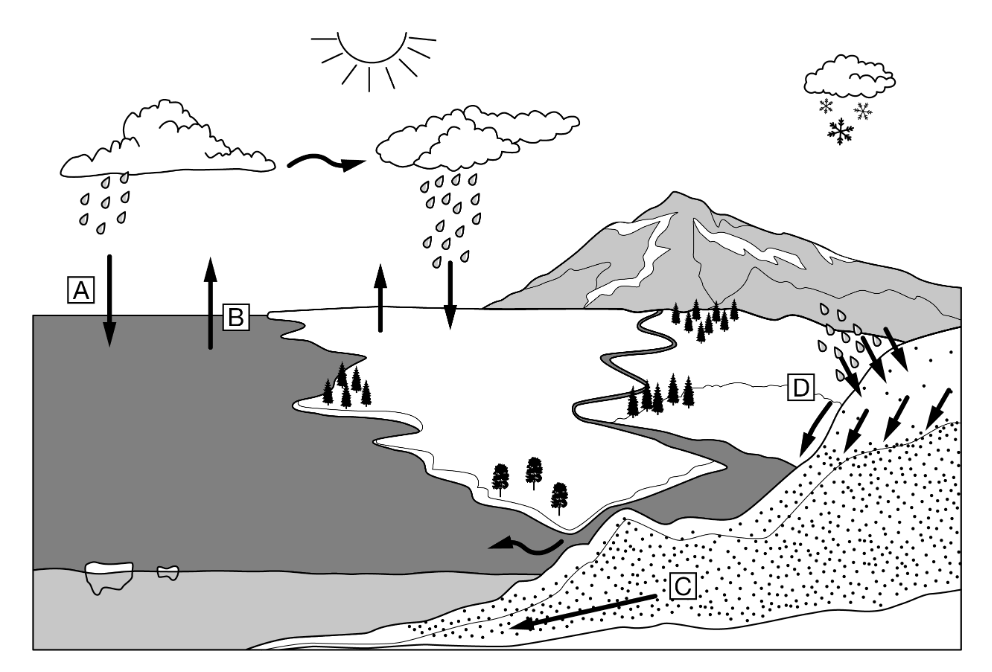
Which letter correctly identifies a process of the hydrologic cycle in which the phase of water is changed from a liquid to a gas?
A
A
B
B
C
C
D
D
B
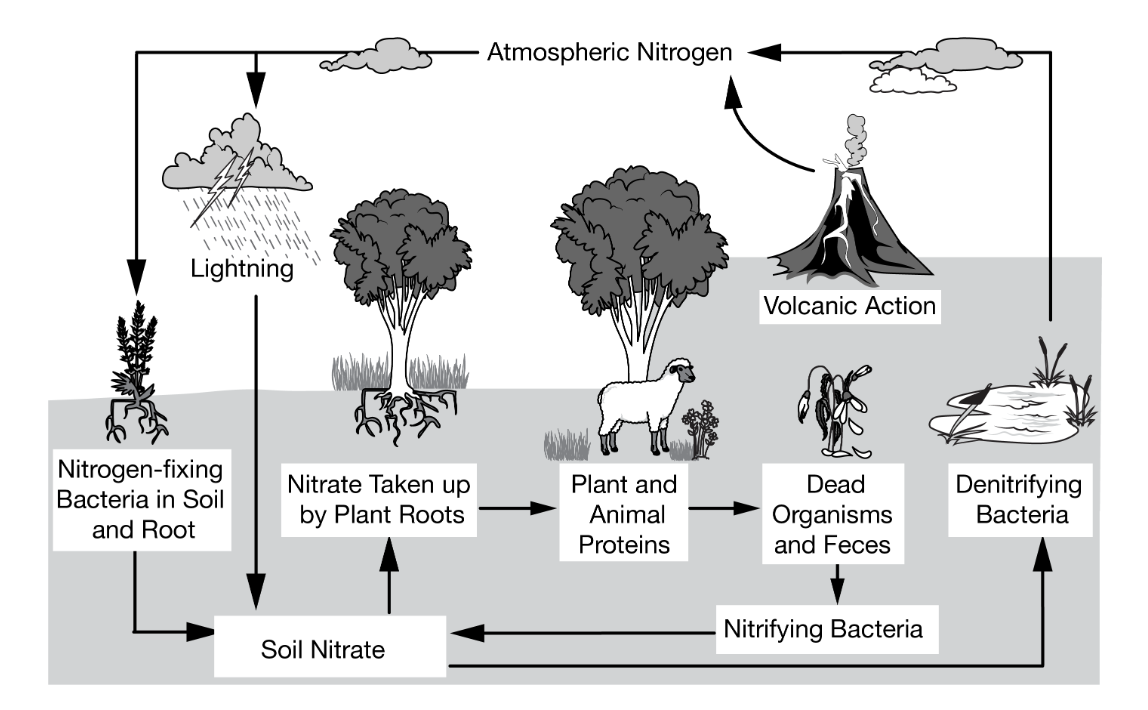
Which of the following pathways indicate how nitrogen is added to the largest nitrogen reservoir?
A
Nitrifying bacteria and lightning
B
Decomposing plant and animal material
C
Denitrifying bacteria and volcanic activity
D
Nitrates taken up by plant roots
Denitrifying bacteria and volcanic activity
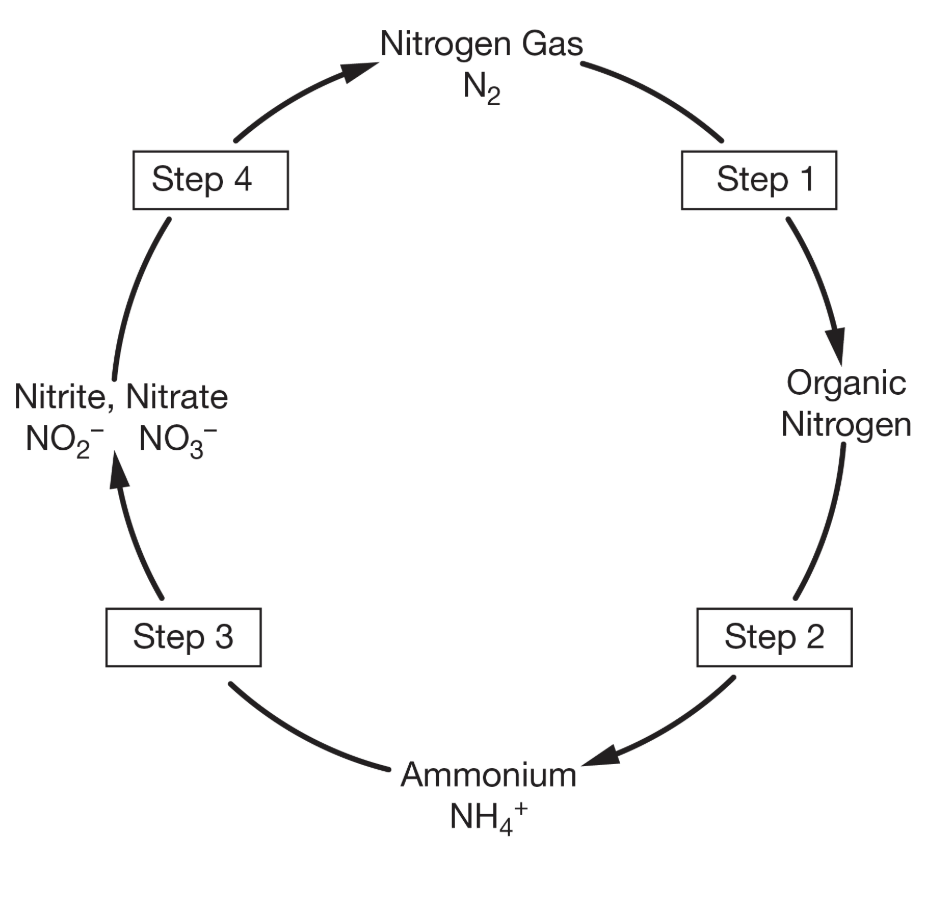
In the nitrogen cycle illustrated above, nitrification occurs in which of the following steps?
A
Step 1
B
Step 2
C
Step 3
D
Step 4
Step 3
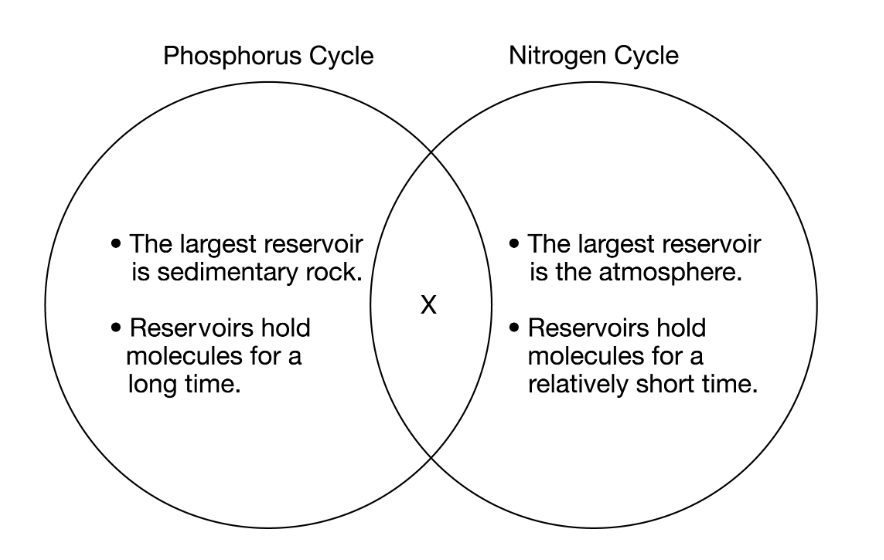
Which of the following would best describe X in the diagram above?
A
Bacteria play an important role in the conversion of compounds from the atmospheric gas to the form of the compound taken up by plants.
B
Phosphorus and nitrogen are both required for plant growth.
C
Volcanic eruptions are a major source of non-anthropogenic inputs.
D
Processes include weathering and erosion.
Phosphorus and nitrogen are both required for plant growth.
Five different species of warblers, seed-eating birds, live in the same species of conifer trees. All of the birds migrate to coniferous forests during the summer, and different species reside in different areas in the same tree. They feed on the seeds of the conifer trees, but the different species do not mate with each other.
Which of the following best explains why the different warbler species can all have habitats in the same conifer trees?
A
Not all the warblers are residents in the forest at the same time of the year because of different migration patterns.
B
Physiological differences in beak structure allow the warblers to consume different species of seeds through symbiotic relationships.
C
Resource partitioning of the seeds reduces competition, and the five different species can live in the same tree.
D
Niche overlap occurs between the five different species, and living in the same tree increases competition for seeds.
Resource partitioning of the seeds reduces competition, and the five different species can live in the same tree.
In a fish species, the number of eggs that hatch and survive for one year varies depending on the number of eggs that were produced. As the number of eggs produced increases past a threshold number, the survival rate of the offspring decreases. Which of the following statements best explains why only a limited number of offspring can survive in a fish population?
A
Resource partitioning allows similar species to coexist in the same ecological community.
B
The number of fish surviving after one year is proportional to the number of eggs produced.
C
The chance of survival decreases when there is intraspecific competition for resources among surviving yearlings.
D
More yearling fish survive beyond one year when there is an abundance of prey species present.
The chance of survival decreases when there is intraspecific competition for resources among surviving yearlings.
Which of the following best describes a symbiotic relationship?
A
Striped bass and bluefish eat the same variety of mackerel.
B
Intestinal bacteria inhabit the gut of humans.
C
Mountain lions feed on white-tailed deer.
D
Marsupial animals carry their young in a pouch.
Intestinal bacteria inhabit the gut of humans.
Which of the following best describes the movement of energy in an ecosystem?
A
Energy is constantly recycled by decomposers for use by producers.
B
Energy is harnessed by producers, and available energy decreases with each trophic level transfer.
C
Energy is absorbed by plants through water and soil and then moves up the food chain through consumers.
D
Energy is magnified as it moves up the trophic levels, and tertiary consumers store the most energy in a food web.
Energy is harnessed by producers, and available energy decreases with each trophic level transfer.
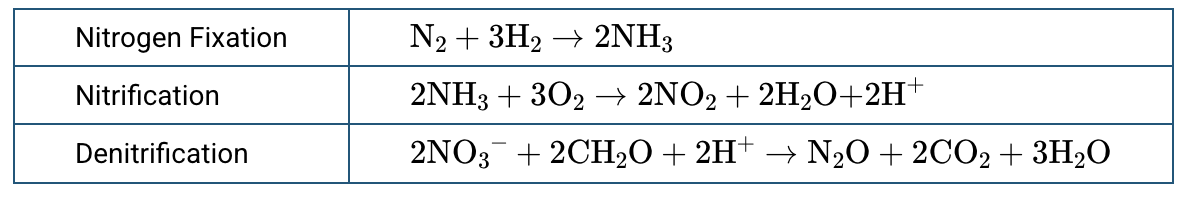
The table above shows the balanced chemical equations that represent three processes that are part of the nitrogen cycle. Which of the following is exemplified by the equations above?
A
Approximately of energy is transferred from one trophic level to the next.
B
In a food web, energy flows and matter is cycled.
C
Each biogeochemical cycle demonstrates the conservation of matter.
D
The major reserve for nitrogen is in the atmosphere.
Each biogeochemical cycle demonstrates the conservation of matter.
Which of the following best explains why terrestrial trophic pyramids usually do not have levels higher than tertiary consumers?
A
Tertiary consumers are the largest organisms in an ecosystem and require the most space to survive.
B
Plants can only perform photosynthesis during the day, so tertiary consumers cannot get enough energy from consuming plants.
C
A large proportion of energy is lost as heat as it is transferred up the pyramid, so there is not enough energy available to support another level.
D
Tertiary consumers are often indicator species and are the first to be affected by environmental disturbances.
A large proportion of energy is lost as heat as it is transferred up the pyramid, so there is not enough energy available to support another level.

Based on the data in the table, which of the following pairs of organisms has two ecological relationships, both competition and predation?
A
Spiders and shrews
B
Hawks and snakes
C
Spiders and snakes
D
Spiders and grasshoppers
Hawks and snakes
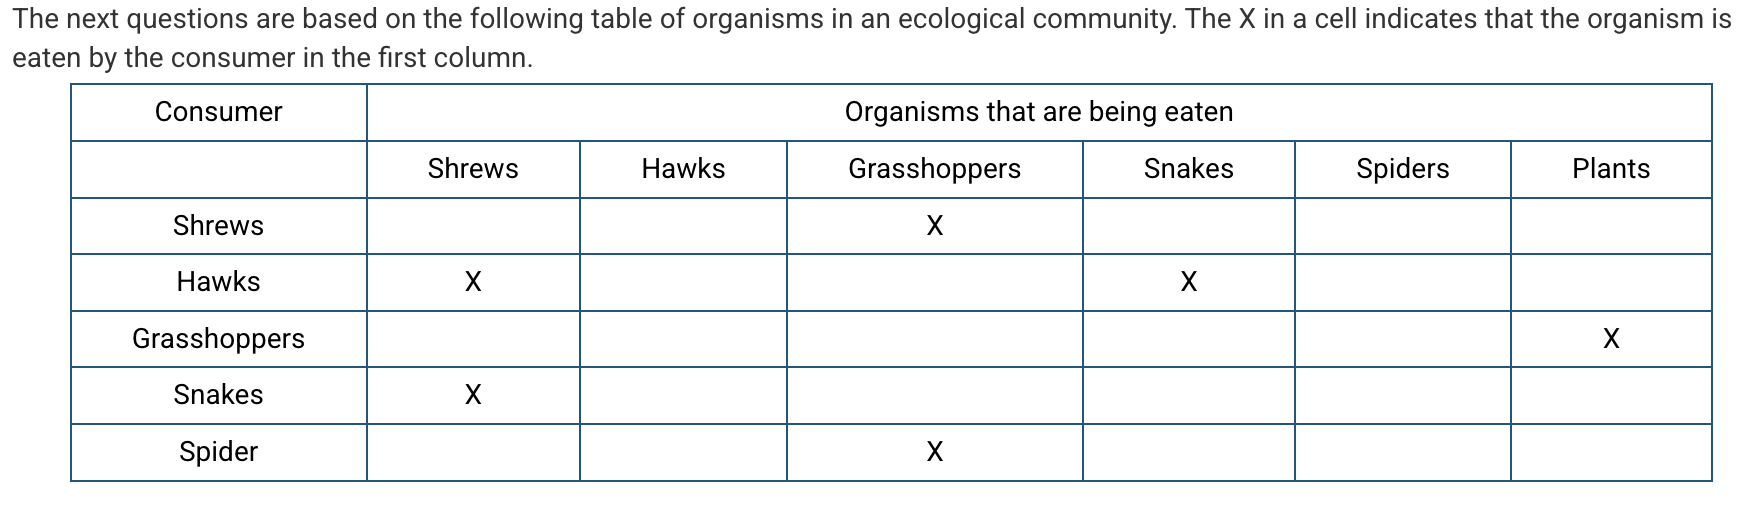
Based on the data in the table, if the number of snakes were to suddenly decrease, which of the following changes would most likely occur in the food web of this ecosystem?
(A) | increase in number of shrews | decrease in number of hawks |
(B) | increase in number of hawks | decrease in number of shrews |
(C) | increase in number of grasshoppers | decrease in number of plants |
(D) | increase in number of spiders | decrease in number of plants |
increase in number of shrews | decrease in number of hawks |

Which of the following categories of organisms, which are required for the cycling of matter in an ecosystem, is missing from the table
A
Producers
B
Primary consumers
C
Secondary consumers
D
Decomposers
Decomposers
The tropical rain forests are known to have a large variety of animals. One example is the orchid mantis that is highly camouflaged when standing on a certain species of orchid found in tropical environments. Another species, the tropical cockroach, can live anywhere in the rain forest where it can find water and a food source.
Which of the following statements best describes why it is predicted that the orchid mantis will be more affected by global climate change than the tropical cockroach will be?
A
As the climate changes, the number of orchids is likely to increase, leading to more competition for space by the mantis population.
B
Orchid mantises tend to be advantaged in habitats that remain constant; the rain forest habitat is likely to shift because of global climate change.
C
Orchid mantises are generalists, so global climate change will give them more diverse habitats to colonize.
D
Climate change will lead directly to the clear-cutting of the forests, resulting in a smaller habitat for both the mantis and the tropical cockroach.
Orchid mantises tend to be advantaged in habitats that remain constant; the rain forest habitat is likely to shift because of global climate change.