S2 Money and Banking
1/109
There's no tags or description
Looks like no tags are added yet.
Name | Mastery | Learn | Test | Matching | Spaced | Call with Kai |
|---|
No analytics yet
Send a link to your students to track their progress
110 Terms
What is money?
Money is primarily a medium of exchange that is accepted without question as a means of payment for goods and services.
A barter economy requires a double coincidence of wants.
Using gold and silver coins as a medium of exchange is expensive as society must cut back on the other uses of the commodity or devote scarce resources to additional production of that commodity.
What are the three important roles money plays? (apart from as a medium of exchange)
A unit of account
A store of value
A standard of deferred payment (a unit of account over time)
What do banks act as?
Financial intermediaries
They connect depositors and businesses that need to borrow. They lend out much of the money kept with them as deposits.
What are sight and time deposits?
Sight Deposits (Demand Deposits) – money you can access anytime
e.g. money in checking/current accounts that you can withdraw immediately without restrictions.
You can use it anytime via cash withdrawals, debit cards, or online transfers.
Time Deposits – money locked for a fixed period
e.g. money that cannot be withdrawn immediately; it is locked for a set period.
In exchange, banks pay interest on time deposits.
Example:
Fixed Deposits (FDs) / Certificates of Deposit (CDs)
You deposit £1,000 in a 1-year fixed deposit.
You cannot withdraw before 1 year without a penalty.
The bank pays you interest for keeping your money.
Explain assets and liabilities
Private commercial banks have assets and liabilities.
Their assets are mainly loans to firms and households, and purchases of financial securities such as bills and bonds issued by the government and firms.
Deposits are a liability for the bank. These include sight and time deposits. Chequing accounts are sight deposits. Savings accounts are time deposits.
Loans are a liability for NBPS but an asset for a bank.
Deposits are an asset for the NPBS but a liability for the bank.
Name some other financial intermediaries, and how they are different to banks
Insurance companies, pension funds and building societies are also financial intermediaries – they can take in money from the public in order to lend it out.
However, banks have a crucial feature. Some of their liabilities can be used as a means of payment and are thus part of the money stock.
What is the reserve ratio?
The “reserve ratio” is the % of deposits that banks cannot lend out. It is often assumed to be 10%. (although UK does not have a legally mandated cash reserve ratio for banks)
Explain fractional reserve banking and how it makes money.
You deposit £1000 in cash into a bank that you had under your mattress and your account balance shows £1000.
The bank must keep 10% of all deposits as reserves, the remaining £900 can be loaned out to someone else.
The bank loans £900 to a person named Sarah and she spends the £900 (for example, buying a laptop).
The shopkeeper receives £900 and deposits it into another bank.
Now, the bank has a new deposit of £900.
The bank keeps 10% of £900 = £90 as reserves and it loans out the remaining £810 to another person.
That person spends £810, and the money is deposited again.
The process continues, creating more deposits and loans each time
The total deposits in the system become £10,000, when the actual cash that was initially deposited was only £1,000.
The remaining £9,000 was created by the bank through loans.
What is the money multiplier?
Money multiplier = 1/Reserve ratio(e.g. 10%)
What is the monetary base?
The Monetary Base (MB) is the total amount of money that a central bank has created and made available in an economy. It includes:
Physical Cash & Coins – Money in circulation with the public.
Bank Reserves – The money that commercial banks keep as deposits at the central bank.
Monetary Base = Physical cash in circulation + Bank reserves
How does the central bank change the level of monetary base? (3 ways)
Open Market Operations (OMO) – Buying & Selling Bonds
To increase the monetary base → The central bank buys bonds from banks, giving them new reserves (more money in the system).
To decrease the monetary base → The central bank sells bonds, taking money out of circulation.
Changing the Reserve Requirement
Lower reserve requirements → Banks can lend more, increasing the money supply.
Higher reserve requirements → Banks must hold more cash, reducing money creation.
Changing the Discount Rate (Interest Rate for Banks)
Lower rates → Banks borrow more from the central bank, increasing the monetary base.
Higher rates → Banks borrow less, shrinking the monetary base.
Explain money supply (M0 - M4)
M0 = Cash in circulation
M1 = M0 + sight deposits (chequing accounts) in banks
M2 = M1 + Banks’ short-term time deposits (savings accounts)
M3 = M2 + longer-term time deposits in banks
M4 = M3 + other deposits (treasury bills and commercial paper)
What are insolvent banks?
Banks that have more liabilities than assets.
What can the central bank act as in times of financial panic and crises?
A lender of last resort.
Explain the difference between liquidity risk and insolvency risk.
Liquidity Risk – The risk of not having enough cash to meet short-term obligations.
A company or bank may have valuable assets but cannot quickly convert them into cash.
Insolvency Risk – The risk of having more liabilities than assets, meaning total debts exceed total assets.
This leads to bankruptcy because the company or bank cannot repay what it owes, even if given time.
What is shadow banking?
Shadow banking refers to financial activities carried out by non-bank institutions that provide services like loans and credit, similar to traditional banks, but without the same level of regulation.
Key Points:
Non-Bank Institutions: Includes entities like investment funds, insurance companies, and hedge funds.
Similar to Banks: They offer credit, but they’re not as strictly regulated.
Why may banks take bigger risks, and therefore need close monitoring?
In a financial panic, the central bank may need to rescue insolvent institutions, because a prominent financial institution becoming bankrupt may create systemic risk for the entire financial system.
This creates moral hazard, incentivising risk taking and irresponsible behaviour, as banks know that they will just be bailed out by the central bank. They only have to deal with the positives of the risk they take.
Because of this, banks need to be regulated closely, which can make them less nimble and efficient.
It is harder to regulate non-bank financial institutions (shadow banking).
What are bonds and how do they relate to interest rates?
Bonds are financial assets which are used by companies and governments for borrowing. Long term UK government bonds are known as gilts.
During its fixed lifetime (1, 2, 5 or 10 years or even longer), the bond pays a fixed dividend (a coupon) each year. When it expires, the government repurchases it for 100 GBP.
Suppose a bond pays a coupon of 5 GBP every year. The market interest rate is 5%.
Bonds are traded in the secondary market. Suppose the market interest rate rises to 10%. The price of the bond will immediately fall to 50 GBP from 100 GBP.
Given 10% interest rates, investors will only be willing to pay 50 GBP for receiving 5 GBP annual coupon payments.
Thus, bond prices and interest rates are inversely related.
Assuming there are only two assets, money and bonds, which is the liquid asset and which is the interest-bearing asset?
Liquid asset - Money, it is the medium of exchange for transactions.
Bonds - Interest-bearing asset that rewards investors with a return, but it cannot be used directly to pay for goods and services.
Why would anyone hold money then?
Because it provides liquidity – you can access it whenever you want (without any transaction costs) to pay for goods and services, and it is universally acceptable as a method of payment.
Why would anyone hold bonds?
Because, unlike money, it provides a financial return through the interest rate.
What determines money demand?
How much money we want to hold depends on how frequently we transact. It also depends on the institutional and technological factors specific to a particular economy.
We can use nominal GDP to approximate the volume of transactions.
Therefore, nominal money demand (Md) is proportional to nominal GDP (Py). Real money demand (Md/P) is proportional to real GDP y.
The higher the interest rate on bonds, the higher the opportunity cost of holding money and lower will be the demand for money.
Thus, real money demand increases with higher real income AND it decreases with higher interest rates.
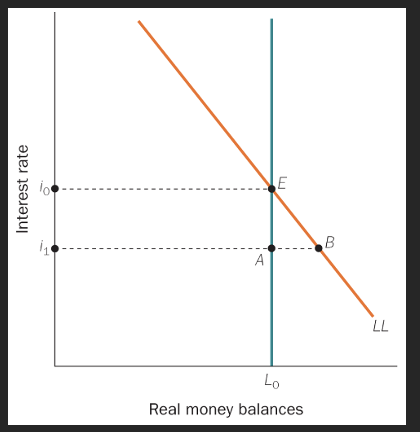
What does this graph show?
Shows the demand curve LL for real money balances for a given real income. The downward-sloping curve LL represents the demand for real money balances at different interest rates.
As interest rates rise, holding money becomes more costly (because people could earn higher returns by holding bonds instead), so people hold less money.
Conversely, as interest rates fall, holding money becomes cheaper, so demand for money increases.
With a given price level, the central bank controls the quantity of nominal money and real money.
The central bank controls the supply of money, represented by the vertical line at L₀ (fixed supply of real money balances).
This means the money supply is independent of the interest rate and remains constant at L₀.
The supply curve is vertical at this quantity of real money L0.
Equilibrium is at E.
The market clears at point E, where the quantity of real money balances supplied (L₀) equals the quantity demanded.
The corresponding interest rate at equilibrium is i₀.
At the interest rate i0, the real money people wish to hold just equals the outstanding stock L0.
What is the traditional role of central banks in controlling money supply and how does their influence change in the short and long run?
The traditional account of central banking views the central bank as controlling the nominal money supply in the economy (not adjusted for inflation).
The central bank has monopoly power to supply “narrow money” or the “monetary base” (or high-powered money) – that is, currency plus cash reserves held at the central bank.
Assuming the money multiplier is stable, the central bank can also control the total money supply or broad money.
If we assume prices are fixed (it would make sense to assume that only in a short run macroeconomic model), the central bank also controls the real money supply.
But in the long run, with prices being flexible, real money supply cannot be determined directly by the central bank.
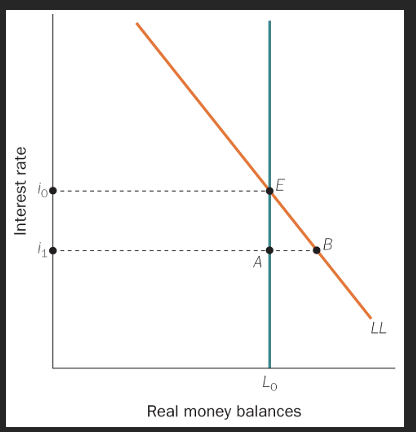
Suppose the interest rate is i1 instead of i0. How do we get to equilibrium?
At i1, there is an excess demand for money, which implies an excess supply of bonds. (Money and bonds are the only two ways to store wealth or purchasing power under our assumptions).
To make people want more bonds, suppliers of bonds offer a higher interest rate. The higher interest rates reduce both the excess supply of bonds and the excess demand for money moving the economy to i0.
For a given real money demand schedule, how does the central bank adjust money supply?
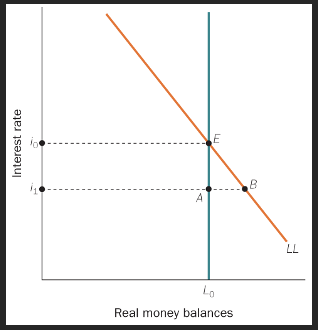
For a given real money demand schedule, the central bank does not choose the money supply and accept the equilibrium interest rate.
Instead, it sets the interest rate and passively (endogenously) adjusts the money supply to enforce its desired interest rate as a market equilibrium.
In the graph, if the central bank wants to achieve an interest rate of i0, it must arrange for the money supply to be L0. Even if it is unsure of the money multiplier, it simply adjusts the monetary base, until the market delivers the interest rate i0.
Why do modern central banks prefer to use interest rates as an instrument?
First, uncertainty about the size of the money multiplier.
Second, money demand is much less predictable than before, due to the existence of a plethora of non-money assets with low transaction costs.
If the central bank is unsure of the level of money demand, it is unsure what the consequences will be of setting a particular level of money supply. Setting interest rates directly gives it much better control.
When the interest rate is higher (or lower) than the target rate, the central bank conducts expansionary (or contractionary) OMO’s until the interest rate reaches the target level.
What is the major target of central banks?
For central banks today, their major target is usually price stability - a low and stable inflation rate, although central banks also care about output and employment. Modern central banks are generally inflation targeting central banks.
How does monetary policy affect the economy?
In a closed economy, monetary policy influences aggregate demand (consumption and investment) by affecting interest rates.
Let’s look at the relationship between interest rates and consumption demand.
The price of company shares, or long-term government bonds is the present value of an expected stream of dividend earnings or coupon payments.
When interest rates fall, future earnings, now discounted at a lower interest rate, are worth more today.
Lower interest rates make the price of corporate shares and bonds rise and make households wealthier.
Apart from the wealth effect, expansionary monetary policy makes more credit available to consumers AND it also lowers the cost of that credit.
Expansionary OMO increases the cash reserves of the banking system and allows it to extend more consumer credit.
Should long-term investors care about short-term interest rates?
Since companies can finance a long-term investment with a succession of short-term loans over many time periods, there should be a relationship between the long-term interest rate today and the sequence of expected short term interest rates over the same time period.
Governments can better influence long term investment decisions (of households or firms) by affecting beliefs about future short-term interest rates.
This can be done through forward guidance which is an indication by the central bank of the future interest rate it intends to achieve. The success of forward guidance depends partly on the credibility of the central bank.
If changing the current interest rate has little effect on the long-term interest rate, then the transmission mechanism from monetary policy to aggregate demand will be weak.
Does a change in the Bank Rate always lead to changes in borrowing costs for households and firms?
Changes in the bank rate (UK) often filters through to other rates that matter more directly for consumers and firms – like interest rates on auto loans, home mortgages and the interest rate at which companies can borrow from the banks, but this is not guaranteed.
When the Bank of England changes the Bank Rate, it is supposed to influence other interest rates (e.g., mortgages, car loans, business loans).
However, this transmission is not guaranteed—banks and lenders might not always adjust their rates immediately or fully.
The extent to which changes in the Bank Rate filter through to the economy depends on factors like market competition, risk perceptions, and the structure of loan contracts (fixed vs. variable rates).
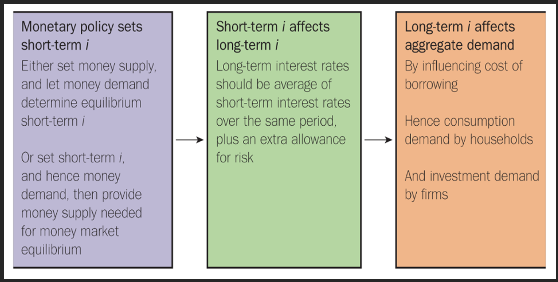
What is happening to interest rates in the economy?
There are falling short term interest rates, but rising long term interest rates.
What are government bond yields a benchmark for?
A lot of other interest rates in the economy (auto-loans, mortgages etc).
What are yields on long term government debt determined by?
Yields on long term government debt is determined by investors’ expectations of short-term interest rates during the duration of the debt PLUS a compensation for risk. (for locking in capital for a longer period). The compensation for risk is called term premium.
Long term yields may be going up perhaps because market participants expect higher inflation in the future.
Higher inflation implies the central bank won’t be cutting rates in the future or may even increase rates. Long term yields may also rise due to an increase in the term premium.
What does the yield curve show?
The yield curve shows the interest rates at which the government can borrow money over different time horizons. We usually expect the yield curve to be upward sloping.
For some economies (for example, the US) a downward sloping yield curve (long term interest rates being lower than short term) have been followed by a recession.
For many rich countries, a more flattening yield curve may indicate slower growth, while steepening yield curves indicate an acceleration. However, the evidence on this is not conclusive
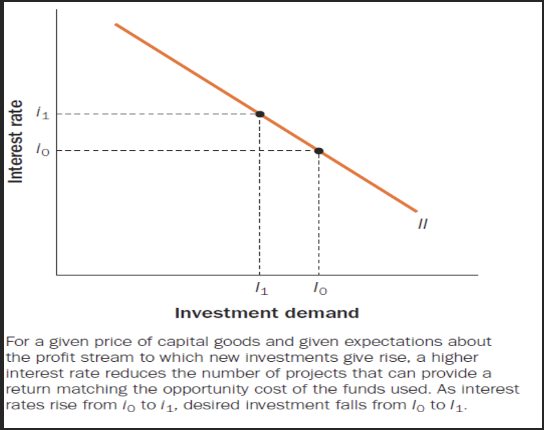
Explain investment demand’s relation to interest rates
Investment demand is inversely related to interest rates. At higher rates of interest, only some investment projects with higher returns are viable; with lower interest rates, more investment projects might become viable.
What else affects investment demand in the economy?
Expectations of future output demand AND cost of capital goods.
What is quantitative easing?
Quantitative easing (QE) (shown by the graph) is a form of unconventional monetary policy by central banks. Given that banks sought to reduce lending and deposits in the aftermath of the financial crash (and demand for credit was also lower), the money multiplier fell sharply.
Through QE, the central banks dramatically expanded the monetary base by creating cash and buying bonds from financial institutions.
One major objective of QE was to counteract the lower money multiplier and maintain a reasonable path for the supply of broad money.
Was this objective satisfied?
The graph suggests the answer is yes, but it did require substantial QE as we can see from the previous slide.
If the European central bank didn’t take any action, the monetary base would have been unchanged, but money supply would have fallen sharply which could have made the financial crisis worse. The FED was the first to act and other central banks in UK and Europe followed suit.
QE consists of the central bank buying large quantities of government bonds (and sometimes other financial assets like corporate bonds) in exchange for newly created cash.
How is QE different from other OMO’s?
With QE, the central bank directly purchased not just short-term government bonds (T-bills in the US), but bonds of different maturities in order to directly influence medium/long term interest rates in the economy.
By buying such large quantities of bonds of longer maturities, the central banks hoped to bid up their prices and lower longer-term interest rates, even though short term interest rates were already very close to zero.
We cannot assume that money multipliers are stable over time.
Central banks balance sheets are now enormous – they have created lot of money (liability) and acquired lots of bonds as assets.
Quantitative tightening (QT) would involve central banks shrinking their balance sheets by selling bonds in exchange for cash and then retiring the cash from circulation.
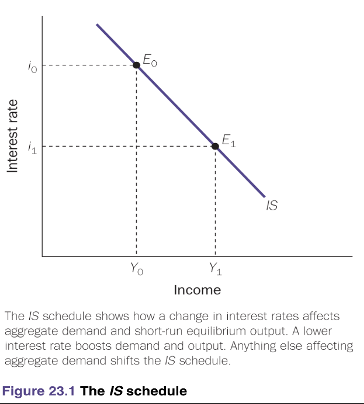
Explain the IS schedule (investment savings)
The IS curve shows all combinations of output (Y) and the real interest rate (r) where the goods market is in equilibrium. It is derived from the national income identity.
The goods market is in equilibrium when aggregate demand equals output/income. The goods market equilibrium is depicted by the IS schedule.
It is negatively sloped because higher output requires higher aggregate demand for equilibrium and a lower interest rate is needed for aggregate demand to rise. Also, higher real interest rates (r) reduce investment and lower aggregate demand, decreasing output (Y) and lower interest rates boost investment and increase output.
What are the factors that will shift the curve? Government expenditure (G), T (taxes) and expectation of future income growth.
Changes in interest rates moves the goods market along a given IS schedule. Anything else that affects aggregate demand is shown as a shift in the IS schedule.
Does it make sense to have the IS schedule as a straight line or should it be a curve? The slope of the IS schedule reflects how sensitive aggregate demand is to changes in interest rates.
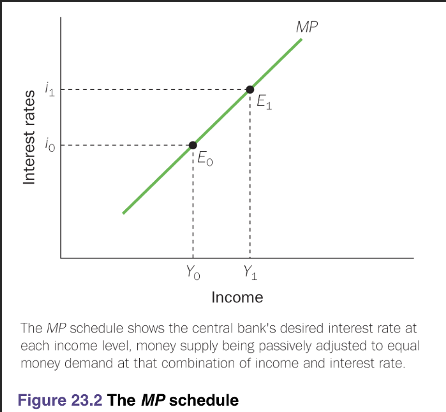
Explain the MP schedule (monetary policy)
Depicts money market equilibrium, shows how the central bank sets the real interest rate based on inflation and economic conditions.
In our analysis, a change in monetary policy would imply the government chooses a lower interest rate for ANY level of income – that implies a rightward shift of the MP curve.
Along the MP schedule, the central bank is achieving its desired interest rate for every level of real income. These levels of interest rate and income also imply a level of money demand. The central bank passively supplies that quantity of money to ensure money market equilibrium.
When output is high, the central bank is likely to use higher interest rates. Why?
The slope of the MP schedule indicates how aggressively the central bank raises interest rates as output/income increases.
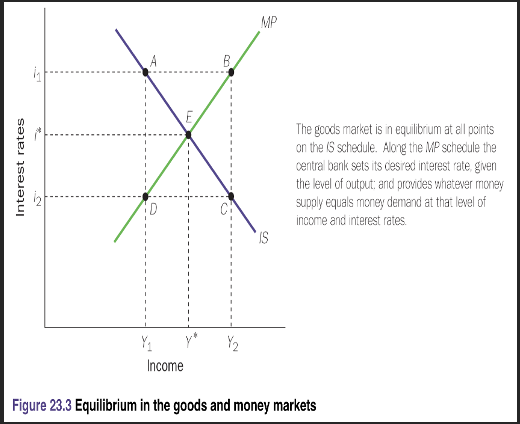
How does a fiscal expansion affect the IS-MP model equilibrium?
Economy-wide equilibrium requires both the goods market (IS curve) and the monetary policy rule (MP curve) to clear. The initial equilibrium is at interest rate i∗ and income level Y∗.
Effects of a Fiscal Expansion (↑G):
IS Curve Shifts Right → Higher government spending increases output, moving equilibrium from E to E1.
Central Bank Responds → The new IS curve (IS1) intersects the old MP curve (MP0), prompting the central bank to raise interest rates.
Crowding Out Effect → Higher interest rates reduce private investment, partially offsetting the expansionary effect of increased GGG.
Bottom Line: Fiscal expansion raises output but triggers a monetary policy response that limits its full impact due to crowding out.
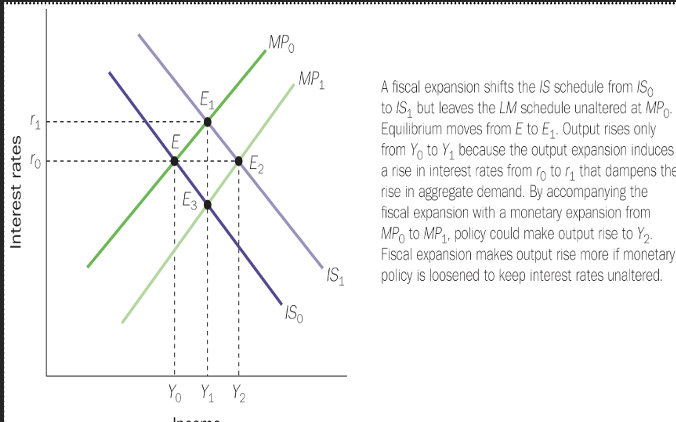
Why do interest rates rise when G (gov spending) expands?
When the government increases G, it can finance spending by issuing debt.
If the central bank buys this debt with newly created money, the money supply expands, making fiscal expansion also a monetary expansion.
If the government borrows from the private sector, it competes with private borrowers for the same pool of savings, leading to higher interest rates.
This effect is known as crowding out, where higher government borrowing reduces private investment.
In the IS-MP model, higher G shifts the IS curve right, increasing output.
The central bank raises interest rates (moving along the MP curve) to prevent overheating and inflation.
Higher interest rates may reduce investment (I) and net exports (NX) due to an appreciating currency.
What is the relationship between government spending (G) and interest rates in the IS-MP model?
Government spending (G) increases → IS curve shifts right → Higher output (Y) at any given interest rate.
Higher Y leads the central bank to raise interest rates (r) to prevent overheating (movement along the MP curve).
Higher r can reduce investment (I) and net exports (NX) due to a stronger currency.
This effect is called crowding out, where government borrowing increases competition for funds, raising interest rates.
If the central bank does not adjust rates, inflationary pressures may build up due to excess demand.
What happens when the central bank adopts a looser monetary policy in the IS-MP model?
A looser monetary policy shifts the MP curve downward (right).
This means a lower interest rate is chosen at every level of output.
If fiscal expansion (higher G) happens simultaneously, both policies work together to stimulate the economy.
Example: After the Global Financial Crisis (GFC) and during COVID, central banks lowered interest rates to support fiscal expansion.
What happens in the IS-MP model during a fiscal contraction?
A fiscal contraction (lower G or higher taxes) shifts the IS curve left (downward) from IS₁ to IS₀.
This moves the economy from E₁ to a new equilibrium E, resulting in lower output (Y).
Depending on the monetary policy response, interest rates may remain the same or adjust.
What happens when money demand changes in the IS-MP model?
The central bank adjusts the money supply to match changes in money demand.
Since the central bank sets interest rates based on output, interest rates do not change directly due to shifts in money demand.
Instead, the central bank ensures stability by accommodating shifts in liquidity needs.
How does fiscal policy impact the economy in the IS-MP model?
Fiscal policy involves changes in government spending (G) and taxation (T), which shift the IS curve and impact output (Y) and interest rates (r).
The fiscal multiplier the (extent to which a rise in G or a cut in T impacts GDP) determines how much GDP changes in response to fiscal policy.
The size of the fiscal multiplier depends on:
a) How much of the fiscal stimulus leads to additional purchases of goods and services.
b) Leakage abroad—if a significant portion is spent on imports, the multiplier effect weakens (especially in small open economies).
c) Impact on interest rates and debt sustainability—higher G could raise r, reducing private investment, or raise concerns about government debt.
Monetary policy interacts with fiscal policy by adjusting r in response to changes in Y, influencing the overall economic impact.
What is one of the major challenges for fiscal policy?
It is often hard for governments to spend significant sums of money within a relatively short period of time.
Monetary policy can move more rapidly.
Should fiscal policy have an effect with rational consumers?
When government’s finance additional spending through borrowing, the public knows that the government needs to pay back the money with interest.
The government will probably need to raise taxes in future to repay the borrowing.
Perhaps rational consumers will lower their spending today (increase their savings) to ensure that they can pay those higher taxes in the future.
This theory is known as Ricardian equivalence. Whether governments raise revenues by increasing taxes today or by borrowing should not matter for rational consumers.
Why are fiscal multipliers often higher during periods of recession or economic slowdown?
Fiscal multipliers are positive because government spending (G) has a larger impact on output during economic downturns when private spending is weak.
Recessions amplify the effectiveness of fiscal policy due to unused economic capacity (e.g., unemployed labor and capital).
During a slowdown, additional government spending can stimulate demand and output more effectively than during periods of economic expansion.
What were the challenges with fiscal stimulus during the 2008 financial crisis?
Government debt was already high in 2008, and the debt-to-GDP ratio increased further due to bailouts for banks.
A robust fiscal stimulus could have created an unsustainable government debt-to-GDP ratio.
Monetary policy played a crucial role in supporting the economy by lowering interest rates and providing liquidity, helping to mitigate the risks of increasing government debt.
How can monetary and fiscal policies coordinate to stabilize output at Y?*
The government can use expansionary fiscal policy (higher government spending or lower taxes) along with tight monetary policy (higher interest rates) to stabilise output at Y*.
Alternatively, the government can use expansionary monetary policy (lower interest rates or increased money supply) with tight fiscal policy (lower government spending or higher taxes).
This coordination affects the composition of final demand:
Tight fiscal policy reduces the share of government spending (G) in GDP.
Easy monetary policy increases the share of investment (I) in GDP.
What are the costs of a recession, and can fiscal and monetary policies fine-tune the economy to avoid them?
Recessions result in high welfare costs, such as lost jobs, bankruptcies, and poor health due to financial stress.
Recessions may also cause long-term damage to the economy, including permanent loss of skills and lower potential output.
While fiscal and monetary policies can mitigate the severity of recessions and booms, fine-tuning them to perfectly avoid recessions or high inflation is difficult due to:
Uncertainty in economic forecasting.
Time lags in policy implementation and effectiveness.
Potential policy missteps and the risk of inflation during overly aggressive interventions.
Explain aggregate demand management with fiscal and monetary policies and why they aren’t fully effective
Let’s assume that potential output is fixed at Y*.
Potential output is what the economy can produce when all resources are productively employed. (It is determined by the level of technology, human capital, labour force etc). When actual output is lower than potential output, we have a negative output gap. (which implies higher unemployment).
Monetary and fiscal policies are tools for managing aggregate demand so that we can avoid a negative or positive output gap from arising or persisting. A positive output gap (actual output > potential output) generates inflationary pressures.
Fiscal and monetary policies are less than fully effective because:
a) We rely on high frequency macroeconomic data to assess the economic situation at a given point in time and these data are imperfect and subject to revision. Economic weakness can emerge quickly, and economy can spiral downwards fast.
b) Policy influences the economy with a (variable) lag, as we saw during our discussion on monetary policy.
c) Monetary policy has a zero lower bound problem, and it is not clear that quantitative easing QE is an adequate solution for that.
Why may the effectiveness of fiscal policy be limited?
If the government already has a high level of debt, the effectiveness of fiscal policy might be limited.
There may also be less room for a large fiscal stimulus.
Fiscal policy may also fail to stimulate the economy effectively if consumers and businesses are very pessimistic about the future and refuse to increase their spending in response to tax cuts or transfer payments to households.
What are the key assumptions of the classical model, and how does it differ from the IS-MP model?
The classical model assumes that output is always at its long-run equilibrium level (potential output).
Any deviation from potential output is quickly corrected by flexible prices and wages.
In contrast, the IS-MP model assumes that aggregate demand determines output, focusing mainly on demand-side factors.
By considering both demand and supply, we can better understand how prices are determined in the economy.
Why don’t central banks target zero inflation?
In the long run, the classical model applies, but in the short run, when prices and wages are sticky, Keynesian effects dominate (aggregate demand determines output).
Most central banks set an inflation target around 2% rather than zero.
Why not target zero inflation?
Some inflation is necessary for economic growth and flexibility.
Wage rigidity: A small positive inflation rate allows for real wage adjustments without nominal wage cuts.
Avoiding deflation: Zero or negative inflation can lead to deflation, discouraging spending and investment.
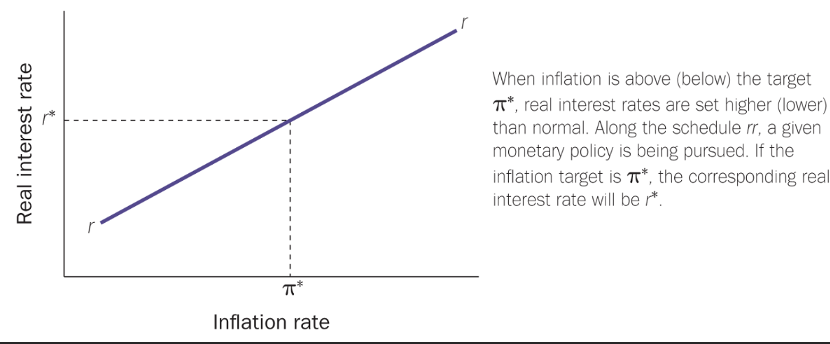
How do you work out the real interest rate?
Nominal inflation rate - the inflation rate
As the central bank doesn’t directly control the price level in the eonomy or the inflation rate. how can it set the real interest rate?
The central bank forecasts inflation and then sets nominal interest rates to achieve the desired real interest rate.
A particular rr schedule reflects a particular monetary policy. Changes in monetary policy are shown by shifts of the rr schedule. A looser monetary policy shifts the rr schedule downwards, it implies lower interest rates for any level of inflation.
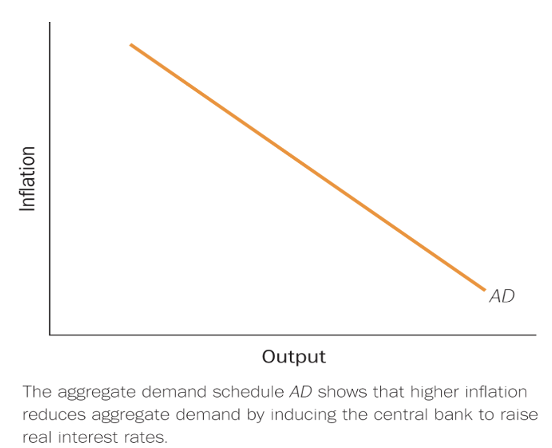
Explain the aggregate demand schedule
The graph above shows the economy’s aggregate demand schedule. Movements along the AD curve shows how inflation makes the central bank alter interest rates, and thus aggregate demand.
What determines the slope of the AD schedule? The AD schedule is flat when…
a) interest rate decisions react a lot to inflation
b) interest rates have a big effect on aggregate demand
Shifts in the AD curve will capture all other influences on aggregate demand which are not caused by the influence of inflation on interest rates.
The AD shifts up and to the right when there is a fiscal expansion or increases in net exports or an easier monetary policy.
How can we derive/trace the economy’s aggregate demand curve?
Corresponding to any point on the IS curve (point A, for example), we can deduce the associated real interest rate on the vertical axis, and then the associated inflation rate on the horizontal axis in the top left panel.
Then we use the 45-degree line to convert it to the same inflation rate on the vertical axis. That allows us to define point A on the bottom right panel. Repeating this for each point on the IS schedule helps us trace out the economy’s AD curve.
Movements along the AD schedule shows how demand, interest rates and inflation move together.
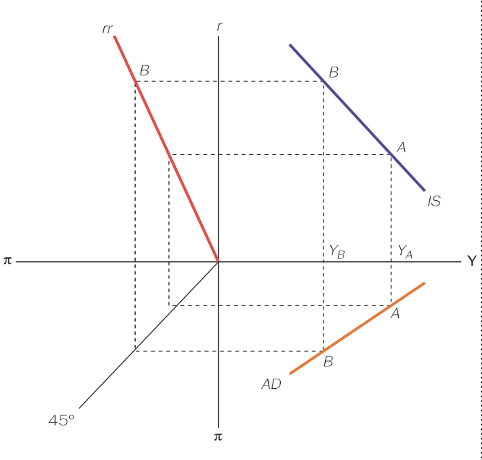
What would cause the demand schedule to shift?
The 45-degree line cannot change, so it must be the rr schedule (monetary policy) or the IS schedule. (which changes due to higher G, cut in taxes or autonomous shifts in consumption).
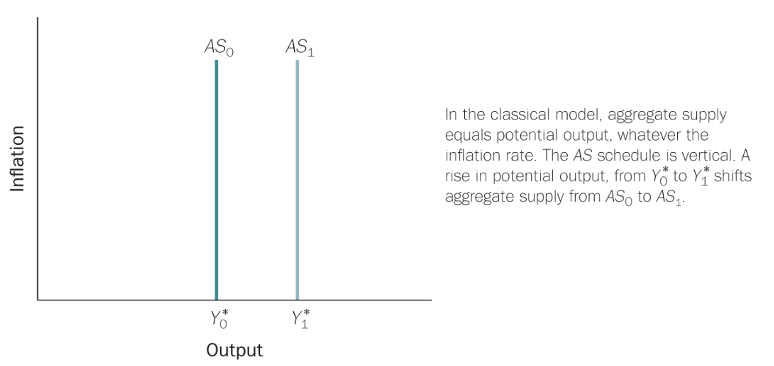
What determines aggregate supply in the long run, and why is it vertical?
When wages and prices are completely flexible, output remains at potential output.
Potential output depends on:
Factors of production (physical capital, human capital, land, energy).
Efficiency in resource utilisation.
Effect of inflation on output supply:
Flexible wages mean nominal wages (w) rise with prices (p) → Real wages remain unchanged.
Marginal product of labor is constant, so firms do not change output.
Workers' purchasing power remains the same, meaning no change in labor supply.
Conclusion:
The aggregate supply (AS) curve is vertical at potential output.
Nominal changes (e.g., inflation) do not affect real output or employment → This is called monetary neutrality.
Monetary neutrality holds in the long run when prices and wages are fully flexible.
What determines equilibrium output and inflation in the AD-AS model?
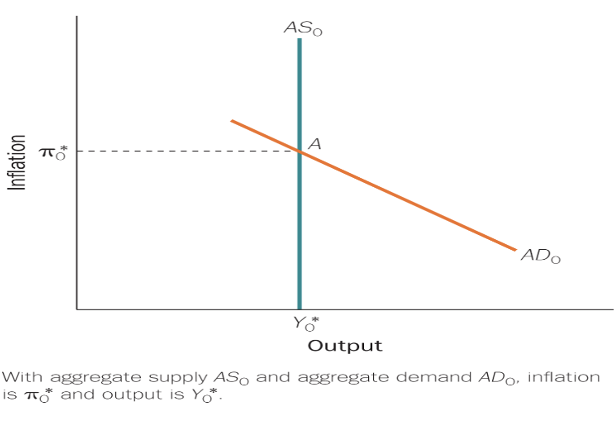
Equilibrium occurs where the Aggregate Demand (AD) and Aggregate Supply (AS) curves intersect.
The central bank adjusts interest rates (via the rr schedule) to ensure equilibrium inflation aligns with the inflation target.
If inflation is too low, the central bank adopts a looser monetary policy (shifting the rr schedule down); if inflation is too high, it tightens policy (shifting the rr schedule up).
In a model with a vertical AS curve, aggregate demand only determines the price level and does not influence output or employment.
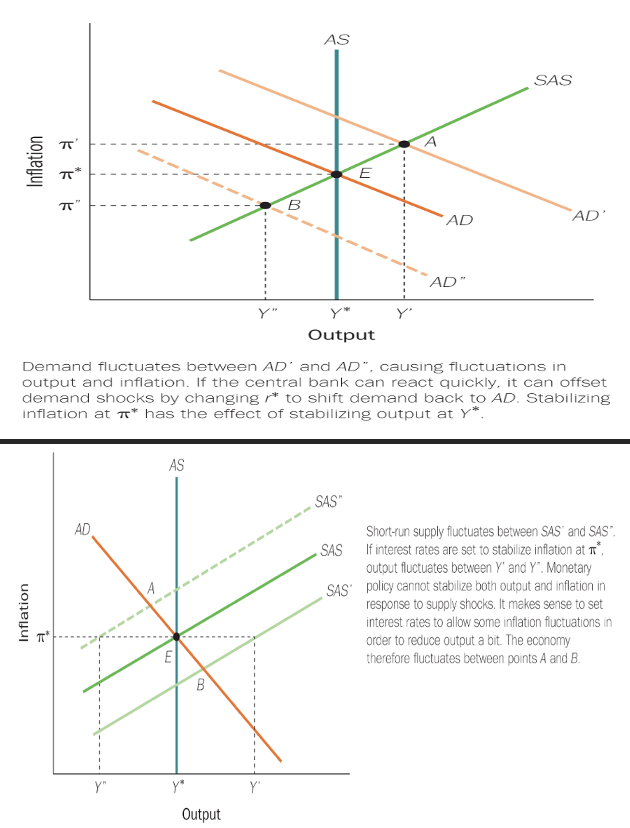
What is the impact of a supply shock on inflation and the economy?
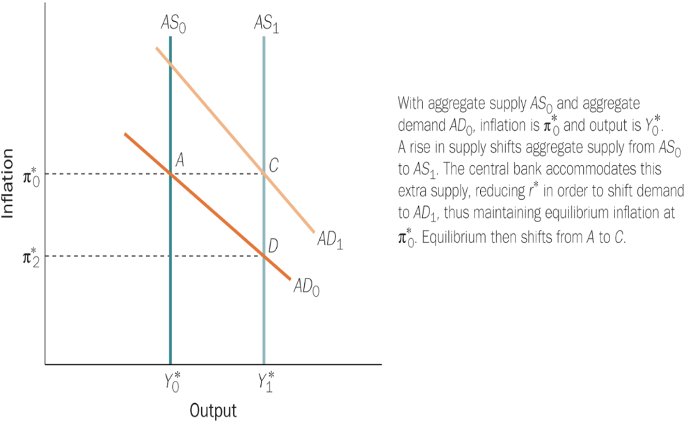
A positive supply shock (e.g., productivity growth from new technology) increases supply, leading to lower prices (deflationary effect).
A negative supply shock (e.g., rising oil/energy prices or supply chain disruptions) reduces supply, leading to higher prices (inflationary effect).
Negative supply shocks, such as high energy prices and COVID-related disruptions, contributed to the UK’s high inflation in 2022.
What is the impact of a demand shock on inflation and monetary policy?
A positive demand shock (e.g., increased consumer confidence, investor sentiment, or government spending) shifts the AD curve rightward, raising inflation.
The central bank responds by raising interest rates to bring AD back to its original position and keep inflation on target.
Unlike the IS-MP model (where fiscal expansion is only partially crowded out), in this model, crowding out is complete—aggregate demand only affects the price level, not output or employment.
Growth in nominal money supply only affects inflation, a key idea in monetarism.
The recent oil price shocks had a muted effect on inflation and didn’t cause a recession, unlike the oil shocks of the 1970s.
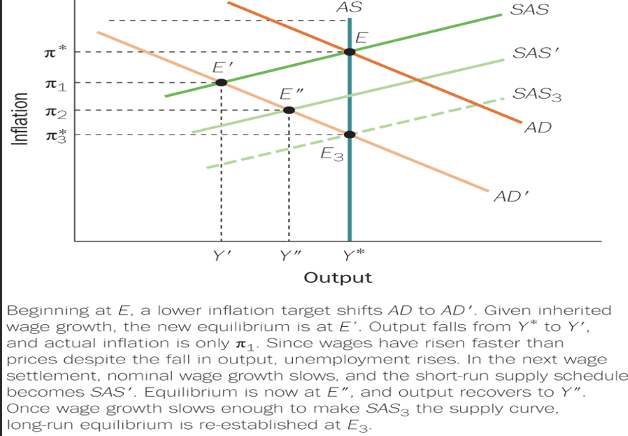
What determines the shape and movement of the short-run aggregate supply (SRAS) curve?
The SRAS curve is positively sloped because prices are somewhat flexible in the short run, but money wages are rigid.
Each SRAS curve corresponds to a given rate of nominal wage growth, which is influenced by inflation expectations.
In the short run, if prices rise faster than expected, the economy moves along the SRAS curve.
In the medium/long run, if prices remain high, wage growth increases, causing the SRAS curve to shift upward.
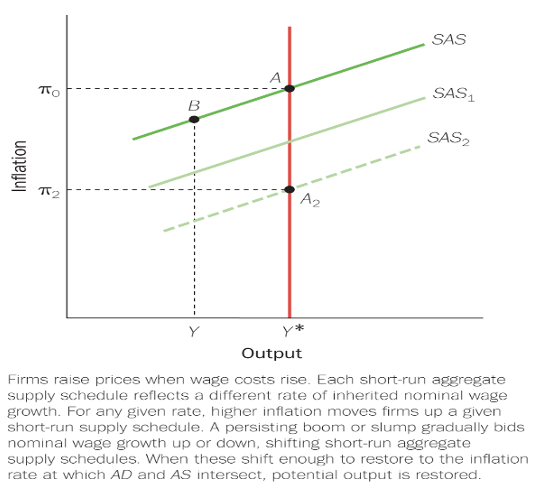
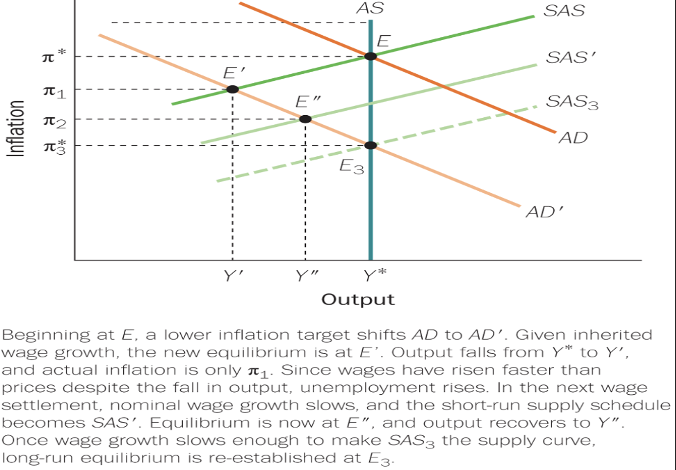
How does the economy adjust from the short run to the long run after a monetary policy tightening?
A tightening of monetary policy shifts the AD curve downward, reducing output and employment in the short run due to rigid wages and sluggish price adjustments.
The economy moves from E to E1, where inflation falls but money wages remain unchanged, increasing the real wage. Firms respond by cutting output and laying off workers.
Over time, lower inflation leads to lower inflation expectations, causing nominal wage growth to slow. This shifts the SRAS curve downward.
Once wage growth slows enough, SRAS3 becomes the new supply curve, and long-run equilibrium is restored at E3.
Long-run output is determined by supply-side factors (technology, capital, labor, land, energy) and is unaffected by aggregate demand changes.
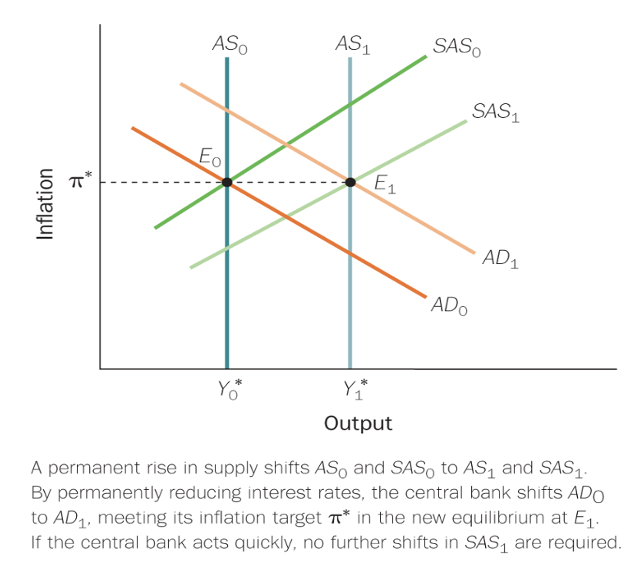
What is the impact of a permanent positive supply shock on the economy?
A permanent positive supply shock (e.g., technological advancement) increases supply and lowers inflation below the target level.
In response, the central bank lowers interest rates permanently, stimulating aggregate demand (AD shifts right).
Output increases, and inflation returns to its target level, ensuring long-run economic stability.
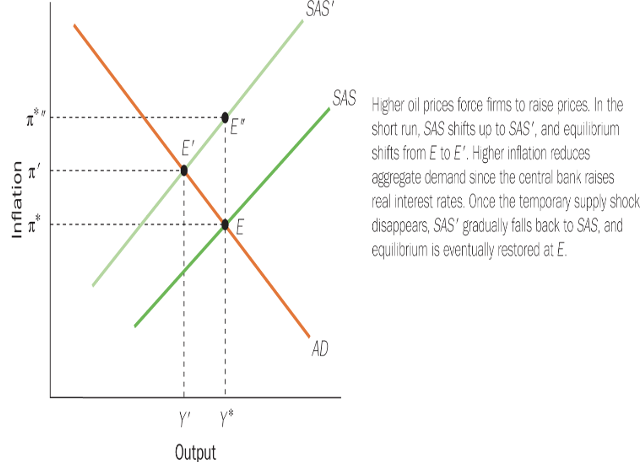
What is the impact of a temporary supply shock, such as a rise in oil and gas prices, on the economy?
A temporary supply shock, such as an increase in oil and gas prices, causes firms to charge higher prices for any level of output.
This results in the SRAS (Short-Run Aggregate Supply) curve shifting upwards and to the left, as firms pass on higher input costs.
Equilibrium moves from E to Edash, leading to lower output and employment.
To combat inflation, the central bank raises interest rates, which reduces output and employment further.
What is the wage-price inflationary spiral, and how did it manifest in the 1970s?
A wage-price inflationary spiral occurs when workers expect higher inflation and demand higher wages, which in turn raises production costs.
As costs rise, firms increase prices to cover higher wages, which fuels further inflation, creating a cycle.
In the 1970s, this spiral was particularly evident, with oil price shocks causing inflation and wage demands to spiral upward.
How does the central bank's response to a temporary supply shock affect output and employment?
If the central bank maintains its inflation target at ⎍*, the economy experiences a fall in output and employment at Edash.
Lower output leads to reduced prices and nominal wage growth, causing the SRAS curve to shift downwards back to its original position.
Unemployment at Edash forces money wages down, allowing firms to reduce prices.
The economy moves down the AD (Aggregate Demand) schedule back to its original equilibrium.
Can a recession caused by a temporary supply shock be avoided, and what role does the central bank play?
The central bank can avoid a recession by increasing the inflation target. This would allow for lower interest rates, which would shift the AD curve enough to keep output unchanged (as shown at E double dash).
However, the central bank is unlikely to tolerate higher inflation in the long term, even if it helps stabilize output, because prolonged inflation can have damaging effects on the economy.
What is the Taylor Rule, and how do central banks use it to set interest rates?
The Taylor Rule, proposed by Prof. John Taylor, suggests that central banks set interest rates based on deviations of inflation (⎍) and output (Y) from their target long-run equilibrium levels (⎍* and Y*).
The formula for the Taylor Rule is:
r – r = a(⎍ - ⎍) + b(Y – Y*)**
Where:
r = real interest rate
⎍ = inflation rate
Y = real output
denotes long-run equilibrium levels
a and b are positive constants indicating the weight given to inflation and output deviations.
Nominal interest rate i is related to the real interest rate r and inflation by i = r + ⎍. This leads to the alternative formula:
i - i = (1 + a) (⎍ - ⎍) + b(Y - Y*)**.
When inflation exceeds its target by 1%, the nominal interest rate will rise by more than 1% to ensure real interest rates increase and bring inflation down.
The target inflation rate is typically set by the government, not the central bank.
The parameters a and b indicate how much importance the central bank places on controlling inflation vs. stabilizing output in the short run.
What do the parameters a and b in the Taylor Rule represent, and how does the rule reflect the central bank's priorities?
The parameters a and b in the Taylor Rule represent the weight the central bank places on inflation (a) and output (b) deviations from their target levels.
a > 0 means the central bank responds to inflation deviations.
b > 0 means the central bank responds to output deviations.
If output exceeds its long-run equilibrium (Y > Y*), inflationary pressures rise, and the central bank may increase interest rates to prevent further inflation.
The Taylor Rule reflects the central bank's concern for both current and future inflation, signaling a balancing act between stabilizing inflation and maintaining output at its potential level.
Evidence suggests that many central banks follow a version of the Taylor Rule, though this is not conclusive for all periods or economies.
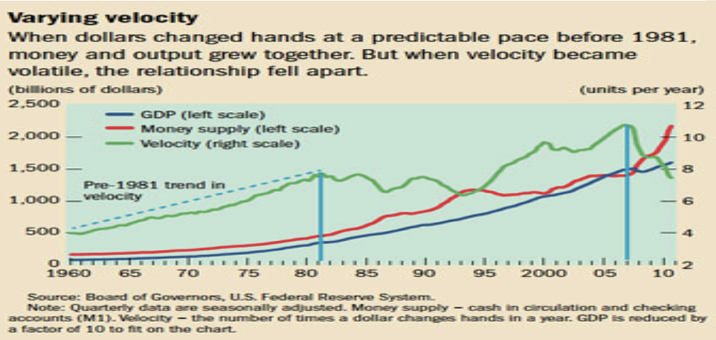
What is the Quantity Theory of Money and how is it represented mathematically?
The Quantity Theory of Money is summarized by the equation:
MV = PY
Where:
M = nominal money supply
V = velocity of money (how many times money changes hands in a year)
P = price level
Y = real output (GDP)
The velocity of money V is determined by institutional and technological factors in the economy and doesn't change much in the short run.
What are the implications of the Quantity Theory of Money?
Velocity (V) is relatively stable in the short run, determined by the economy's institutional and technological characteristics.
Real output (Y) changes gradually, so large and sustained increases in prices (inflation) are primarily due to increases in the money supply (M).
Sustained inflation is largely a monetary phenomenon, meaning it is mainly driven by an increase in money supply.
In the short run, a change in the money supply (M) can affect real money supply (M/P), which in turn affects interest rates, output, and employment.
In the long run, after prices and wages adjust, money is neutral and does not affect real variables like output, employment, or real interest rates.
How does the Quantity Theory of Money explain the effects of changes in money supply in the short run versus the long run?
Short run: A change in the money supply (M) leads to a change in real money supply (M/P). This can affect interest rates, output, and employment due to sluggish price and wage adjustments.
Long run: Once prices and wages fully adjust, money becomes neutral. This means changes in the money supply no longer affect real variables (like output or employment). The economy returns to its long-run equilibrium, where only nominal variables (like the price level) are affected by changes in the money supply.
What is the Fisher hypotheses?
[Real Interest rate] = [Nominal interest rate] – E[Inflation rate]
The Fisher hypothesis says that real interest rates do not change much. Higher inflation rates are largely offset by changes in nominal interest rates, as the graph on the next slide shows.
![<p>[Real Interest rate] = [Nominal interest rate] – E[Inflation rate]</p><p>The Fisher hypothesis says that real interest rates do not change much. Higher inflation rates are largely offset by changes in nominal interest rates, as the graph on the next slide shows. </p>](https://knowt-user-attachments.s3.amazonaws.com/a777cbdc-3a20-498f-8f37-50ef39f7a991.png)
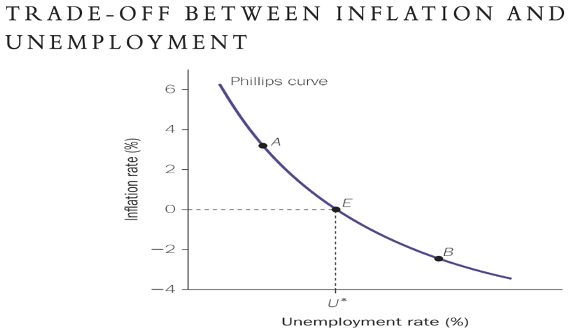
What is the Phillips Curve, and what does it illustrate about inflation and unemployment?
The Phillips Curve, discovered by Professor Phillips in 1958, shows a negative relationship between annual inflation and annual unemployment rates.
During economic booms, low unemployment leads to higher wages, as workers can demand better pay.
Employers pass these higher wage costs to consumers, resulting in higher inflation.
Conversely, during downturns, high unemployment leads to slower wage growth and lower inflation.
The Phillips Curve suggests that policymakers can trade off between inflation and unemployment by adjusting fiscal and monetary policy.
How can policymakers use the Phillips Curve to influence inflation and unemployment?
Policymakers can choose a desired point on the Phillips Curve by adjusting aggregate demand through fiscal or monetary policy.
Expansionary policy (lower interest rates, higher government spending) reduces unemployment but increases inflation.
Contractionary policy (higher interest rates, reduced government spending) lowers inflation but raises unemployment.
This trade-off suggests a short-run ability to influence both inflation and unemployment, but in the long run, the relationship may change due to factors like expectations and supply shocks.
What does the Long-Run Phillips Curve (LRPC) show, and why is it different from the short-run Phillips Curve?
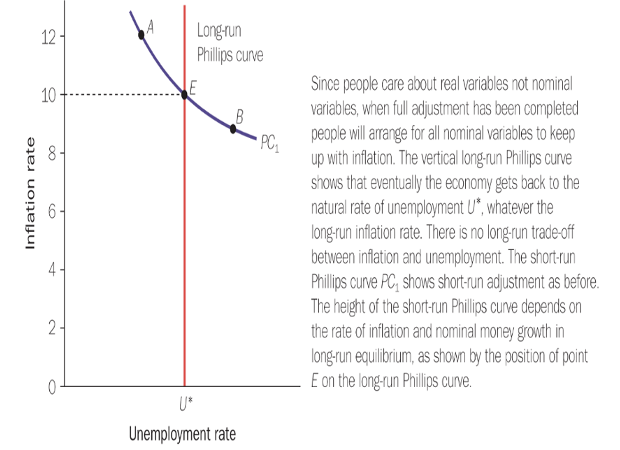
In the long run, the Phillips Curve is vertical at the natural rate of unemployment—the level of unemployment consistent with potential output.
This means there is no long-run trade-off between inflation and unemployment.
Over time, expectations adjust, and workers incorporate inflation into wage demands, eliminating the short-run effects of demand shocks on unemployment.
As a result, attempts to lower unemployment below its natural rate using expansionary policy will only lead to higher inflation, not sustained lower unemployment.
Why is the unemployment rate not zero even when the economy is operating at its potential output?
There are three types of unemployment:
Cyclical unemployment: Due to fluctuations in the business cycle (e.g., recessions).
Frictional unemployment: Temporary unemployment as workers transition between jobs.
Structural unemployment: Mismatch between workers' skills and job requirements.
At potential output, cyclical unemployment is zero, but frictional and structural unemployment still exist.
This non-zero unemployment rate is called the natural rate of unemployment.
What are the implications of the vertical Long-Run Phillips Curve for economic policy?
Policymakers cannot permanently reduce unemployment below the natural rate through demand-side policies without causing accelerating inflation.
Expansionary policy may lower unemployment temporarily in the short run, but as inflation expectations adjust, unemployment returns to its natural level.
The long-run focus of policy should be on reducing structural and frictional unemployment through labor market reforms, education, and training—not just manipulating aggregate demand.
Why is there no trade-off between inflation and unemployment when output is at potential and prices/wages are flexible? (Long run Phillips curve)
When the economy is at potential output and prices and wages are fully flexible, there is no trade-off between inflation and unemployment.
People correctly anticipate inflation and adjust nominal wage growth to keep real wages constant.
This mirrors the reasoning behind the vertical Long-Run Aggregate Supply (LRAS) curve.
Since expectations are accurate and real wages are stable, employment and output remain unchanged regardless of the inflation rate.
How does unexpected inflation create a short-run trade-off between inflation and unemployment? (Phillips curve)
In the short run, if inflation is higher than expected (e.g., due to a positive aggregate demand shock), real wages fall because nominal wages haven’t adjusted yet.
Lower real wages encourage firms to hire more workers and increase output, reducing unemployment.
Thus, there exists a short-run trade-off: higher inflation leads to temporarily lower unemployment.
What happens when workers adjust their inflation expectations in response to rising inflation? (Phillips curve)
Once workers revise their inflation expectations upward, they demand higher nominal wages to maintain their real purchasing power.
As wages rise to match prices, real wages stabilize, and any gains in employment/output vanish.
The economy returns to its natural rate of unemployment, eliminating the short-run trade-off.
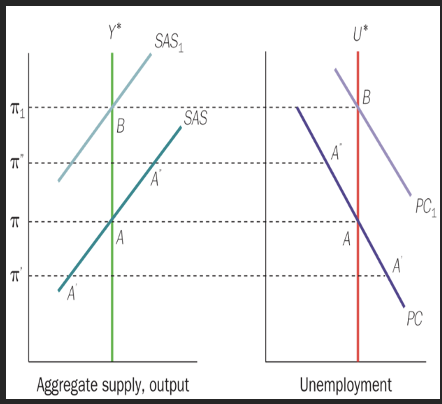
How do changes in inflation expectations affect both the short-run aggregate supply curve and the Phillips Curve?
A permanent rise in inflation expectations (from ⎍ to ⎍1) causes:
The Short-Run Aggregate Supply (SRAS) curve to shift upward (from SAS to SAS1).
The Short-Run Phillips Curve (SRPC) to shift upward (from PC to PC1).
This illustrates a key connection: changes in inflation expectations shift both curves, reinforcing that higher expected inflation leads to higher actual inflation without improving unemployment in the long run.
What determines how quickly the economy moves along the Phillips Curve?
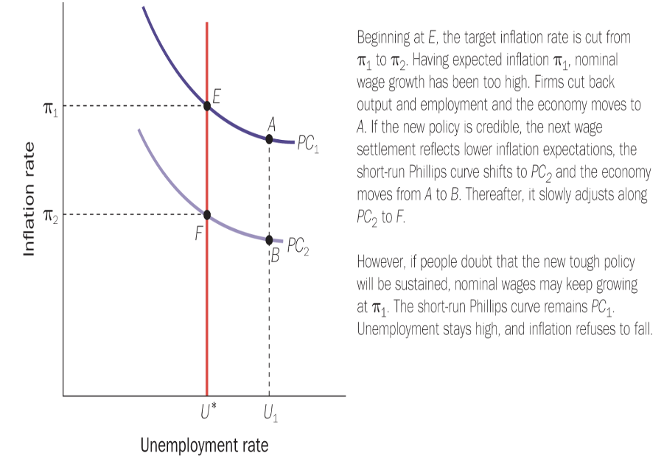
The speed of adjustment along the Phillips Curve depends on two key factors:
Wage and price flexibility:
The more flexible wages and prices are, the faster inflation expectations adjust, reducing the short-run trade-off.
Monetary policy response:
If the central bank responds quickly to demand shocks (e.g., by adjusting interest rates), the economy can stabilise inflation and output more rapidly.
E.G. If a country with high inflation adopts a lower inflation target, the central bank must tighten monetary policy (raise interest rates).
This may initially raise unemployment, but as inflation expectations fall, the economy can return to long-run equilibrium at lower inflation.
How do supply shocks affect the Phillips Curve, especially in the short and long run?
In the long run, the Phillips Curve is vertical at the natural rate of unemployment (U*).
However, the Long-Run Phillips Curve (LRPC) can shift if the natural rate of unemployment changes—for example, due to structural changes in the labor market.
Temporary negative supply shock (e.g., sudden rise in oil prices):
Short-Run Phillips Curve (SRPC) shifts upward.
Leads to stagflation:
Higher inflation
Higher unemployment
This happens even if the central bank maintains its inflation target.
Policy challenge: Central banks must decide whether to focus on stabilising inflation or minimising unemployment, as they can’t do both during a supply shock.
Why is the relationship between unemployment and inflation is weaker today?
Central bank credibility
Globalisation
Gig- economy/zero-hour contracts
What are the main economic costs of inflation, especially when it is high or volatile?
In a market economy, prices act as signals for resource allocation.
High or volatile inflation distorts these signals, making it harder for market participants to make informed decisions.
Money illusion may cause individuals to confuse nominal and real changes, leading to suboptimal choices in consumption and labor supply.
Unexpected inflation affects financial contracts:
If inflation is higher than expected, it benefits borrowers at the expense of lenders.
If inflation is lower than expected, it benefits lenders.
These uncertainties can discourage long-term lending and borrowing, reducing investment and growth.
Very high inflation (above 40%) or hyperinflation causes severe macroeconomic instability.
However, there is less consensus on whether moderate high inflation (e.g., in the 10–20% range) significantly harms the economy.
Does moderate inflation significantly harm economic performance?
In many moderate inflation episodes:
Money wages rose as fast or faster than prices, protecting real incomes.
There is little evidence of a strong negative correlation between moderate inflation and GDP growth.
Price signals may still function effectively.
However, public perception often differs:
Surveys show people often dislike high inflation as much or more than high unemployment, possibly due to uncertainty and reduced purchasing power.
While economists debate its economic damage, moderate inflation may still carry political and social costs.
What is an exchange rate, and how do changes in it affect trade?
The exchange rate (S) is defined as the domestic currency price of one unit of foreign currency.
Example: If we use GBP as the domestic currency, we express the exchange rate as 1 USD = 0.80 GBP.
An increase in S means it takes more domestic currency to buy one unit of foreign currency →
This is a depreciation of the home currency.
The foreign currency appreciates.
A decrease in S means it takes fewer units of domestic currency to buy foreign currency →
This is an appreciation of the home currency.
The foreign currency depreciates.
Trade Effects (other things equal):
Depreciation:
Makes exports cheaper for foreign buyers.
Makes imports more expensive for domestic consumers.
Appreciation:
Makes exports more expensive.
Makes imports cheaper.
What is the difference between a bilateral exchange rate and a trade-weighted (effective) exchange rate? Why does it matter?
A bilateral exchange rate is the price of one currency in terms of another.
Example: The bilateral rate between the UK and the US is the price of 1 USD in terms of GBP.
A trade-weighted (effective) exchange rate is a multilateral measure:
It is a weighted average of a country’s exchange rates with its major trading partners.
The weights reflect the proportion of trade with each partner.
Why the distinction matters:
The bilateral rate gives information about the relationship with one country only.
The effective exchange rate gives a broader view of how a country’s currency is performing overall in international trade.
It is more useful for assessing the overall competitiveness of a country's exports and imports.
Explain Spot vs Forward exchange rates
Spot vs Forward exchange rates: The exchange rates we discussed so far are “spot rates” – they involve the buying and selling of currency at the current time.
Forward exchange rates (or futures exchange rate) are contracts that commit two parties to exchange one currency for another at some future date at a pre-specified price.
What are bid and ask (offer) rates in foreign exchange markets, and what is the bid-ask spread?
The bid rate is the rate at which currency dealers buy currency A (and sell currency B).
The ask (or offer) rate is the rate at which dealers sell currency A (and buy currency B).
The bid-ask spread is the difference between the ask rate and the bid rate.
It represents a transaction cost or profit margin for currency dealers.
Most quoted exchange rates are midpoints between the bid and ask rates.
These quoted rates approximate the average of what it would cost to buy vs. sell a currency at a given time.
How does the demand and supply model determine exchange rates under a floating regime?
Demand for foreign exchange comes from:
Importers, who need foreign currency to pay for goods and services.
Outgoing foreign investment, as domestic investors purchase foreign assets.
Speculators, expecting future appreciation of the foreign currency.
Supply of foreign exchange comes from:
Exporters, who earn foreign currency from international sales.
Incoming foreign investment, as foreign investors purchase domestic assets.
Speculators, expecting depreciation of the foreign currency.
Why slopes matter:
The demand curve for foreign exchange is downward-sloping:
As the foreign currency becomes more expensive, demand for it falls.
The supply curve is upward-sloping:
As the foreign currency appreciates, more is supplied to the market.
The equilibrium exchange rate is where the demand and supply curves intersect.
Under a freely floating exchange rate, this intersection fully determines the exchange rate without central bank intervention.
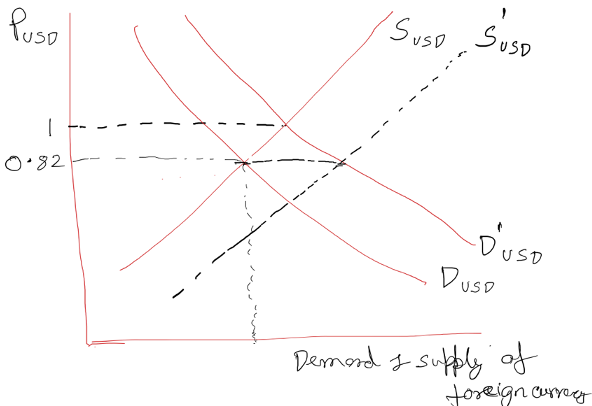
What happens in the foreign exchange market if the demand for foreign currency (e.g., USD) increases?
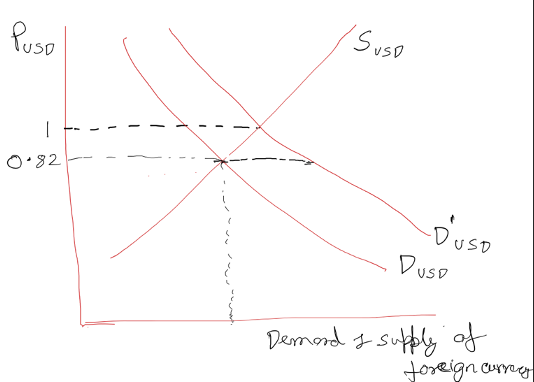
A rightward shift in the demand curve for USD means more dollars are demanded at every exchange rate.
Example cause: Rise in domestic income, leading to higher imports (which require USD).
At the current exchange rate (e.g., 1 USD = 0.82 GBP), this creates an:
Excess demand for USD
Excess supply of GBP
Result:
The USD appreciates
The GBP depreciates
A new equilibrium is reached at a higher exchange rate (e.g., 1 USD = 1 GBP).
The price of USD in GBP terms rises, reflecting the new market balance.
What’s the difference between fixed and flexible exchange rate regimes?
Flexible (floating) exchange rate: determined entirely by supply and demand in the foreign exchange market.
No central bank intervention.
If demand for USD rises, USD appreciates and GBP depreciates.
Fixed exchange rate: central bank intervenes to maintain a specific exchange rate (e.g., 1 USD = 0.82 GBP).
If demand for USD rises, the central bank sells USD and buys GBP to keep the rate fixed.