Enviornmental Science Midterm 1
1/61
There's no tags or description
Looks like no tags are added yet.
Name | Mastery | Learn | Test | Matching | Spaced |
|---|
No study sessions yet.
62 Terms
Independent and Dependent Variable
Independent Variable is the factor that is changed or controlled to test its effects on the Dependent Variable, which is typically plotted on the Y axis. The Dependent Variable is what is measured in the experiment and is affected by changes in the Independent Variable, which is usually displayed on the X axis.
Control Variable
A variable that is kept constant throughout an experiment to ensure that any changes in the Dependent Variable are solely due to the Independent Variable.
Types of Visualizations for Data Sets
Line Graph:
Data over periods of time
Choropleth:
Data from place to place
Pie Chart:
Data as A Percentage
1st step of scientific method
Observation
2nd step of scientific method
Question
3rd step of scientific method
Research
4th step of scientific method
Hypothesis (educated guess)
5th step of scientific method
Experimentation (testing the hypothesis)
6th step of scientific method
Data Analysis (Degenerate/ Noisy Relationships)
7th step of scientific method
Conclusion
Hydrograph
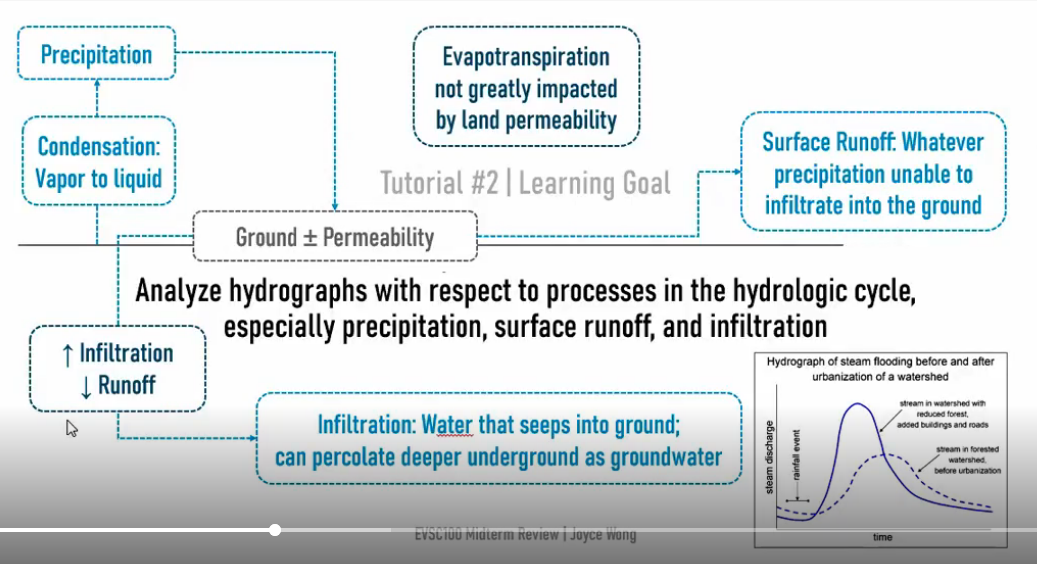
Apply the Scientific method to generate a hypothesis about enviornmental and human factors that influence flooding
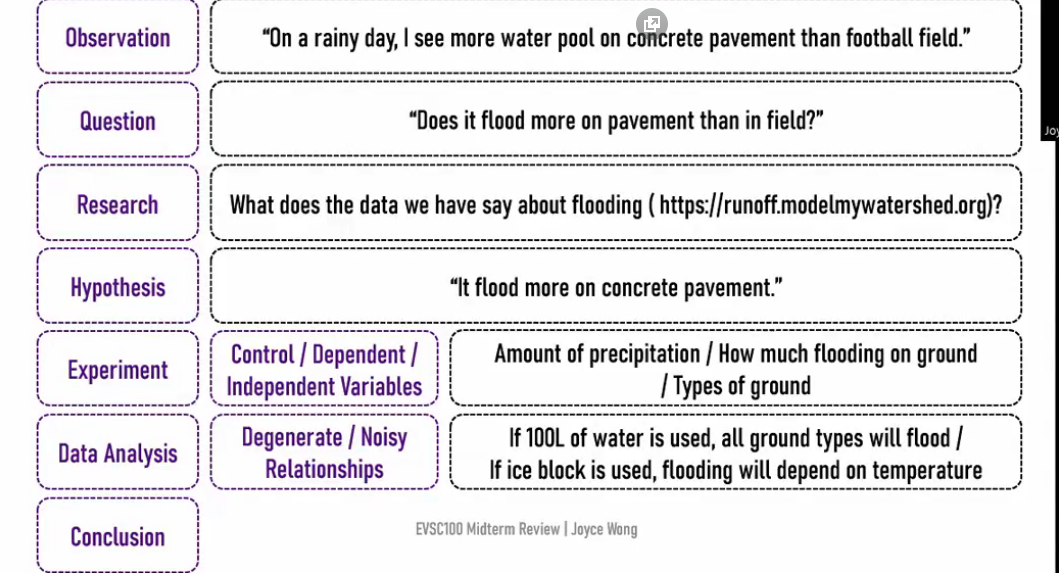
Degenerate Relationship
Multiple processes lead to one result
Noisy Relationship
One process lead to multiple results
Use data to evaluate support for multiple hypothesis
Pattern Recognizition (what is different in two graphs, etc)
Factors that lead to the dead zone in the Gulf of Mexico every summer
Pollution: River carrying agricultural run off into the gulf of mexico. (Lighter freshwater floats on top)
Eutrophication: Increased nutrients in water leading to algae bloom (Murky Water)
Light Deprivation, causing the death of Cyanobacteria
Bacteria that decompose algae consumes oxygen in the process
Hypoxia: Areas with low oxygen
Dead Zone Formation: Hypoxic regions unsuitable for survival, marine animals fled or dead.
Stratospheric change between 1979 and 2019
1979-1987:
Ozone cocentration decreased from 225 to 125DU
Ozone hole increased from 0 to 20 millionKm²
1988-2019:
Ozone cocentration stop decreasing at such a fast rate(early 1990s)
Why is ozone depletion most prevalent over Antartica in Southern Hemisphere Spring
CFC +UV RADIATION + COLD TEMPERATURE + SURFACE = Ozone Depletion
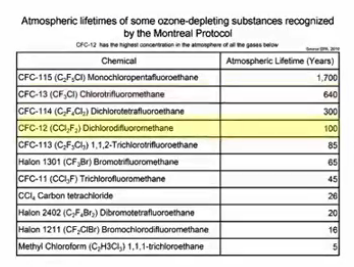
Impact of the Montreal Protocol on Ozone layer, and why it will take time before ozone concentration will return to pre CFC levels
Montreal Protocol slows Ozone depletion by banning CFCs
Graphical data related to Atmospheric CO2 Concentrations and average surface temperature trends
Evaluate evidence for long term and recent changes in Earth’s climate
Draw conclusions about trends in average surface temperature and their relationship to atmospheric CO2 concentrations
Keeling Graph
Increase CO2 = Increase Average Surface temperature
Long term: ~125ppm over 50,000 years
Recent: ~110 ppm over 70 years
albedo: ability of surfaces to reflect sunlight
Aerosols
Tiny solid and liquid particles suspended in the atmosphere
Highest aerosol concentration is in Central Africa and Arabian Peninsula in 2025 Jan.
aerosols have adverse effects on human health at a regional and global scale
Direct Effect of Aerosols
Scatters and reflect sunlight(high albedo)
Indirect effects of Aerosols
Influence cloud formation and properties
MODIS
Moderate Resolution Imaging Spectroradiometer
Measures the thickness and size distribution of atmospheric particulate matter to determine the amount of aerosols
Use Satellite imagery to visualize spatial and temporal patterns in Atmospheric aerosols
Describe the relationship between atmospheric CO and Aerosol concentration
Investigate possible sources of CO and aerosols
Flooding Events
When water overwhelms a landscape because more water is supplied than can be contained within a stream channel, or than can be removed by infiltration into the ground
Planetary Boundary
a "safe operating space" for humanity, beyond which abrupt or irreversible changes to the Earth system could occur
Crossing these boundaries creates the risk of destabilizing the Earth system.
Anthropocene
the time during which humans have had a substantial impact on our planet
the nine planetary boundaries
Climate change
Biodiversity loss
Biogeochemical flows
Land-system change
Freshwater use
Ocean acidification
Stratospheric ozone depletion
Atmospheric aerosol loading
Release of novel chemicals
Quadruple Squeeze
Population and development: The number of people and their affluence
Climate change: The concentration of greenhouse gases and the inability of the Earth to buffer their effects
Ecosystem crisis: The risk of tipping points in the Earth system
Surprise: The unpredictability of how systems can tip over rapidly and irreversibly
resilience
the ability of a system to maintain key functions and processes in the face of stresses or pressures, by resisting and then adapting to change.
tipping points
thresholds beyond which they cannot recover
% of Earth’s water that is freshwater, and the % of freshwater that is easily accessible for human use.
97.2% ocean water, 2.8% fresh water
Metro Vancouver Water Supply
Capilano, Seymour, and Coquitlam watersheds
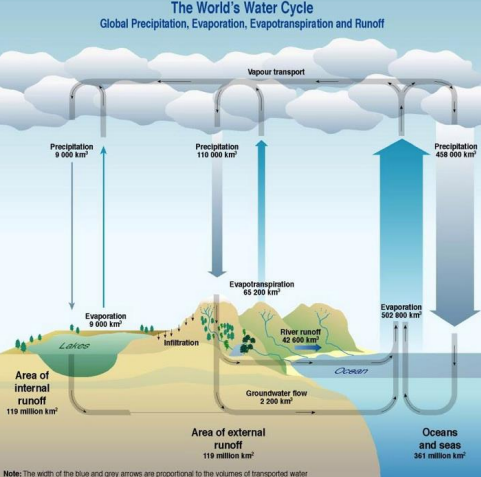
flows or fluxes
Water moves between stores through various processes
hydrologic cycle
Freshwater: Groundwater
Water beneath Earth’s surface, stored in aquifers: geologic formations that contain pore spaces in soil and fractures in bedrock. Only accessible by drilling/pumping from a well.
Freshwater: Surface Water
snow and land ice (glaciers, ice sheets, ice caps) lakes, ponds, wetlands, rivers, streams
Watershed
an area of land where all the water that falls into it and drains off of it goes to a common outlet
Global Freshwater Resources: Why is there a Planetary Boundary
Freshwater is being consumed by human activities at a pace that is faster than it can be replenished
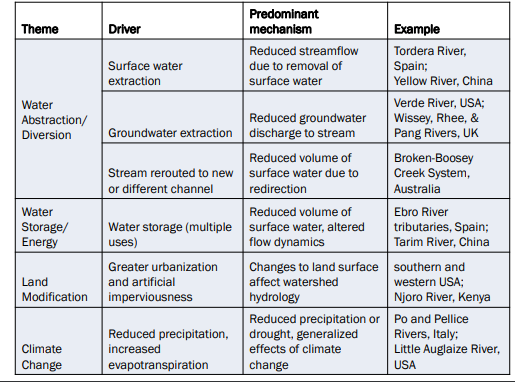
Ways Humans Cause Water to Stop Flowing (Partly or Completely)
Earth System Functions of Water
Hydroclimatic Regulation – Water flows regulate the Earth's climate system
2. Hydroecological Regulation – Water enables and connects life on land and in aquatic ecosystems, and creates and sustains the ecosystems that human societies and Earth system stability depend on
3. Storage – Freshwater storage in groundwater, lakes, wetlands, reservoirs, and frozen water interacts with the Earth system as a control over sea level
4. Transport – Water fluxes are fundamental for moving, displacing, and diluting sediment and dissolved nutrients on the surface or within soils
the Nitrogen cycle
Fixation
Storage
Accumulation
Recycling
Phosphorus Cycle
Phosphates move slowly through the soil and ocean; one of the slowest biogeochemical cycles
How does the biosphere function? Through which two fundamental processes
Energy flow and Nutrient/ Biogeochemical cycling
Atmosphere Structure
We live in the troposphere, which starts at the surface of the Earth and can extend up to 20 km.
The next layer is the stratosphere, which is the section found between 20 km and 50 km above the Earth’s surface.
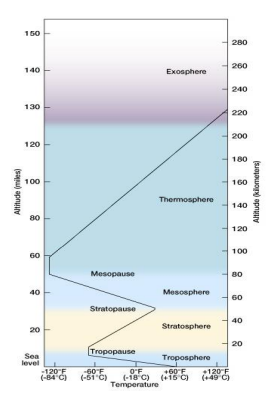
Where is the Ozone Layer?
Approximately 90% of the ozone in the atmosphere is found in the stratosphere. The peak ozone concentration occurs between 30 and 35 kilometers above the Earth’s surface
How is Ozone (O3 ) created?
Ozone is formed when high energy ultraviolet radiation from the sun breaks apart molecular oxygen
An oxygen atom then combines with an oxygen molecule producing a new molecule with three atoms of oxygen: ozone.
Role of Ozone in the Atmosphere
When the ozone layer is intact, it absorbs 50% of the UV-A radiation, 90% of the UV-B radiation, and all of the UV-C radiation coming from the sun.
Why is ozone disappearing?
CFCS, when the normally stable CFC’s hit the lower temperatures and higher amounts of UV radiation in the stratosphere could break them down – and that once they were broken down, they could attack and destroy ozone molecules.
Canada and CFCs
Canada banned CFCs in most aerosol products in the late 1970s.
WEATHER vs. CLIMATE
Weather describes short-term atmospheric conditions
Climate is the long-term average of weather conditions in a region, over time
The Global Carbon Cycle
Biosphere • Carbon is found in the form of organic compounds trapped in living organisms.
• Lithosphere • Carbon is held in the soil, in carbonate rocks, and other materials like coal.
• Hydrosphere • Carbon dissolves in the water to form carbonic acid
• Atmosphere • Carbon is mostly in the form of CO2 (carbon dioxide) and CH4 (methane)
• Cryosphere • Carbon is stored in permafrost (frozen soil), and as CO2 and in CH4 gasin bubbles in ice
1 Pg
10^15 grams
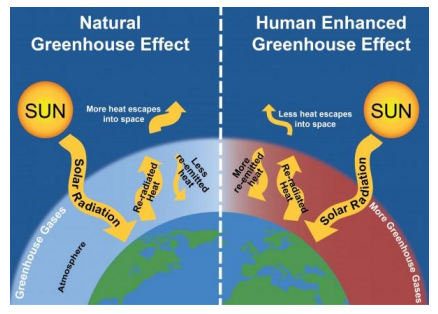
Greenhouse effect
Warms Earth’s surface
What do greenhouse gases do?
GHGs are molecules that absorb and emit radiation at wavelengths that overlap with some of the wavelengths of radiation emitted by Earth
Evidence for a changing climate
• Warming air temperatures
Warming ocean temperatures
• Shrinking glaciers and sea ice
• And subsequent rises in sea level
• Changes in the biosphere
How can we reduce greenhouse gas emissions
Conservation: Use less energy (e.g., fly less, drive less, eat less red meat, etc.) Efficiency: Use technologies that get the most from an energy source (e.g., Energy Star appliances, LED bulbs) VOTE!: Use the ballot box and your dollars to let politicians and corporations know reducing GHG matters to you and to push for systemic change – the only real solution Systemic Change: Energy Sources: Convert our energy sources to non-fossil fuel burning solutions – simply put, the only solution to this problem is that we have to reduce GHGs now
3 ways nitrogen can be fixed
Atmospheric
Biological
Industrial
Fossil fuels
Slow carbon
AOD
Aerosol optical thickness
Effects of Aerosols on human health
Lung cancer, cardiopulmonary disease, respirator infections, etc