Required practical 5 - Determination of resistivity of a wire using a micrometer, ammeter and voltmeter
1/10
There's no tags or description
Looks like no tags are added yet.
Name | Mastery | Learn | Test | Matching | Spaced | Call with Kai |
|---|
No analytics yet
Send a link to your students to track their progress
11 Terms
Apparatus and Equipment
1m long constantan wire
Voltmeter
Ammeter
Low voltage power supply
Micrometer
Metre ruler
Step 1 of the experiment
Measure the diameter d of the constantan wire at various points along it using the micrometer and find and record the mean diameter.
Step 2 of the experiment
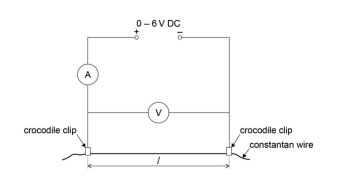
Set up the apparatus as shown in the diagram.
Step 3 of the experiment
Adjust the length l to 0.100m using the crocodile clips, measured using the metre ruler
Step 4 of the experiment
Read and record the current I on the ammeter and the voltage V on the voltmeter. Calculate the resistance R by using R=V/I and record this
Step 5 of the experiment
Increase l by 0.100m and repeat this, increasing it by 0.100m each time up to 0.800m
Step 6 of the experiment
Repeat the experiment twice more and find and record the mean R for each l
Graphs and calculations
Calculate the cross-sectional area of the wire (A) → A = πd²/4
Plot a graph of the mean value of R against l and draw a line of best fit. The resistivity will be the gradient multiplied by the cross-sectional area of the wire
ρ = RA/L => GA where G is the gradient
Safety
Disconnect the crocodile clips in between measurements to avoid the wire heating up and causing burns if touched. If the current rises too high, reduce the voltage using the variable power supply.
If the wire is tight, safety goggles should be worn in case it snaps and injures eyes.
Improvements and notes
The wire heating up might additionally cause the resistance of the wire to change, affecting measurements. To reduce this, disconnect it in between measurements or reduce the voltage of the supply so the current is lower
The wire should be free from kinks and held straight so the measurement of the length is as accurate as possible.