T-tests
1/18
Earn XP
Description and Tags
Name | Mastery | Learn | Test | Matching | Spaced |
|---|
No study sessions yet.
19 Terms
The T-test is used to
compare 2 means
For one sample compared to a population use
One sample t-test
One sample t-test
Compare the blood pressure of one group to a theoretical or published value
For two sample groups use
Unpaired t-test
Paired t-test
Unpaired t-test
comparing two independent, but similar groups
aka Student’s t-test
Compare the blood pressure of two groups of similar individuals (adult men’s bp vs. adult women’s bp)
Paired t-test
comparing the a group before an intervention to the same group after an intervention
Compare the blood pressure of a group before and then after climbing ten flights of stairs
T-test Assumptions
1.Normal/Gaussian distribution
2.Randomly sampled
3.Equal variances (see below)
4 Data measured on interval or ratio scale ^
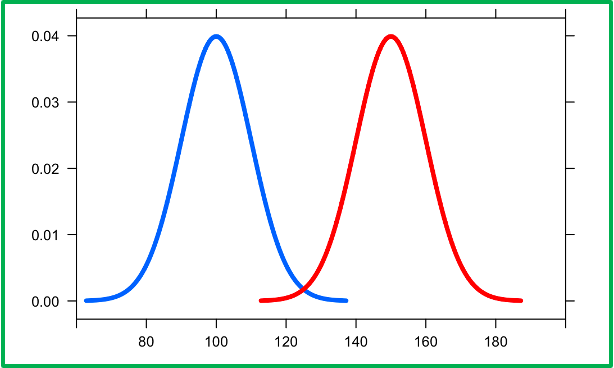
Normal Distribution with equal variances

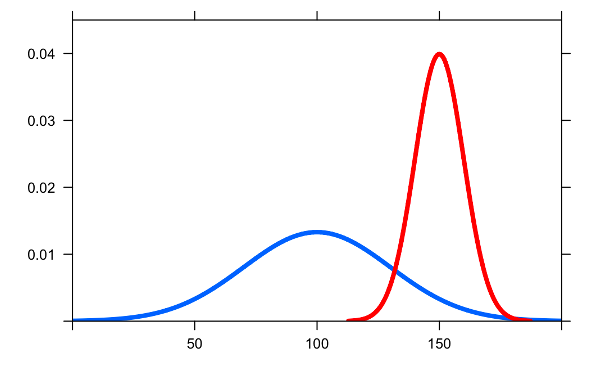
Normal Distribution with different variances

Comparing Means
•Comparing the average and how widely spread it is
•Statistical significance for comparing means is based on the relationship between mean and the variance
effect size
•difference between group means indicating a degree of separation between them
Variance measures tell us how variable scores are
within each group
One-Tailed Test
•A directional hypothesis might call for a one-tailed test
•In order to use a one-tailed test, there must be a specific reason why you would only expect a difference in one direction
•The entire rejection (critical) region (5% in this case) is on one side of the distribution
One tailed tests are used when there is a ___ hypothesis
directional
Two-Tailed Test 2 possible outcomes
If there is a possibility that the difference could be in either direction, use two-tailed test, even if your hypothesis is directional
2 tailed tests are __ conservative than one tailed
More
For 2 tailed tests, the rejection (critical) region (5% in this case) is X__ between both tails of the distribution
split. 2.5% probability a result will fall in either critical region
unpaired t tests need
1.Two normally distributed but independent populations
2.Two sample means
3.Two sample standard deviations
4.Both sample sizes (n)
5.Table of critical t-values or a stats program
A t-test is significant if
The p-value is less than 0.05 (alpha)
and
The absolute value of the t-statistic is greater than the critical value (always use in absolute values, take away neg signs)