Chapters 1 - 3 of Supply Chain Management
1/106
There's no tags or description
Looks like no tags are added yet.
Name | Mastery | Learn | Test | Matching | Spaced | Call with Kai | Chat |
|---|
No analytics yet
Send a link to your students to track their progress
107 Terms
Supply Chain
includes the raw material and parts of a product that distributed through a chain for manufacturing and sales
Structure of Supply Chain
Suppliers, Manufacturers, to Customers
Products and Services are created by
materials
equipment
labor
time
money
resources
Three Links in Supply Chain
the three links in supply chain are
Suppliers
Manufacturers
Customers
every link in the supply chain is
Both a customer of the suppliers and a supplier to their customers
Supply Chain Flow
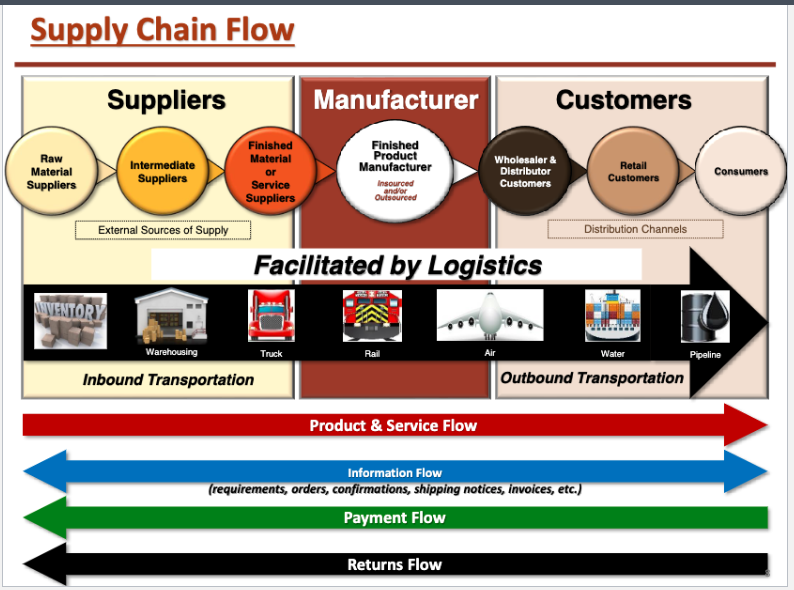
Tiers in Supply Chain
Tier 1 is direct, the lower the tier number, the more indirect it becomes
Supply Chain Management
the coordination of the network of otherwise independent trading partners who are creating a desired product or service, and then moving it through the supply chain out to customers
represents the active management of all supply chain activities to maximize customer value and achieve a sustainable competitive advantage.
Goals of Supply Chain
Increase Customer Service while simultaneously Reducing Inventory and Operating Expenses
Services in Supply Chain
Facilitating Goods are necessary
SCOR (Supply Chain Operations Reference)
a process reference model as the standard diagnostic tool for supply chain management
helps businesses evaluate and perfect supply chain management for reliability, consistency, and efficiency.
Four Major Components in SCOR
Performance
Processes
Practices
People
5 SCOR Performance Attributes
Reliability
Responsiveness
Agility
Cost
Asset Mangement
What do each trading partner have to do>
Plan
Source
Make
Deliver (Return)
Planning
establishes the parameters within which the supply chain will operate.
Companies need a strategy when it comes to managing the resources necessary to address how a product or services. Resources = Capacity, people, and money
Planning Includes: Marketing and Distribution Channels
Sourcing
the process of identifying the suppliers that provide the materials and services needed for the supply chain to deliver the final product
Making
the series of operations performed to convert raw materials and components into finished products
A finished product has to be
Tested
Packaged
Scheduled
Quality Management
Quality Levels
Production Output
Worker Productivity
Delivering
this is known as logistics phase; oversees the planning and execution of the forward flow of goods and related information to meet customer requirements
Return
this is known as the reverse logistics. the part of supply chain management that deals with moving goods back to the point of origin
Enabling
facilitates a company’s ability to manage the supply chain and spread throughout every stage.
Foundations of Supply Chain Management
Operations Management: managing internal resources
Supply Chain Management: managing all of the supplies and suppliers that are needed to run the business
Logistics Management: managing all the movement and storage of products and materials within the supply chain.
Integration: managing all of the enabling systems
Elements of Operations Management
Forecasting & Demand Planning
Planning Systems
Inventory Managment
Manufacturing / Process Management
Forecasting & Demand Planning
forecasting the demand of a product or service so it can be delivered efficiently and satisfy customer needs
Planning Systems
the process of tools used to manage a company’s resources
Inventory Management
techniques used to plan and control the desired levels of items needed to support production
Manufacturing / Process Management
using LEAN Manufacturing to improve the flow of materials / waste. using Six Sigma to improve quality compliance
Elements of Supply Management
Purchasing
Strategic Planning
Supplier Relationship Management
Elements of Logistics Management
Warehousing
Distribution
Transportation
International Trade Management
Customer Relationship Management
Service Response Logistics
Integration Elements
Enabling Systems
Supply Chain Risk and Security Management
Performance Measurement
Project Management
Supply Chain Capability Models
Efficient Model (Supply Push)
Responsive Model (Demand Pull)
Efficient Model (supply push)
produce
a large amount of product
ASAP
lowest possible cost
Supply Push Business Model
Make to Stock
Responsive Model (Demand Pull)
configured to be
fast and flexible
respond quickly to dynamic market demand
Demand Pull Business
Make to Order
Demand Driven Supply Chain
Demand drives all the remaining supply chain activities
Supply - Driven Supply Chain
Supply Drives all the remaining supply chain activities
Examples of Supply - Driven Supply Chain
crude oil
natural gas
bananas
steel, copper, aluminum
two essential building blocks for supply chain planning activities
forecasting
demand planning
Forecasting
an estimate of future demand of products and is developed through data analysis and judgement
Demand Planning
the process of forecasting the demand for a product or service so it can be produced and delivered more efficiently and to the satisfaction of customers
Two Different Demands
Independent Demand: Demand for a finished good
Dependent Demand: Demand for a component
Forecasting Horizon
Short Term: less than three months; mainly used for tactical decisions like purchasing and production schedule
Medium Term: three months to two years
Long Term: greater than 2 years
Considerations of Forecasting
it is inaccurate
basis for most “downstream” supply chain planning decisions
Two Forecasting Techniques
Qualitative: based on opinion
Quantitative: based on math and data
Qualitative
used when there is data is limited, unavailable, or not currently relevant
best for long range forecasts
depends on skill
five qualitative techniques
personal insight
jury of executive opinion
Delphi Method
Historical Analogy
Customer Survey
Personal Insight
the forecast is based on the insight of the most experienced, most knowledgeable, or most senior person available.
Jury of Executive Opinion
people who know the most about the product and the marketplace would form a management panel to discuss and determine the forecast.
Delphi Method
collecting opinions and feedback from experts anonymously
Historical Analogy
based on the identifying a sales history that is comparable to a present situation, such as the sales history of a similar product
Customer Survey
customers are directly approached and asked to give their opinion about a particular product
Quantitative Forecasting Techniques
TIME SERIES
Naive Forecasting
Simple Moving Average
Weighted Moving Average
Exponential Smoothing
Linear Trend
CAUSE AND EFFECT
Simple Regression
Multiple Regression
Time Series
to collect and study the past data of a given time series in order to generate probable future values for the series
Naive Forecasting
sets the demand for the next time period to be exactly the same as the demand in the last period.
Simple Moving Average Forecasting
gets the average of sales.
Weighted Moving Average
gets the average of sales but not al time periods are valued similarly.
Formula for Weighted Moving Average
(M1 x W1)+(M2 x W2)+(M3 x W3)+(M4 x W4)+(M5 x W5)+(M6 x W6)
Exponential Smoothing
more sophisticated version of weighted moving average that includes
actual demand
last periods forecast
smoothing factor (between 0 and 1)
Formula for Exponential Smoothing
(Actual x Smoothing) + (Forecast ( 1 - Smoothing )
Linear Trend Forecasting
imposes a best fit line across demand data of an entire time series
Cause and Effect Forecasting
assumes there are one or more factors that predict future demand
Simple Linear Regression
attempts to model the relationship between a single independent variable and a dependent variable (demand) by fitting a linear equation to the observed data.
Multiple Linear Regression
attempts to model the relationship between two or more independent variables and a dependent variable (demand) by fitting a linear equation to the observed data
Fundamentals of Forecasting
Your Forecast is most likely wrong
the more “granular” the forecast, the less accurate it is
it is easier to forecast next month more accurately than it is to forecast next year
Simple Forecast Methods Trumps Complex Ones
A correct forecast does not prove your forecast method is
correct
If you don’t use the data regularly, trust it less when forecasting
All trends will eventually end
Forecasts are Bias
Technology is not a solution for better forecasting
Forecasting is an art and science
Optimal Demand Planning Requires
comprehensive modeling capabilities
the flexibility to shift methods as product life cycles progress and market conditions change
Forecast Error Value and Percentage
Forecast Error Value: A - F
Forecast Error % : (A-F) / A x 100
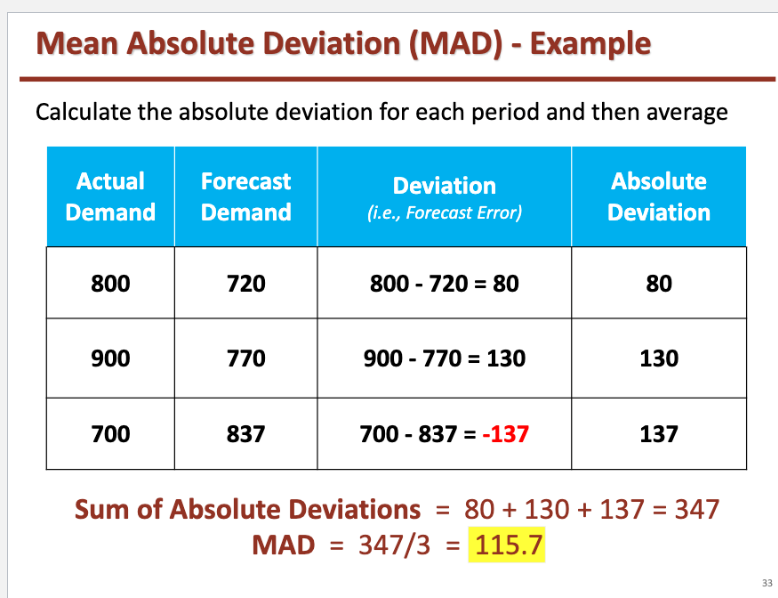
MAD (Mean Absolute Deviation)
size of the forecast error in units
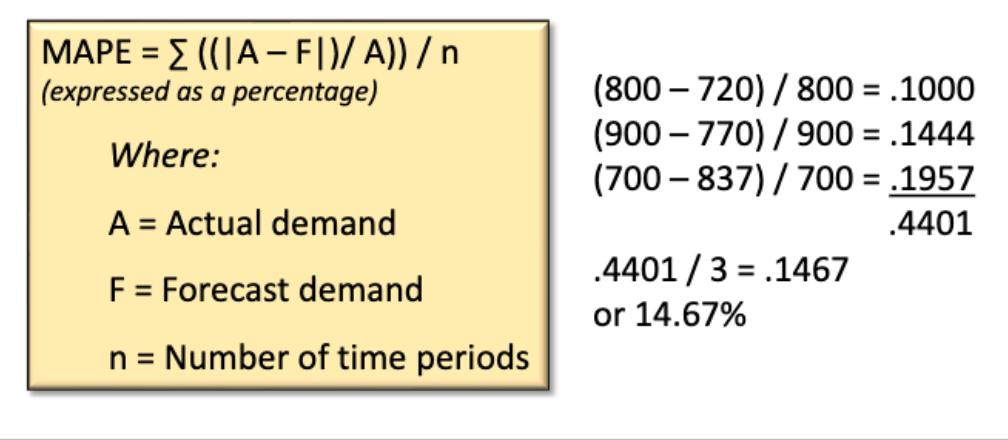
MAPE: Mean Absolute Percent Error
measures the size of the error in percentage terms. It is calculated as the average of the unsigned percentage error.
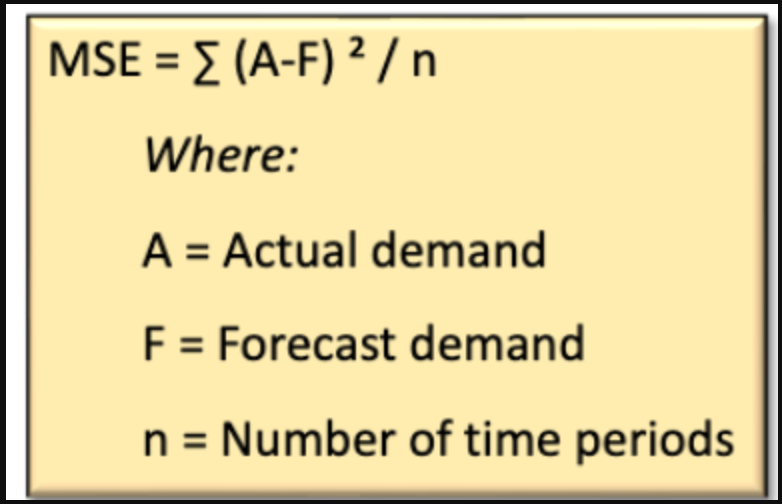
Measures of Forecasting Accuracy (MSE)
magnifies the errors by squaring each
one before adding them up and dividing by the number of forecast
periods.
Forecast Bias
∑ Forecast Error = ∑ Actual Demand – ∑ Forecast Demand
Running Sum of Forecast Errors
RSFE = ∑ et
Where: et = forecast error for period t
Tracking Signal
Running Sum of Forecast Errors / Mean Absolute Deviation
Bullwhip Effect
occurs when small fluctuations in retail demand cause fluctuations in wholesale, distributor and manufacturer demand, resulting in inefficiency and disorganization throughout the supply chain.
How Can the Bullwhip Effect be Alleviated?
Collaboration
Synchronizing the supply chain
Reducing Inventory
Collaborative Planning, Forecasting, and Replenishment (CPFR)
a business practice that combines the intelligence of multiple trading partners who share their plans, forecasts, and delivery schedules with one another in an effort to ensure a smooth flow of goods and services across a supply chain
Supply Chain Planning
the function within SCM that is responsible for determining how best to satisfy the requirements created by a Demand Plan
its objective is to Balance Supply Chain and Demand that benefits the company financially and objectively
Supply Chain Hierarchy
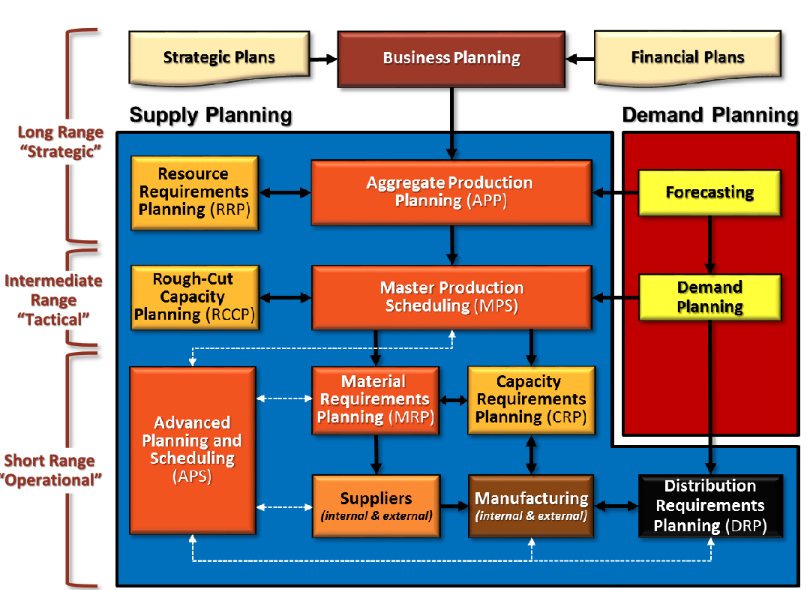
Supply Chain Levels and Horizons
Long Range: involves planning actions for construction, major equipment purchase
Intermediate Range: shows the quantity and timing of end items to be produced in 3- 18 months
Short Range: detailed planning process of components and parts in 1 - 3 months
Planning Responsibilities and Tasks
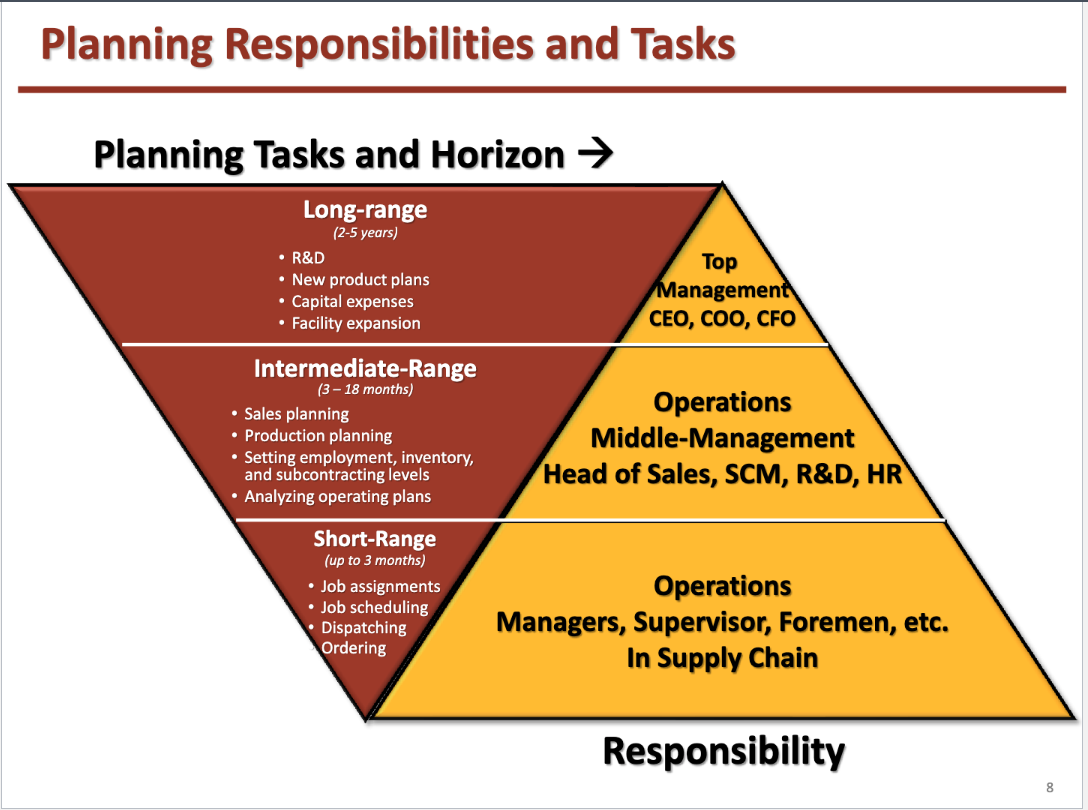
Business Planning
provides the companies direction and business goals for the next one to five years.
Whats in a Business Plan
Executive Summary
Business Description
Market Analysis
Products and Services
Marketing Plan
Logistics and Operations Plan
Financial Plan
Aggregate Production Plan (APP)
a planning process that translate annual business plans, marketing plans, and demand forecasts into a production plan for a product family in a plant or facility.
Steps to Develop the Aggregate Production Plan
Determine the demand for each period
Determine the capacity
Identify any constraints
Determine the direct labor and material costs and indirect manufacturing costs
identify and develop strategies and contingency plans
agree on plan
Aggregate Planning - Purpose and Goals
establish production rates that will achieve goals by maintaining, raising, lowering inventories, while keeping workforce relatively stable
Aggregate Production Planning (APP) Strategies
DEMAND ADJUSTMENTS
Influencing Demand
Backordering
Counter Seasonal Product Mixing
SUPPLY ADJUSTMENTS
change inventory levels
change capacity
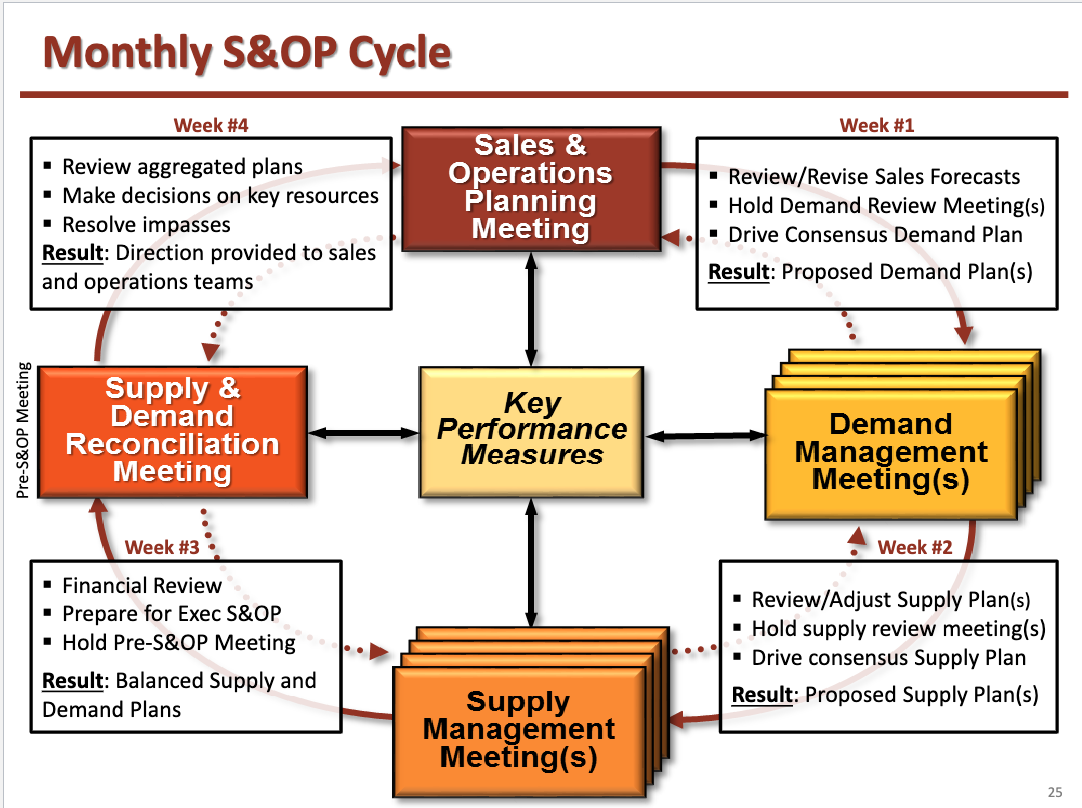
Sales & Operations Planning (S&OP)
A process to develop tactical plans that provides management the ability to strategically direct the business to achieve a competitive advantage on a continuous basis by integrating customer-focused marketing plans for new and existing products with the management of the supply chain
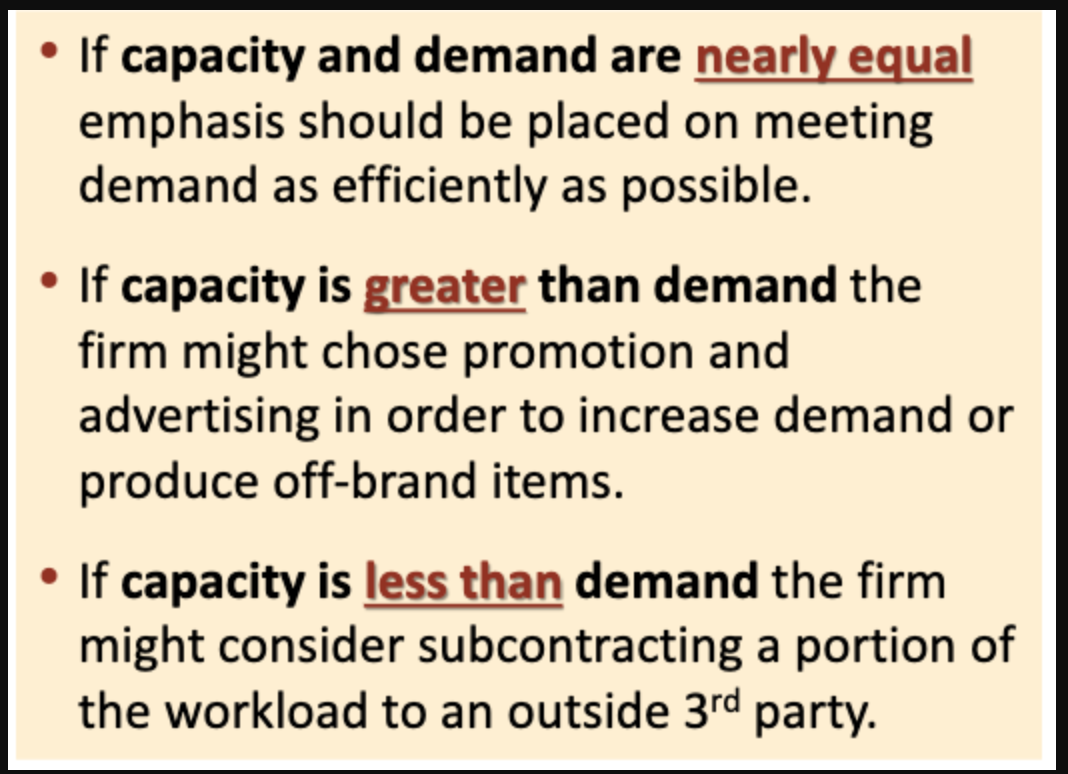
If capacity and demand are…
Monthly S&OP Cycle
Master Production Scheduling (MPS)
represents what the company plans to produce expressed.
it is a statement of production and not a statement of demand
MPS planning horizon is typically 3 to 18 months
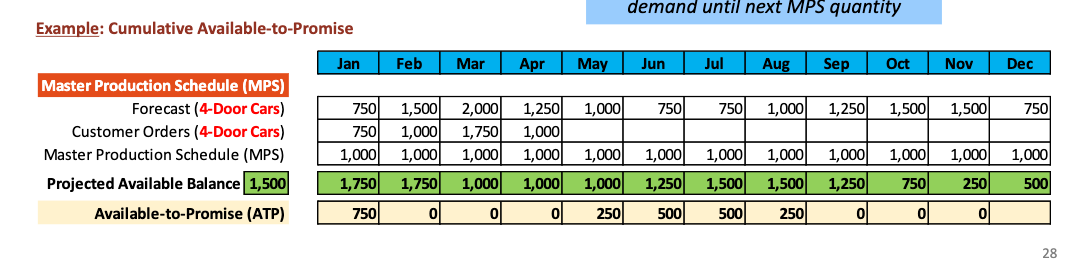
Available to Promise (ATP)
A calculation to provide a response to customer order inquiries, based on product availability
It represents the uncommitted portion of a company’s projected available
inventory to support customer order promising
Time Fencing
Firmed Time Period: from current date out several weeks into future
Planned Time Period: the end of the firmed time period to the end of the planning horizon
Basic Production Strategies
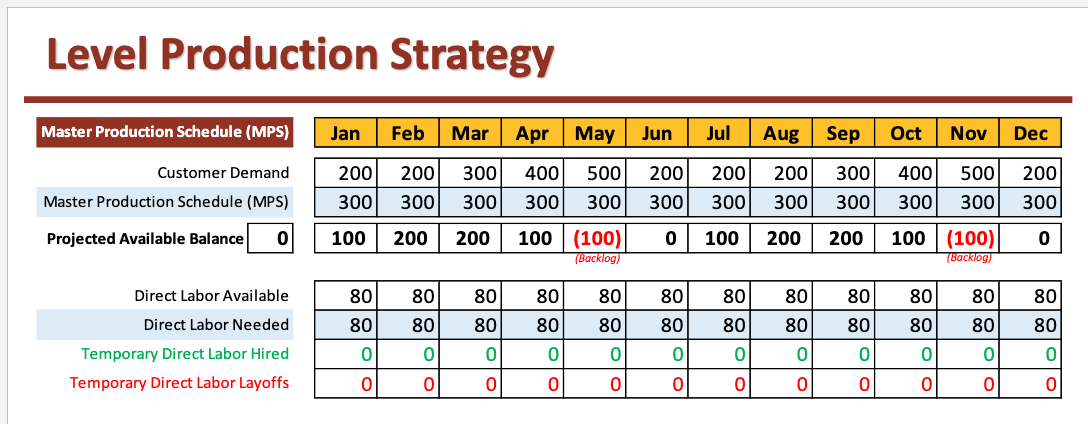
Level Production Strategy
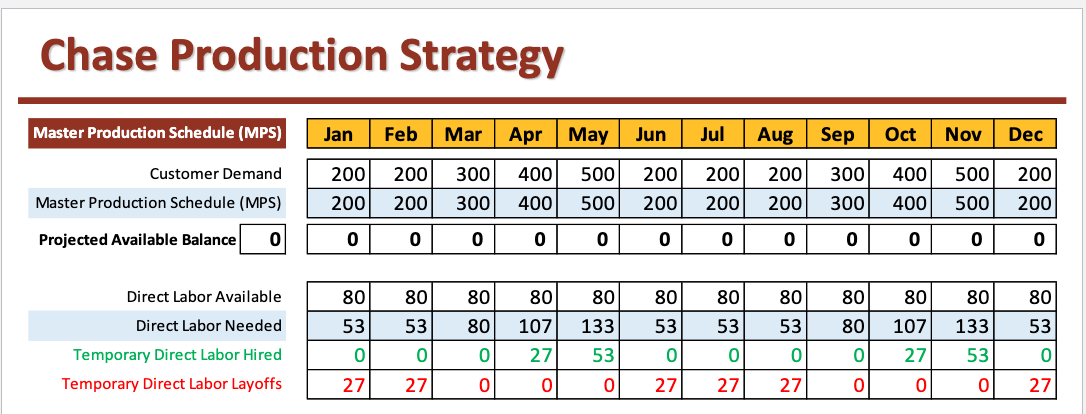
Chase Production Strategy
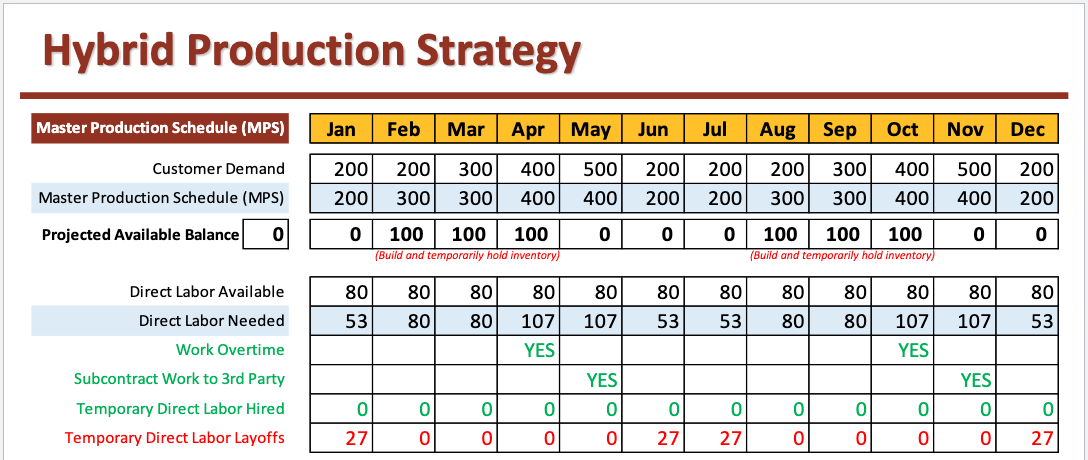
Hybrid Production Strategy
Level Production Strategy
Maintains a constant production rate and allows inventory and backlog to vary according to fluctuating demand
works well with make to stock items
Chase Production Strategy
Adjusts the production rate and capacity to exactly match demand
works well with make to order (mto) items
Hybrid Production Strategy
Sets a baseline production rate based on a stable core workforce, and then uses other short-term means, such as overtime, subcontracting and part-time labor to manage short- term fluctuations in demand.
Material Requirements Planning (MRP)
A computer-based materials management tool that calculates the exact quantities, need dates, and planned order releases for all the component parts and materials required to manufacture a product.
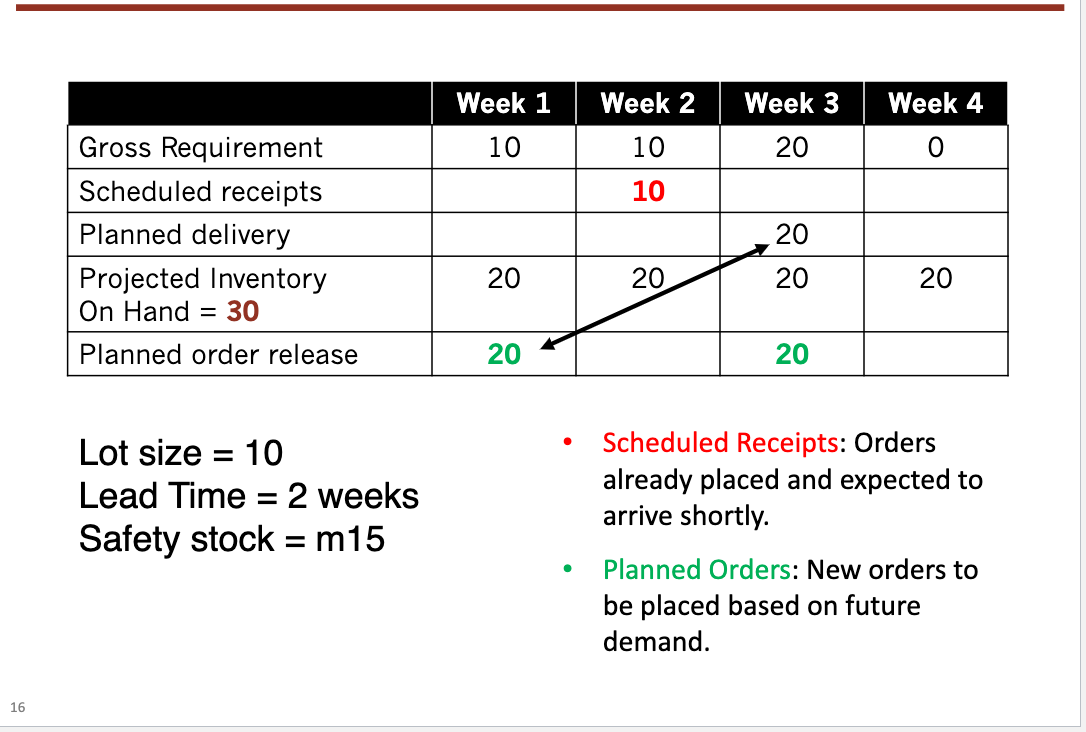
MRP requires
Finished Master Production Schedule
Bill of Materials
Item master data for each component
Inventory status of components / materials
planned or scheduled receipts for any of the components and materials needed
Bill of Material (BOM)
An inclusive list of all raw materials, component parts, and sub-assemblies making up the final product (finished good)