carina ad/as
1/76
There's no tags or description
Looks like no tags are added yet.
Name | Mastery | Learn | Test | Matching | Spaced |
|---|
No study sessions yet.
77 Terms
the total quantity of output (real GDP) that all buyers in the economy want to buy at different price levels, ceteris paribus
Aggregate demand (AD)
Households (C), Firms (I), Government (G), Export revenue (X) - Import expenditures (M); Xn
What does AD consist of? (4)
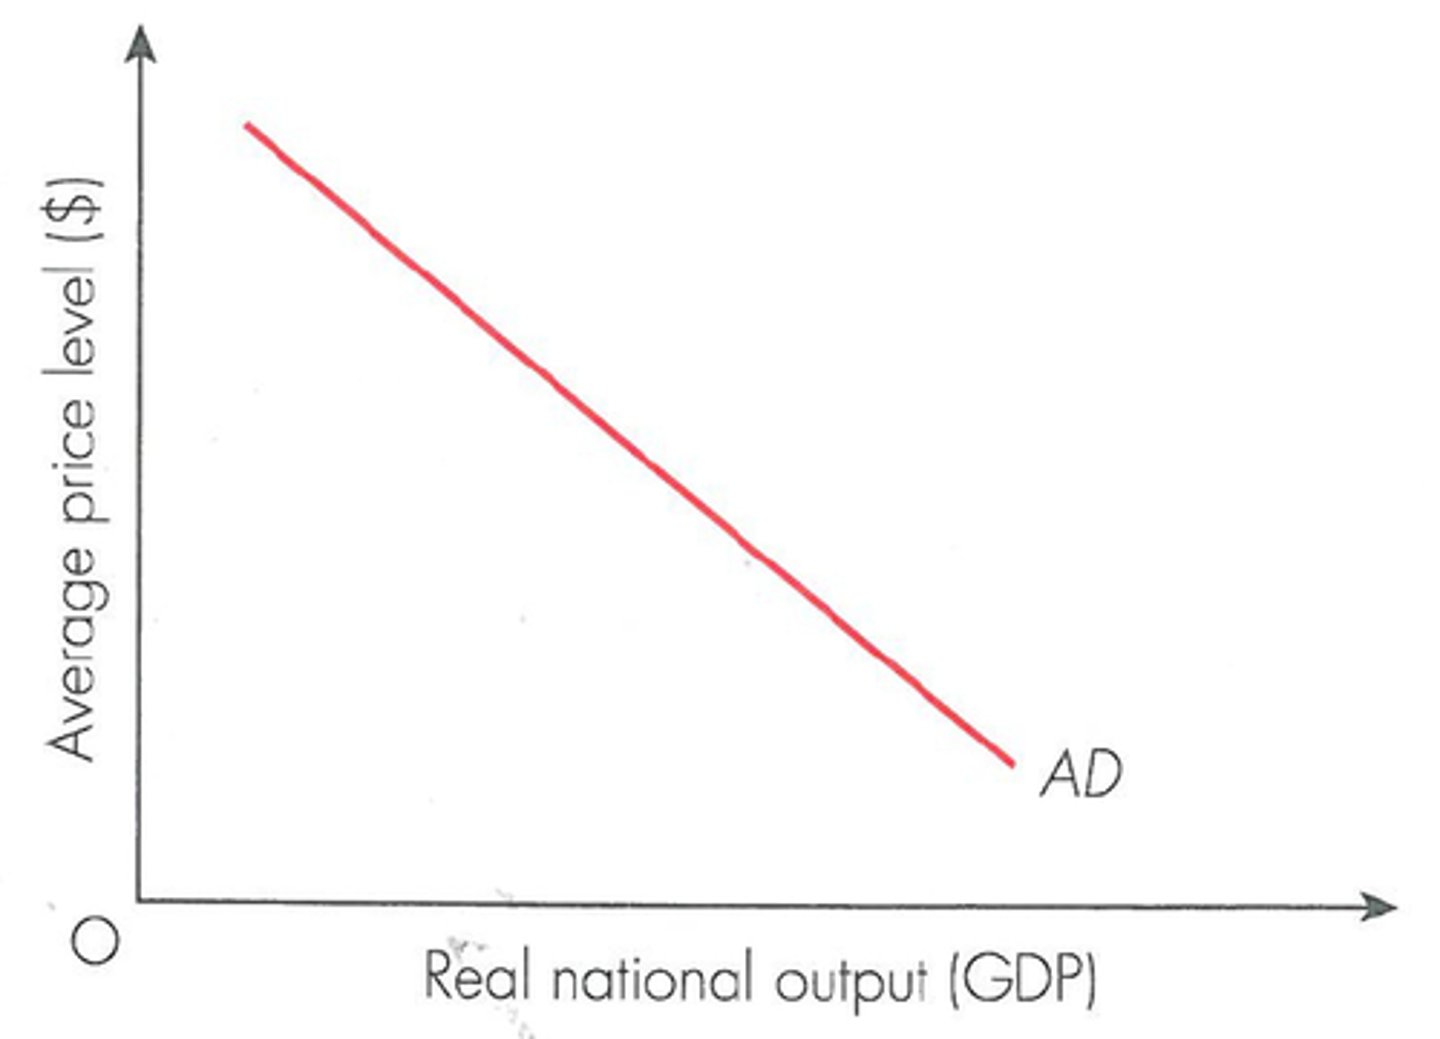
the relationship between the total amount of real output demanded by the four components and the economy's price level over a particular time period. It is downward-sloping indicating a negative relationship
What does the aggregate demand curve show?
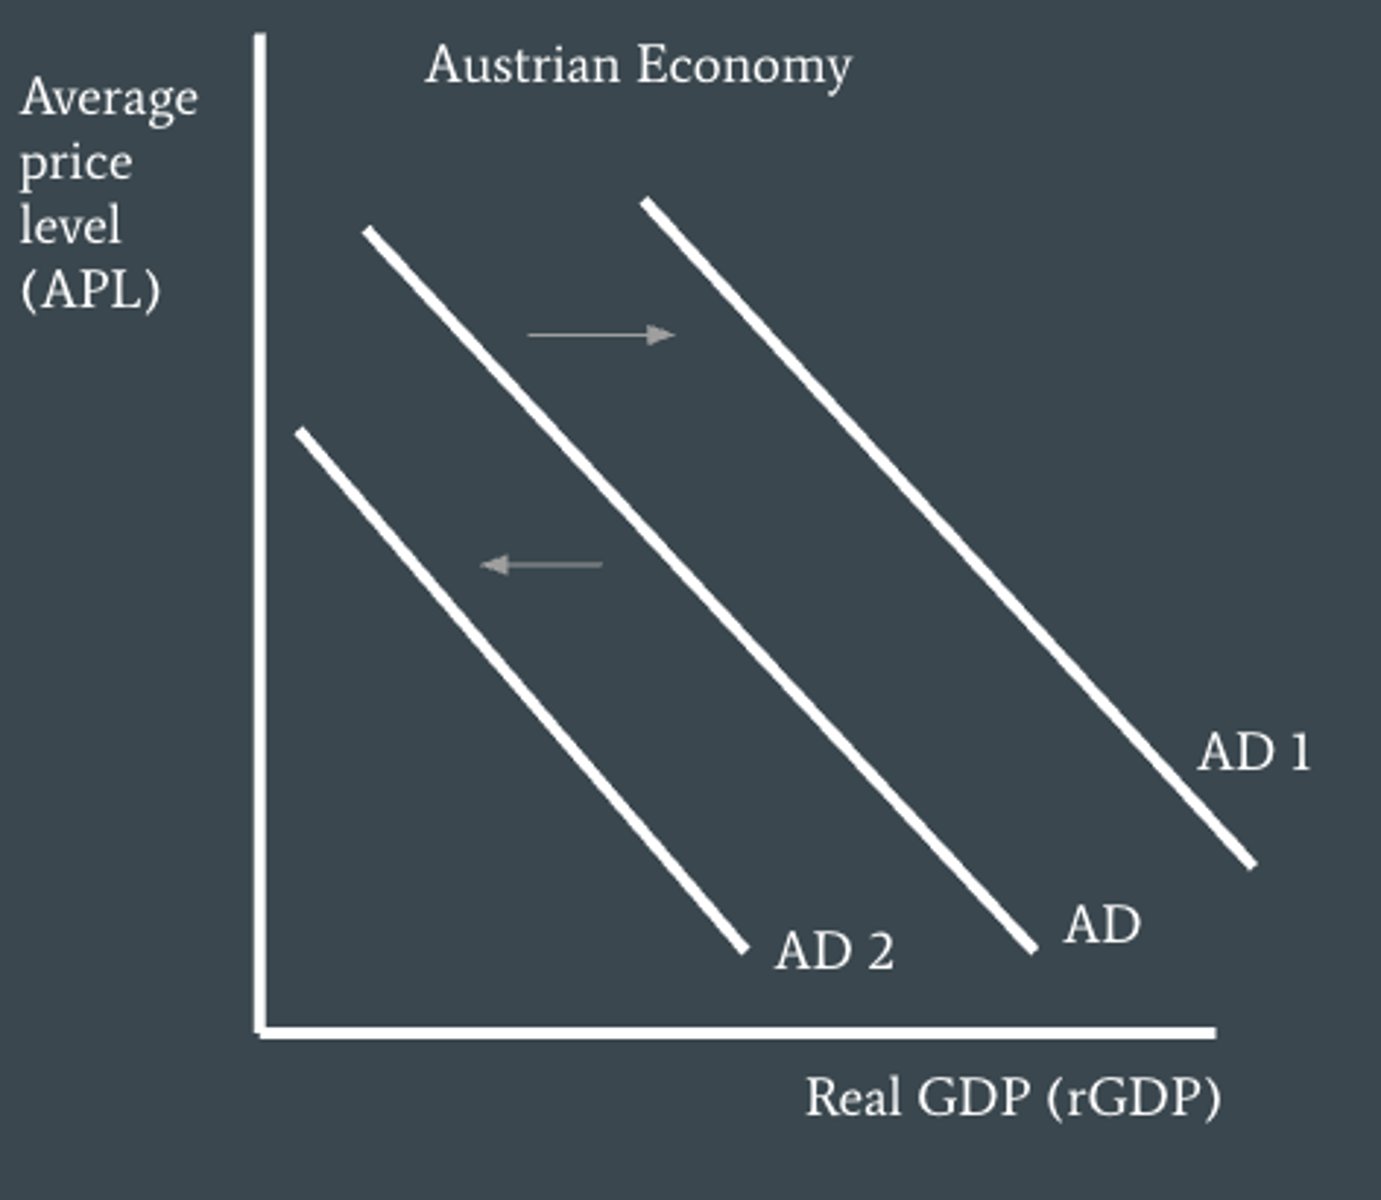
that aggregate demand increases so any price level, a larger amount of real GDP is demanded
What does a rightward shift from AD to AD1 mean?
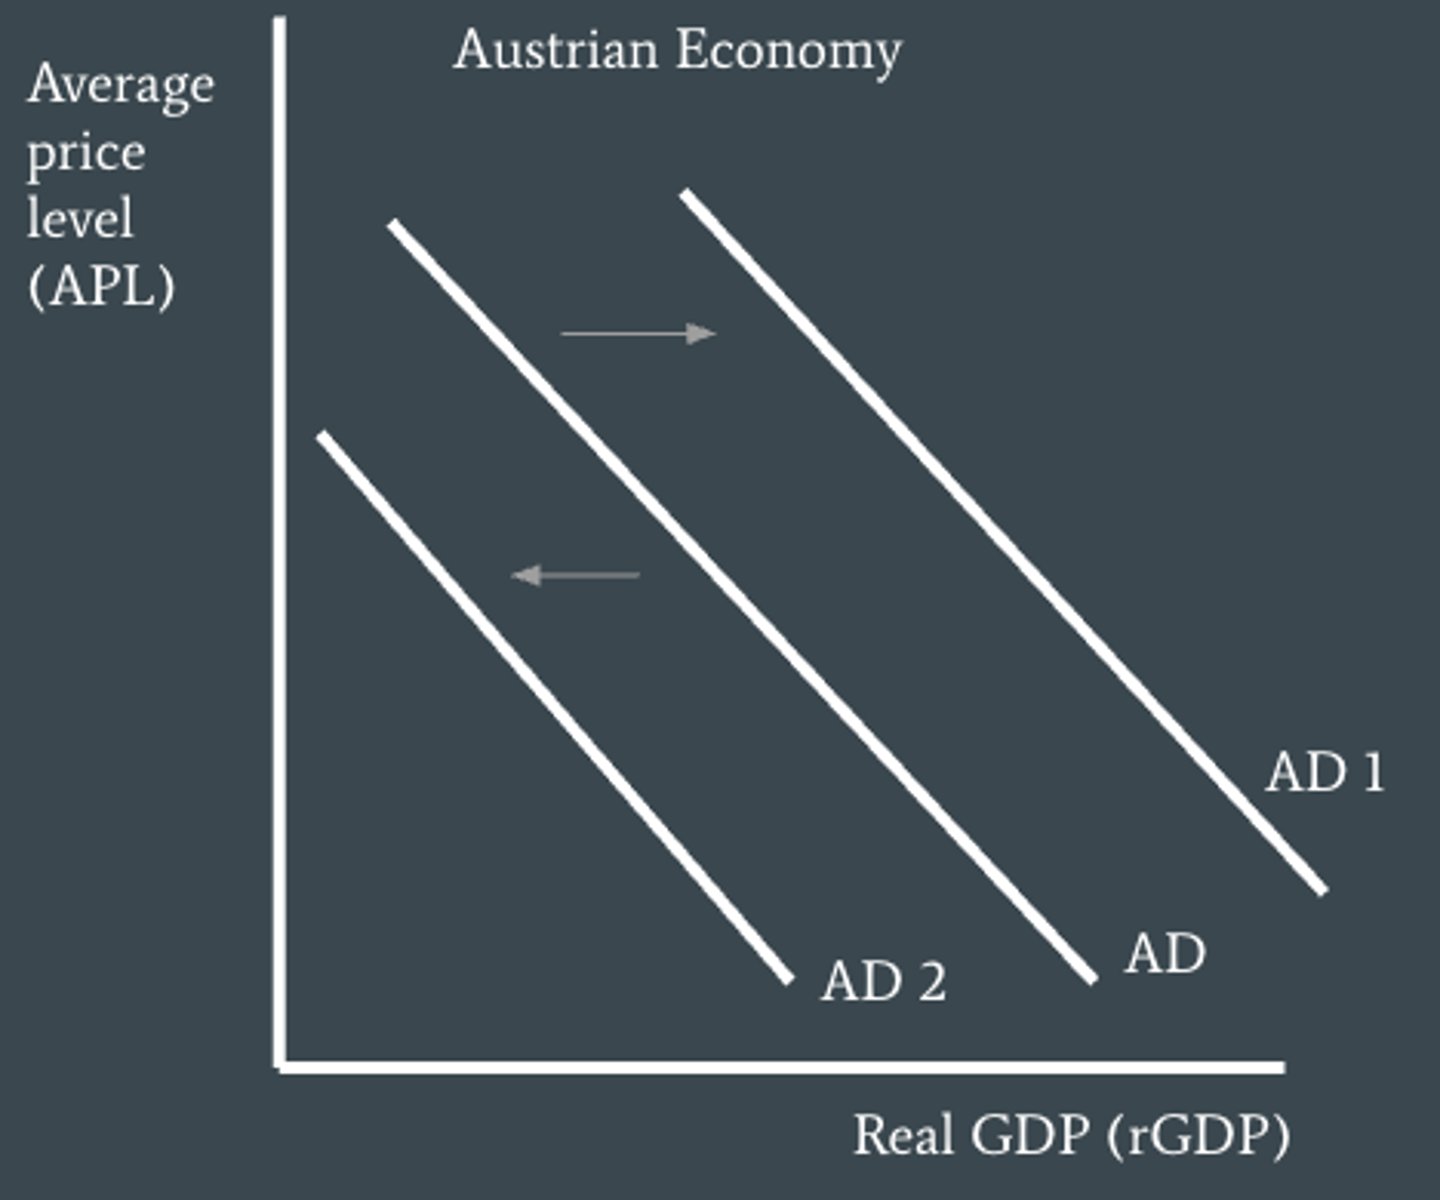
that aggregate demand decrease for any price level, a smaller amount of real GDP is demanded
What does a leftward shift from AD to AD2 mean?
1- changes in consumer confidence
2- changes in interest rates
3- changes in wealth
4- changes in income taxes
5- changes in the level of household indebtedness
6- expectations of future pice levels
What are causes of changes in household consumption? (6)
It measures how optimistic consumers are about their future income and future of the economy. If consumers are more optimistic they are likely to spend more on buying goods and services thus shifting AD to the right. While with low consumer confidence, it is an indication of the expectation of falling incomes and worsening economic conditions, maybe due to fears of cuts in wages, unemployment, Thus decreasing AD and shifting the curve to the left.
consumer confidence as a shifter of AD for households
increases in interest rates means borrowing is more expensive which results in less consumer spending and therefore a shift of AD to the left. While lower interest rates make borrowing less expensive and results in more consumer spending - shifting AD to the right.
interest rates as a shifter of AD for households
the price of borrowing or the reward for saving
interest rates
an increase in consumer wealth (eg=increase in value of homes), makes people feel wealthier and therefore they spend more so AD shifts to the right, while a decrease in wealth lowers AD and causes a leftward shift
Wealth as a shifter of AD for households
the value of assets people own, such as savings in the bank, houses, stocks/bonds, and jewelry
Wealth
if the government increases income taxes then consumer disposable income falls and then so does spending so AD shifts to the left. If they are decrease then consumers have more disposable income to spend on goods/services which increases AD and shifts it to the right
income taxes as a shifter of AD for households
taxes paid by households on their incomes
Income taxes
the income leftover after personal income taxes have been paid
disposable income
if consumers have higher debt then they are under higher pressure to make high monthly payments to pay back their loans plus interest, so they are likely to cut back on current expenditures - shifting AD to the left. Low levels of indebtedness increase consumption spending and shifts AD to the right
Levels of households indebtedness as a shifter of AD for households
refers to how much money people owe from borrowing in the past
Indebtedness
if consumers expect prices to fall they make postpone spending until they do so, causing AD to decrease shifting it to the left. But f they expect future prices to increasing they may buy now in order to avoid higher prices later, causing AD to increase shifting it to the right
expectation of future price levels as a shifter of AD for households
1- changes in business confidence
2- changes in interest rates
3- improvements in technology
4- changes in business tax
5- level of corporate indebtedness
6- Legel/institutional changes
What are causes of changes in investment spending ? (6)
business confidence measures how optimistic firms are about their future sales and economic activity. If they are optimistic they will spending more on investment and AD will shift to the right. But if they are not (business pessimism) they will not invest and so AD shifts to the left
Business confidence as a shifter of AD for firms
increase in interest rates mens that the cost of borrowing is higher and thus forces businesses to reduce investment spending financed by borrowing thus AD shifts to the left. While if they decrease then firms can finance their investment spending by borrowing at lower costs so AD shifts to the right.
Interest rates as a shifter of AD for firms
improvements in technology stimulate investments spending and causes increases in AD so curve shifts to the right
Improvements in technology as a shifter of AD for firms
taxes on profits businesses make
Business Taxes
if government increases taxes on firm's profits of their business the firms after-tax profits decrease and so their investment spending also decrease so AD shifts to the left. Decreases in the taxes results in increases in AD and a shift to the right
Business Taxes as a shifter of AD for firms
if firms have high levels of debt due to past borrowing they will be less willing to make investments and so AD shifts to the left. While if they don't then they will spend more and so AD shifts to the right.
Level of corporate indebtedness as a shifter of AD for firms
For example some small businesses do not have access to credit which means they cant borrow easily to finance investments which decrease AD shifting it to the left.However if credit is made more accessible and securing property rights would create increases in investment spending and shifts AD to the right
Legal/institutional changes as a shifter of AD for firms
1- changes in political priorities
2- changes in economic priorities
What are the causes of changes in government spending? (2)
Since governments have many expenditures arising from provision of merit and public good, subsidies, pensions and payments of wages and salaries to employees. They may decide to increase or decrease its expenditure in response to changes in its priorities. increases in government spending shifts AD to the right while decreases shift it to the left
Changes in political priorities as shifters of AD for government spending
The government can use its own spending as a part of deliberately attempting to influence aggregate demand. If they choose to increase AD then it will shift the curve to the right, while a decrease will result in a leftward shift.
Changes in economic priorities as shifters of AD for government spending
1- changes in national income abroad
2- changes in exchange rates
3- changes in trade policies or level of trade protections
What are causes of changes in net exports? (3)
If the national income of country B increases it will import more goods/services from country A therefore the exports of country A will increase. The AD curve will shift to the right for country A. If country B national income decreases then exports of country A will also decrease and so will AD shifting to the left.
Changes in national income abroad as a shifter of AD for net exports
the price of one country's currency in terms of another country's currency
Exchange rates
If the price of country A's currency increase is becomes more expensive relative to currency of country B. Country B now finds country A's output more expensive and so it will import less from it. The exports of country A will decrease and AD will shift to the left. At the same time country A now finds country B's output cheeper so it increase its imports from country B. In the opposite situation (price of currency of country A decrease) there will be an increase in exports and decrease in imports so AD shifts to the right
Changes in exchange rates as a shifter of AD for net exports
restrictions to free international trade, they are often imposed by governments
Trade protections
If country A freely trades with country B, but country B decides to impose restrictions on imports from country A. Country A's exports will fall and its AD curve will shift to the left. But in country B it means lower imports and so the value of X - M increase and so AD curve shifts to the right (for country B)
Changes in trade policies or level of trade protections as a shifter of AD for net exports
the total quantity of goods and services produced in an economy over a period of time at different price levels
Aggregate supply

demonstrates the relationship between price level and the quantity of output produced by firms when resources (mostly wages) are fixed
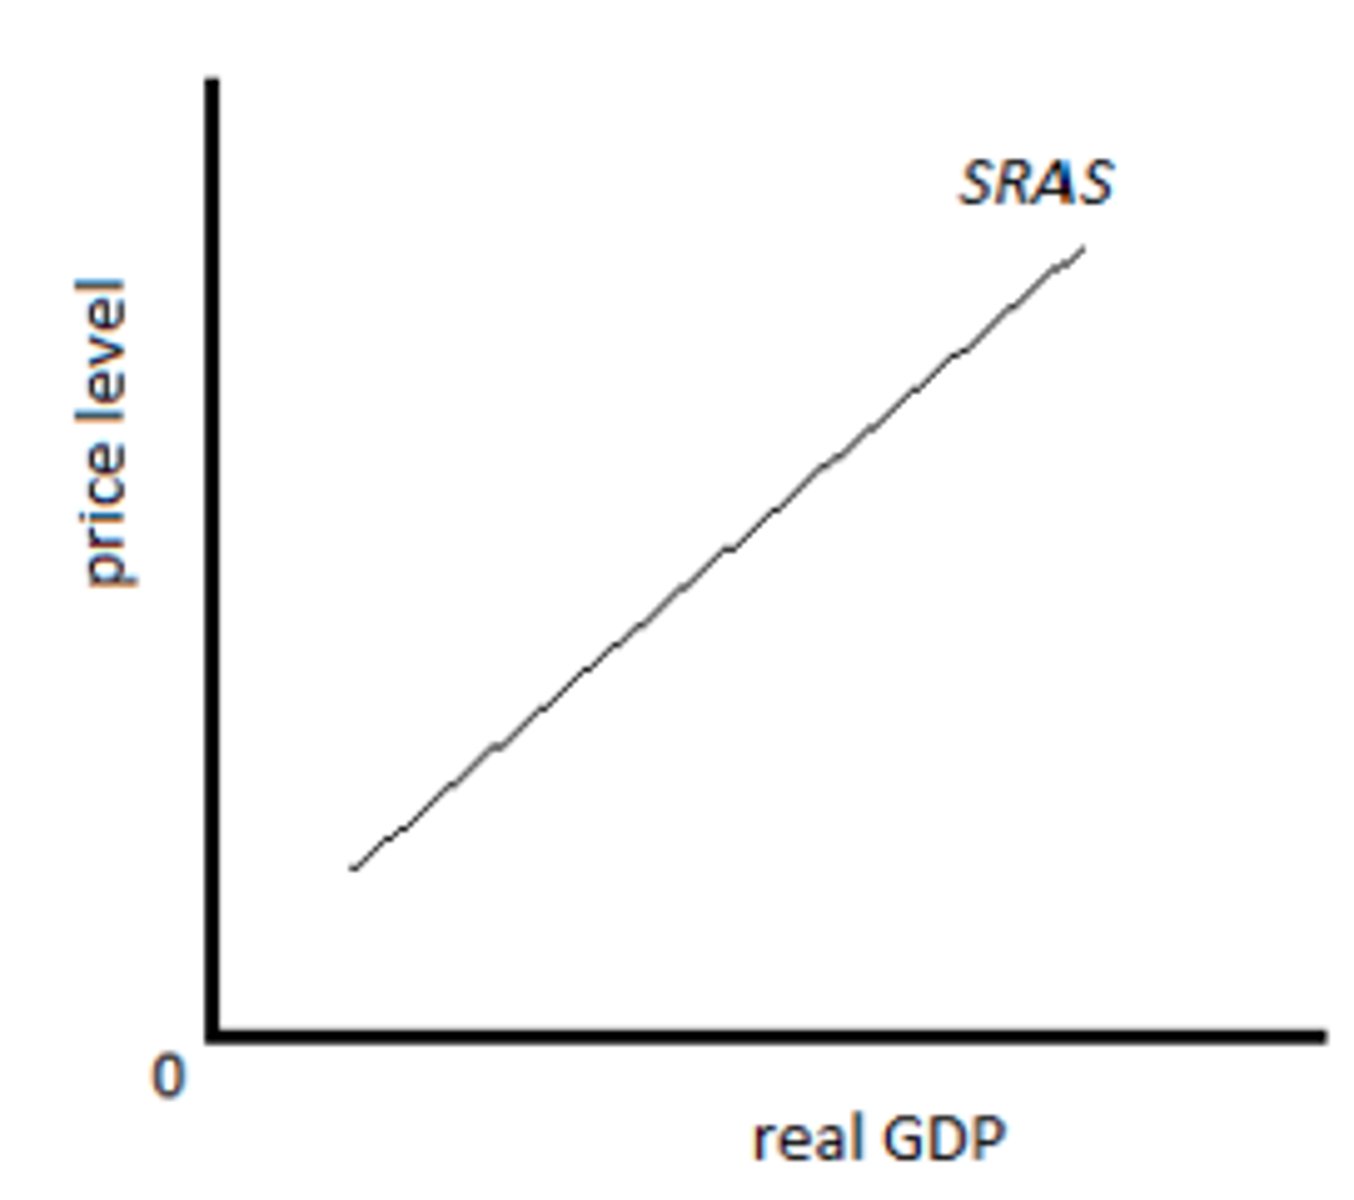
Short-run aggregate supply (SRAS)
the period of time in which prices of resources are roughly constant or inflexible despite changes in price level
short run in macroeconomics
The period of time when the prices of all resources (including wages) are flexible an change along with changes in price level
Long run in macroeconomics
- minimum wage legislations which fix the lowest legal permissible wage
- Contractural agreements that fix wages for certain periods of time (usually a year or two or more)
- Union power - workers and labor unions resist wage cuts
- Wage cuts; firms avoid this as it would reduce productivity
Why do are wages often rigid (unchanging)? (4)
Connects to firms profitability. When price levels rise but firms resource costs remain fixed the incentive for firms to increase their output increases. With increased revenues and fixed costs firms profits rise. Works the same for if price levels fell - price level falling = fall in output prices with constant resources costs so firm profitability falls and output decreases.
Why is SRAS upward sloping?
1- changes in wages
2- changes in non-labor resource prices
3- changes in indirect taxation
4- changes in subsidies offered to businesses
5- supply shocks
What are causes of changes (shifters) of SRAS? (5)
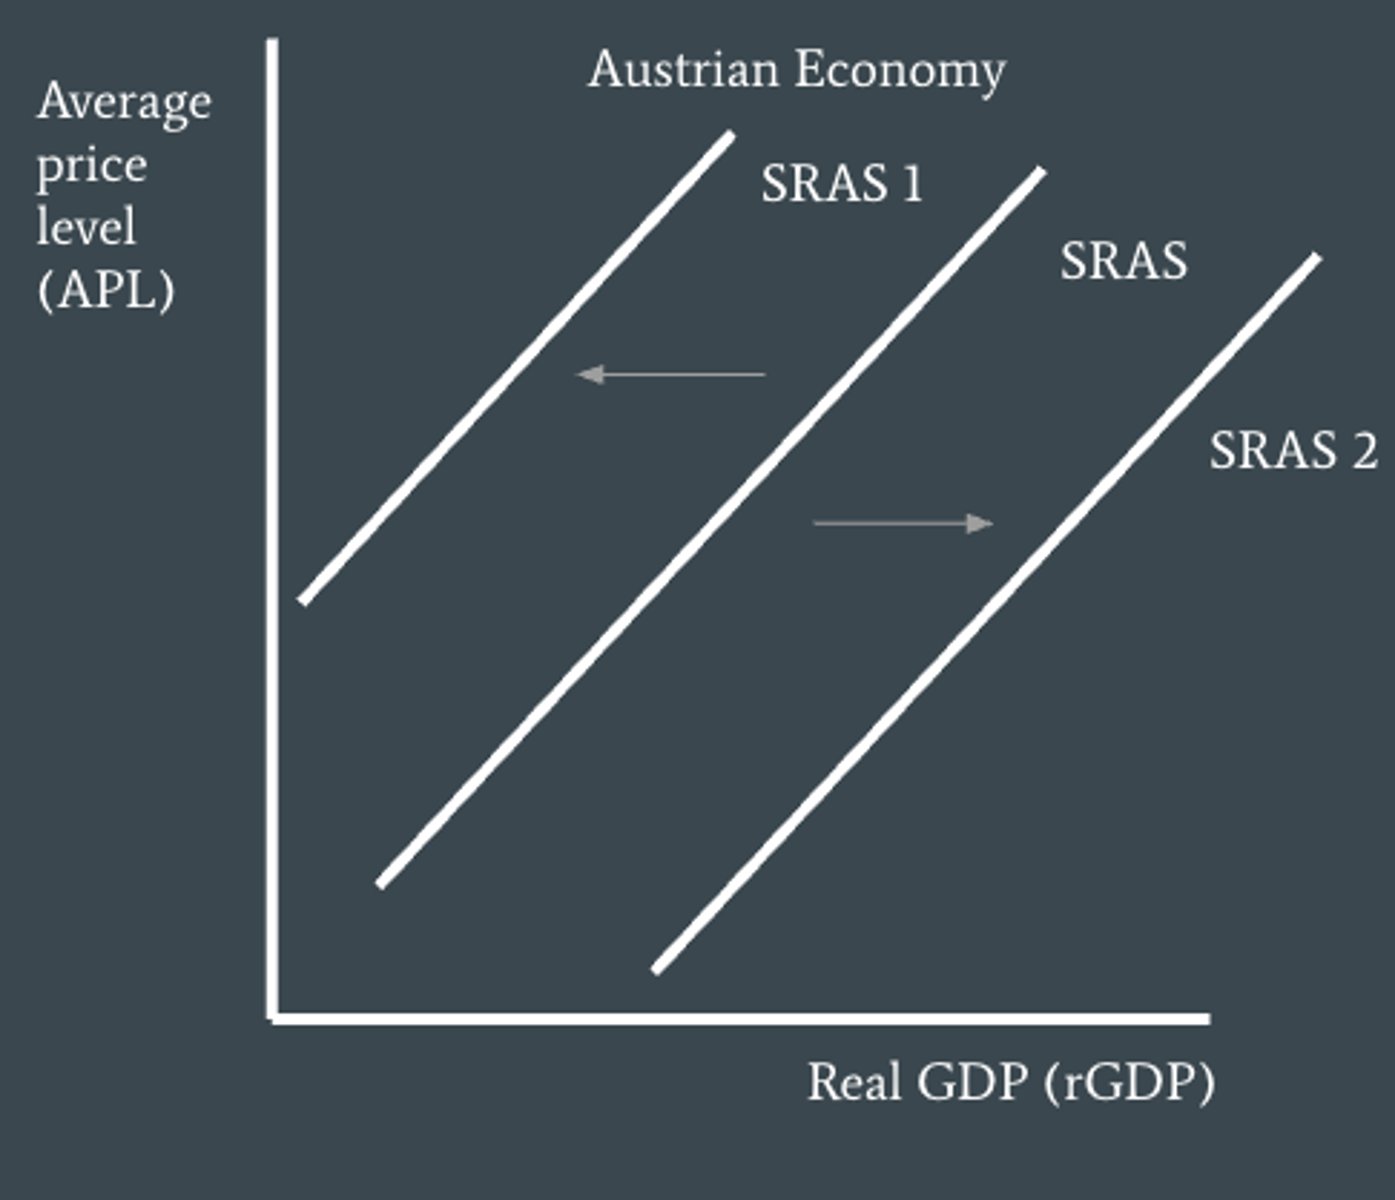
if wages increase with the price constant level then firms costs of production increase and so SRAS moves to the left to SRAS 1. While if wages decreases with price level constant, firms costs of production decrease shifting SRAS to SRAS 2 (rightwards).
Changes in wages as a shifter of SRAS
These changes include changes in the price of oil, equipment, capital goods or land input so if those increase then SRAS shifts to the left while if they decrease it shifts to the right
Changes in non-labour resources prices as a shifter of SRAS
Higher indirect taxes lead to increases in the firms costs of production which shifts SRAS to the left, while if they decrease SRAS shifts to the right
Changes in indirect taxation as a shifter of SRAS
If subsidies increase, SRAS will shift to the right but if they decrease it the curve shifts to the left
Changes in subsidies offered to businesses as a shifter of SRAS
Events that have a sudden and strong impact on short-run aggregate supply
Supply shocks
For example if a War resulted in the destruction of physical capital or disruption of the economy it would lead to lower output produced and thus a leftward shift in SRAS. Unfavorable weather conditions can also cause a fall in agricultural output shifting SRAS to the left but favorable weather conditions having a positive effect on agricultural output will shift SRAS to the right (increase in aggregate supply)
Supply shocks as a shifter of SRAS
Where SRAS meets AD. The level of output determines the average price level, the amount of national output and level of employment in the country
When does Equilibrium level of output occur?

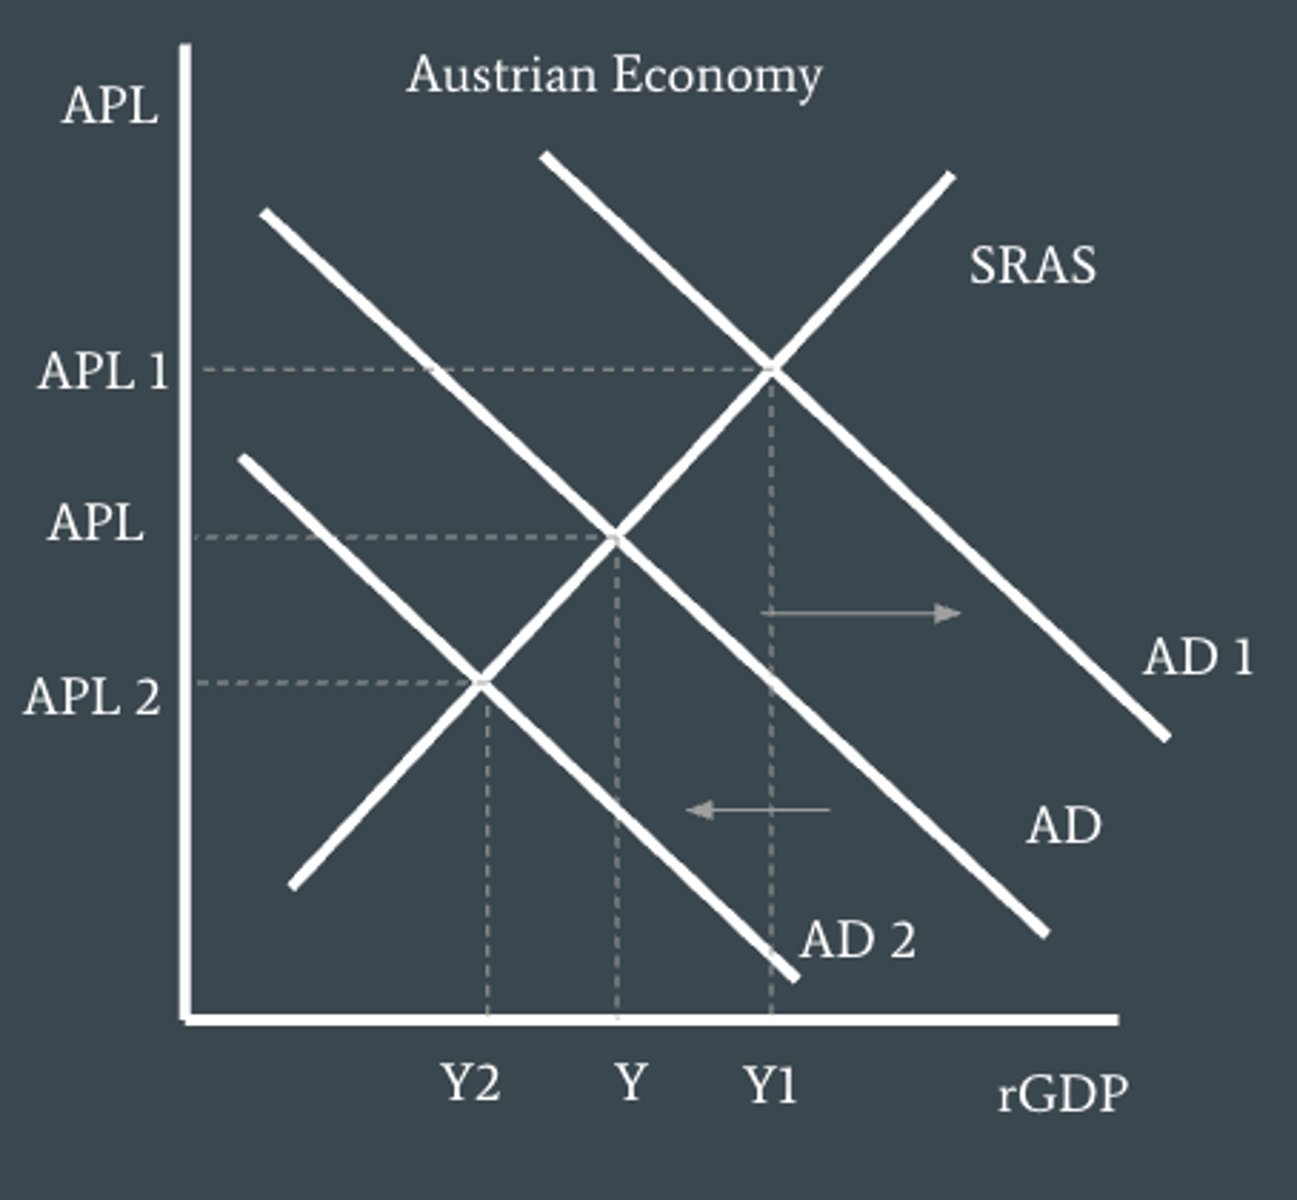
increased interest rates will decrease firms and household consumption and therefore shift AD to the left from AD to AD2. The average price level and rGDP decrease while unemployment increases
Example: ECB increase interest rates what will happen?
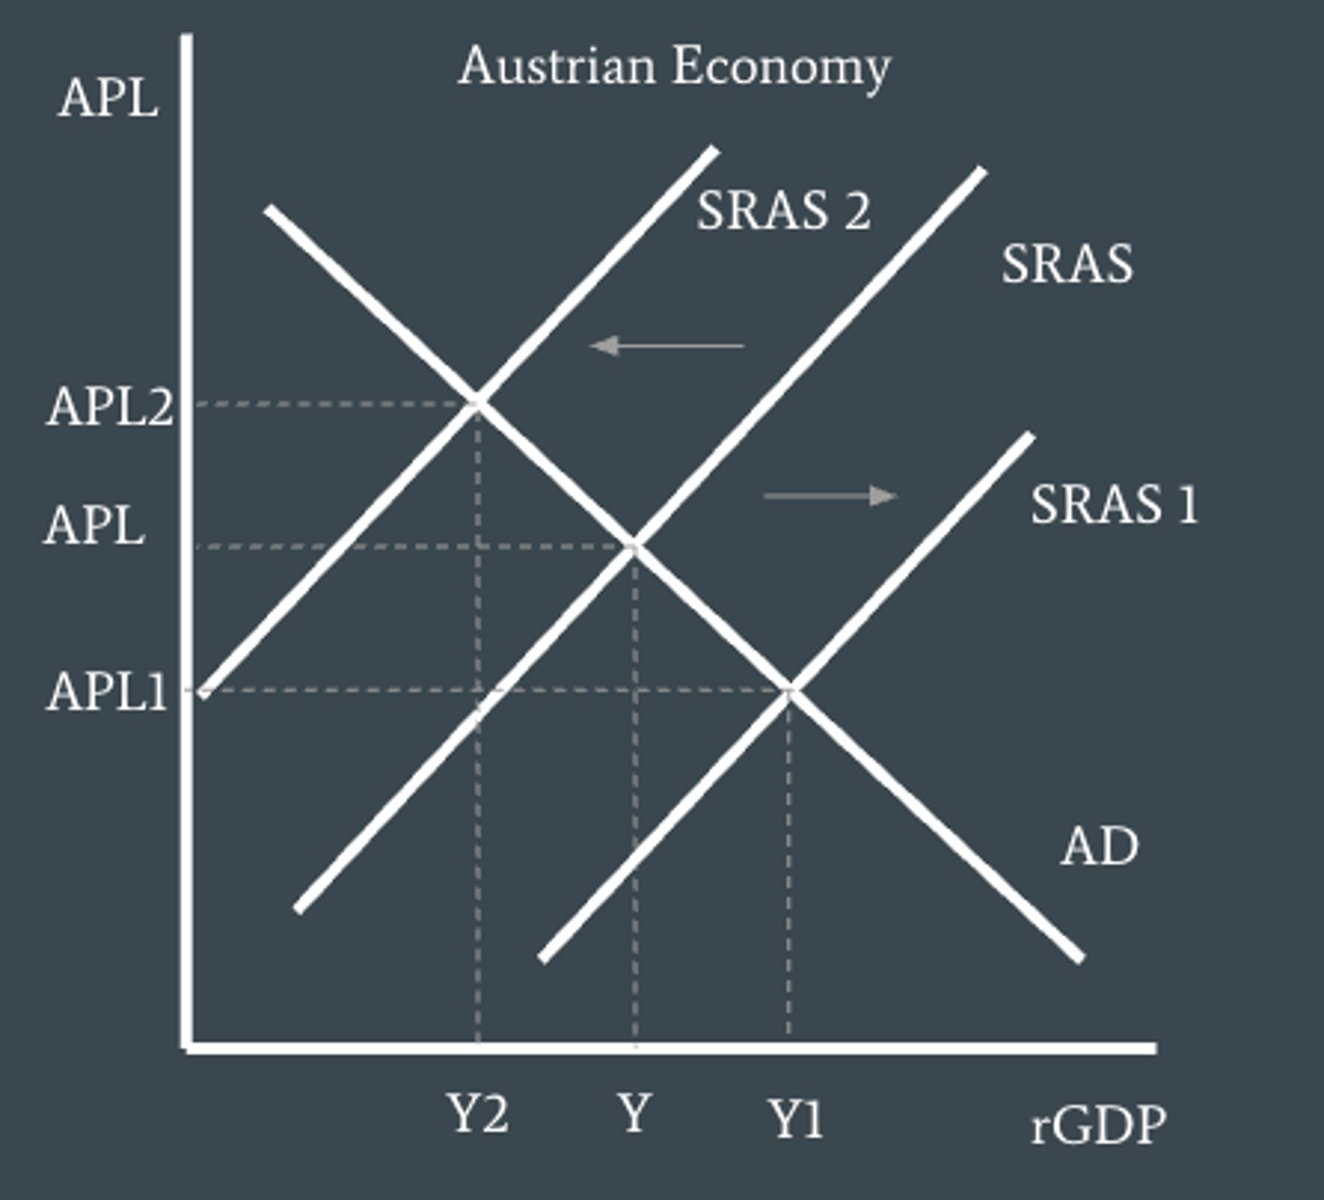
VAT is a change in indirect taxation and when this decreases firms are more likely to produce more output so SRAS shifts from SRAS to SRAS1 rightwards, so rGDP increases, while average price levels and unemployment decrease
Example: Austria reduces VAT from 20% to 19%. What will happen?
Focuses on the principle that the price mechanism is crucial in coordinating economic activities. It assumes that the economy is a harmonious system that automatically trend towards full-employment. Also assumes that when the economy moves into the long-run that all resource prices, including wages, will match the price level.
What is the monetarist/new classical view of macroeconomics?
When the economy produces at potential output the economy is experiencing 'full employment'. Full employment of output and potential output both refer to the output that is produced when the economy is at long-run equilibrium. Although this amount of output is considered 'full employment' we know that there is still some unemployment of resources.
Unemployment and long run equilibrium
Since wages and other resource costs are fully flexible in the long-run this means that firms costs of production remain constant even with changes in the price level. Therefore as the price level increases/decreases with constant real costs, firms profits are also constant and so they have no incentive to change their level of output. So the vertical curve means that in the long run any change in AD results only in changes in the price level while the quantity of real GDP produced remains the same.
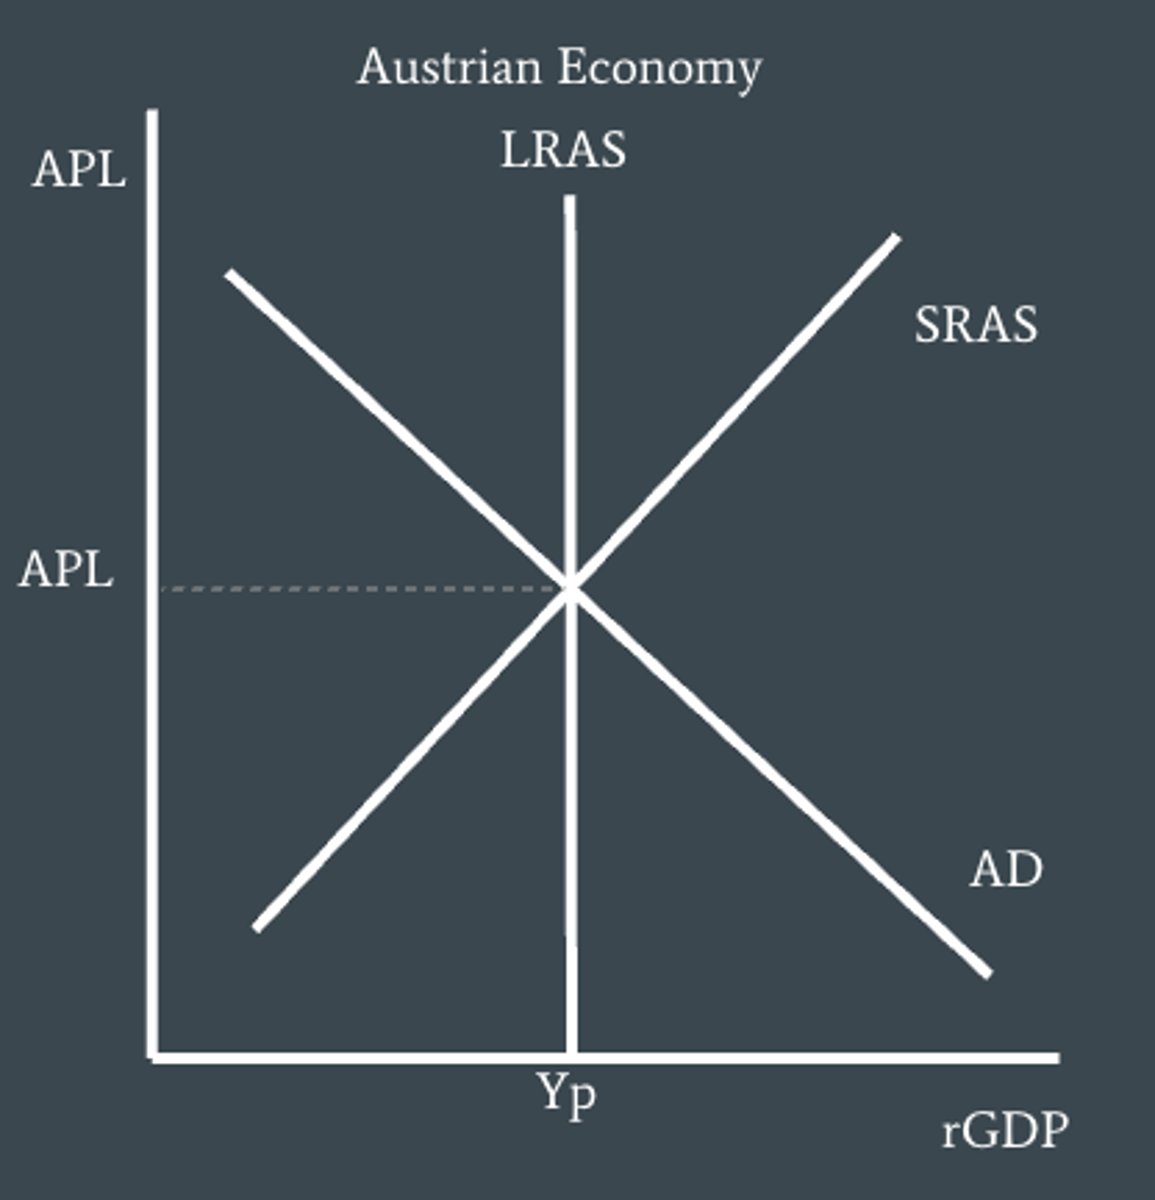
Why is LRAS vertical?
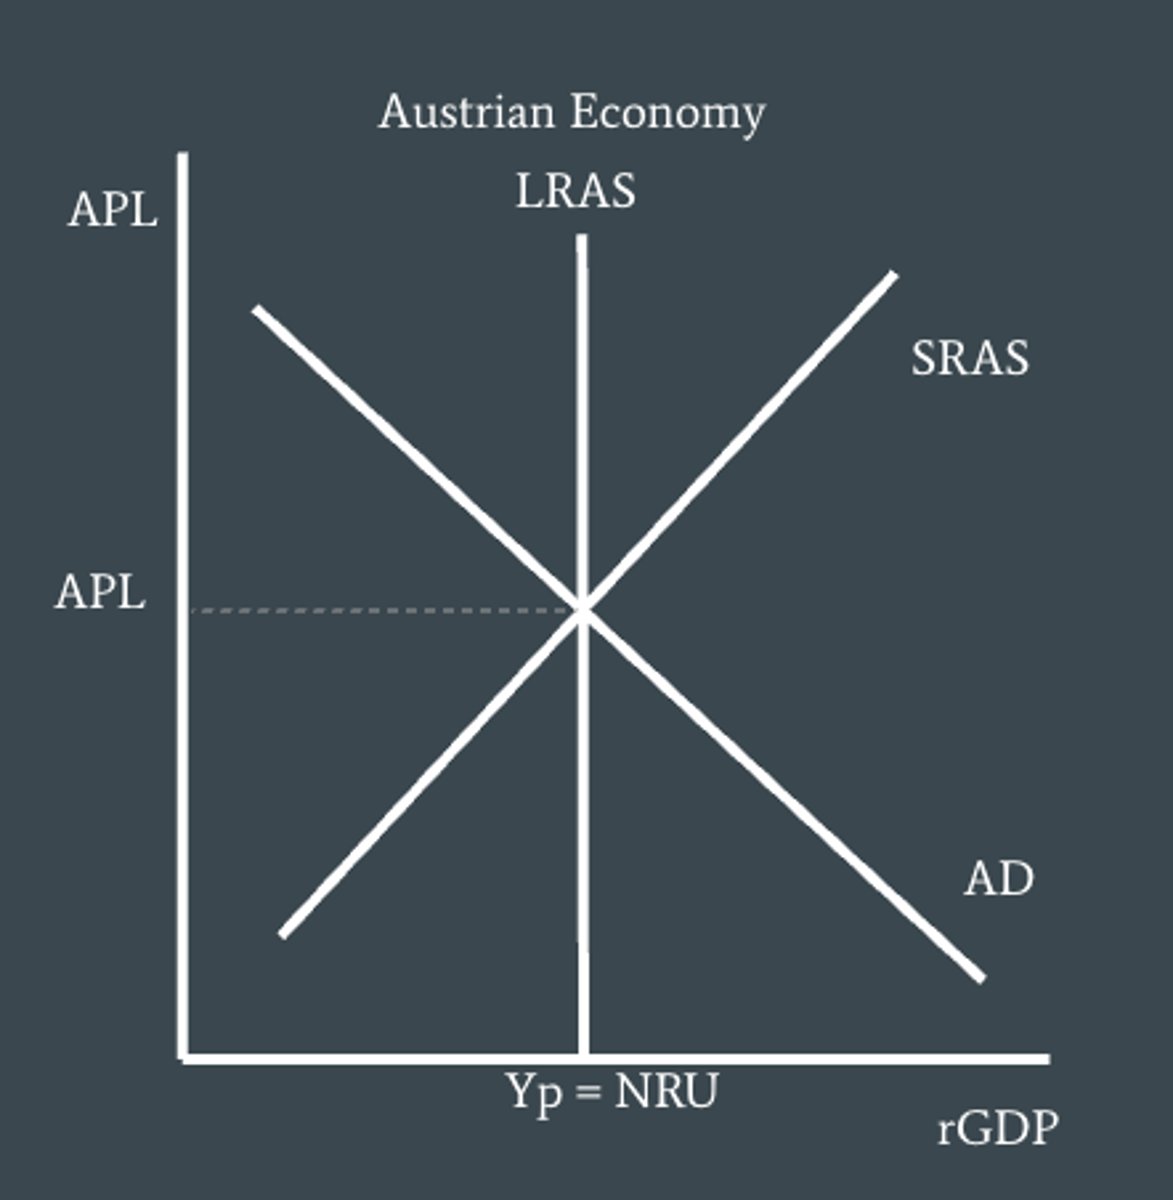
that unemployment is equal to the natural rate of unemployment
What does Yp mean on LRAS curve?
The situation in which real GDP is less than potential GDP; AD is below potential output and output is at Yrec (Ye to the left).
Recessionary (deflationary) gap
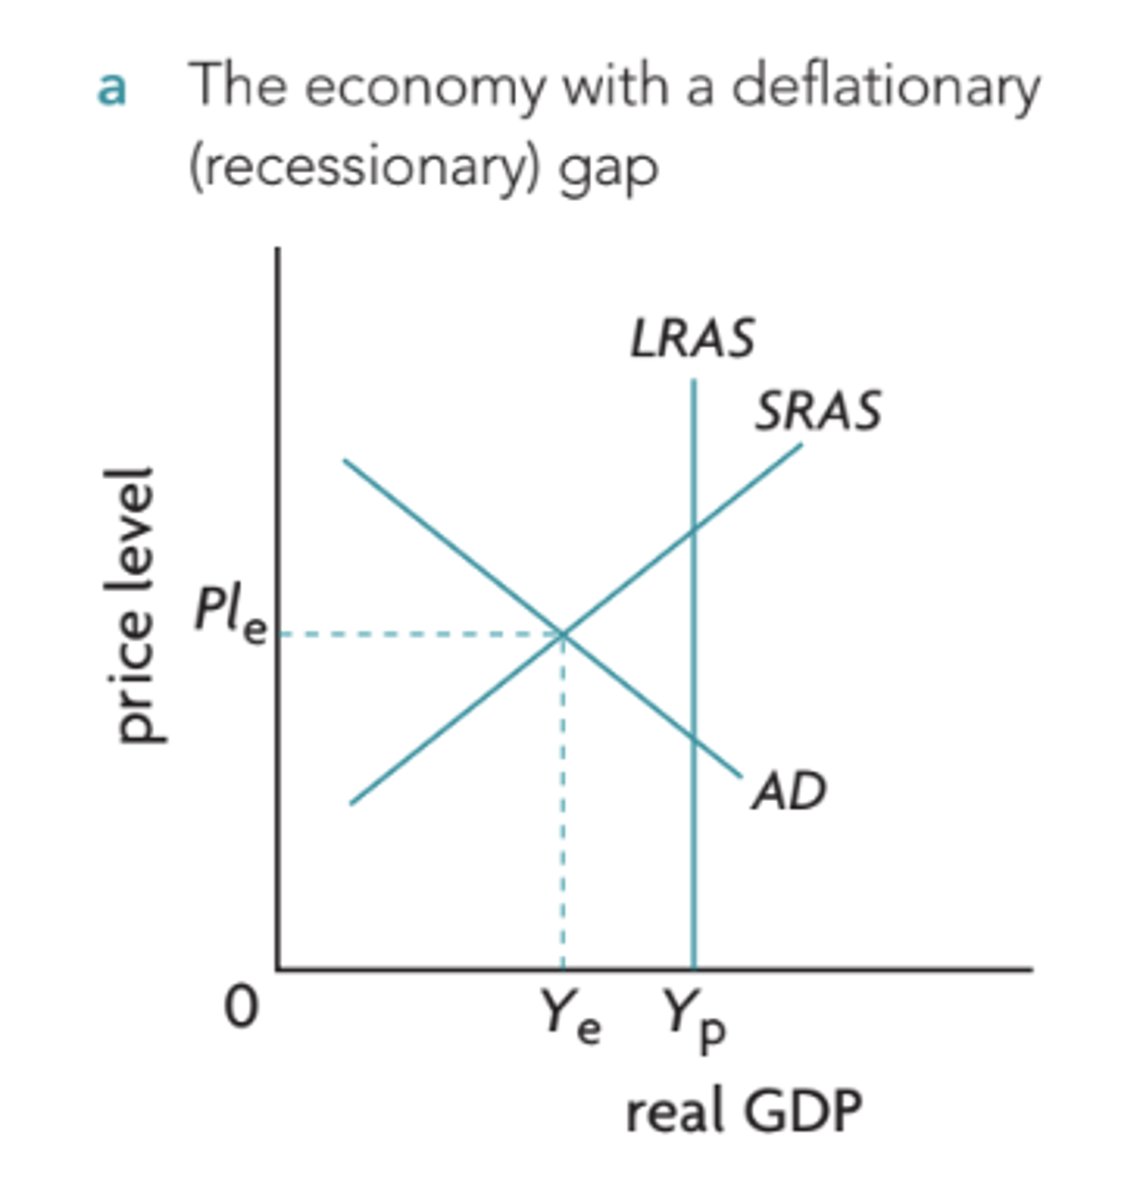
The recessionary gap occurs because the price level and the amount of real GDP that the four components of AD want to buy is less than the economy's potential GDP. There is not enough total demand in the economy to make it worthwhile for firms to produce potential GDP, which means that firms require less labor for production and so unemployment is greater than NRU.
Why does a recessionary gap occur?

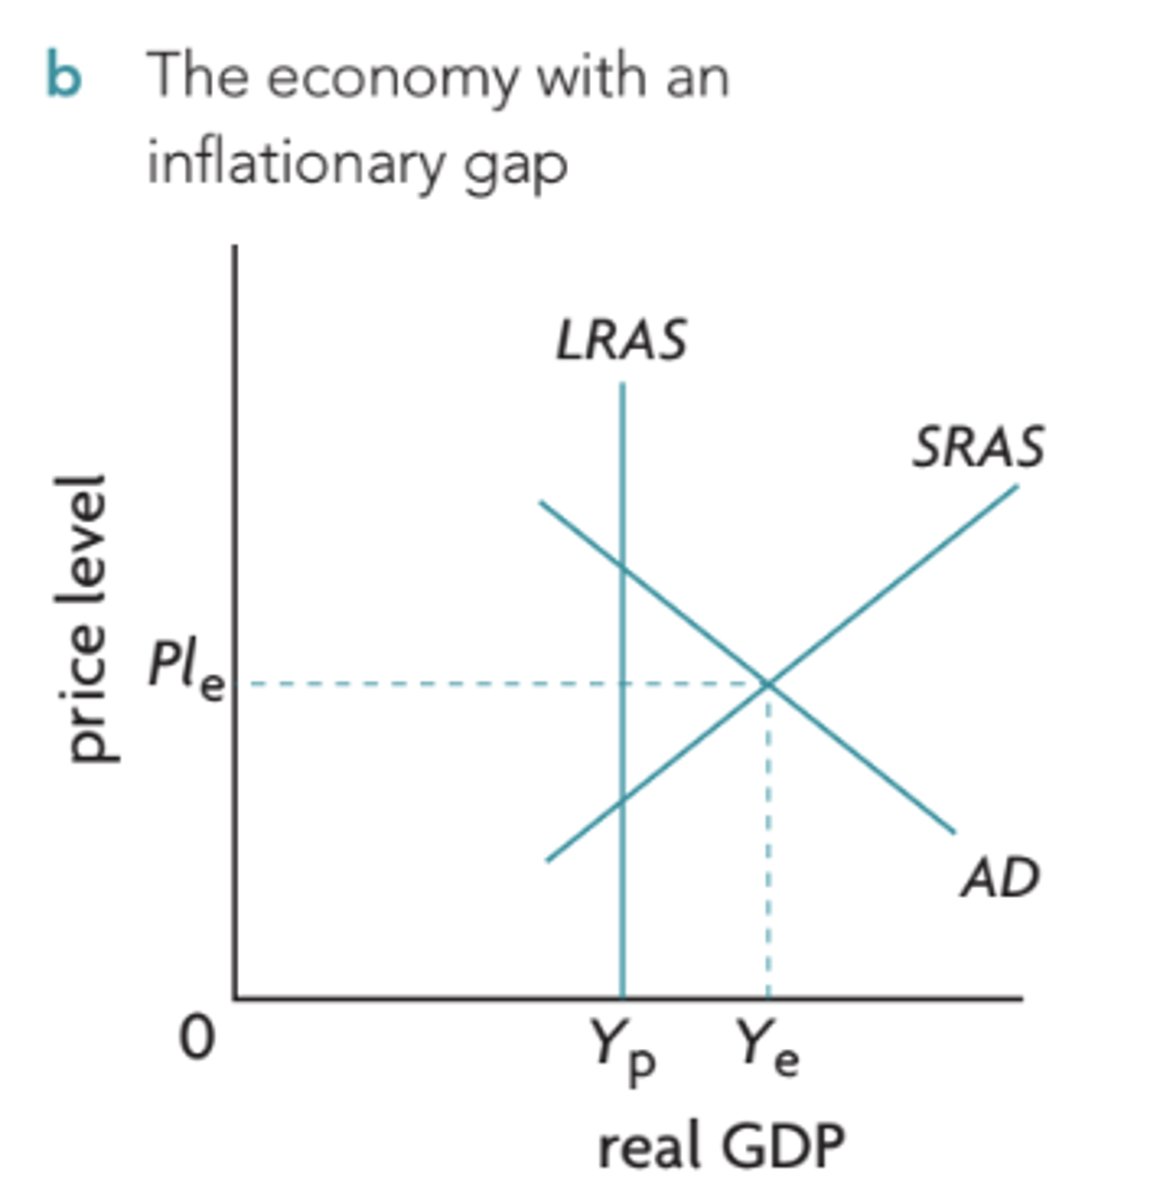
The situation in which realGDP is greater than potential GDP; AD is above Yp at Yinf(Ye to the right)
inflationary gap
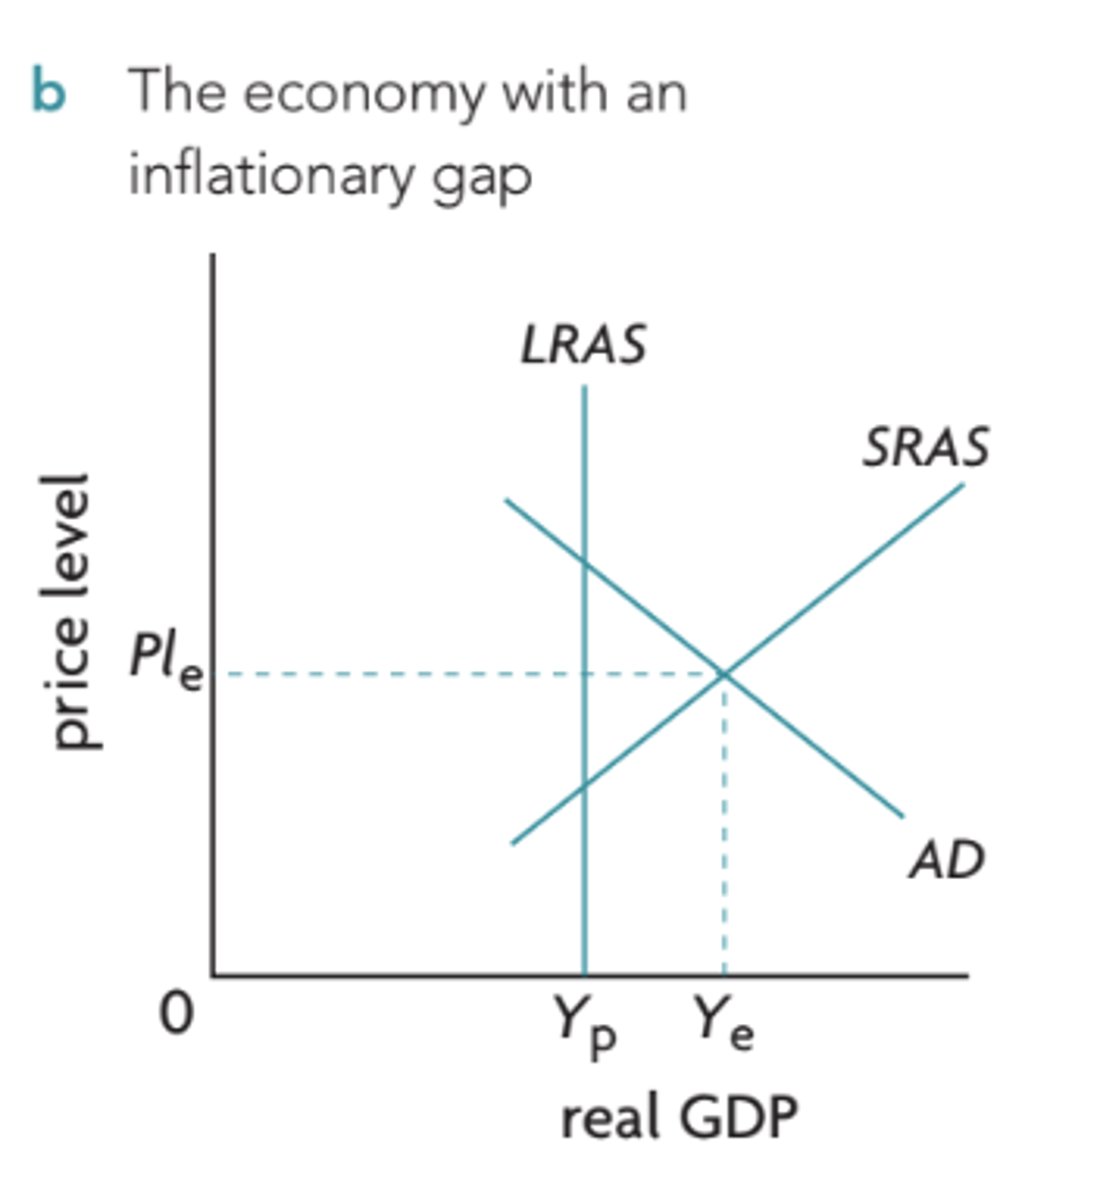
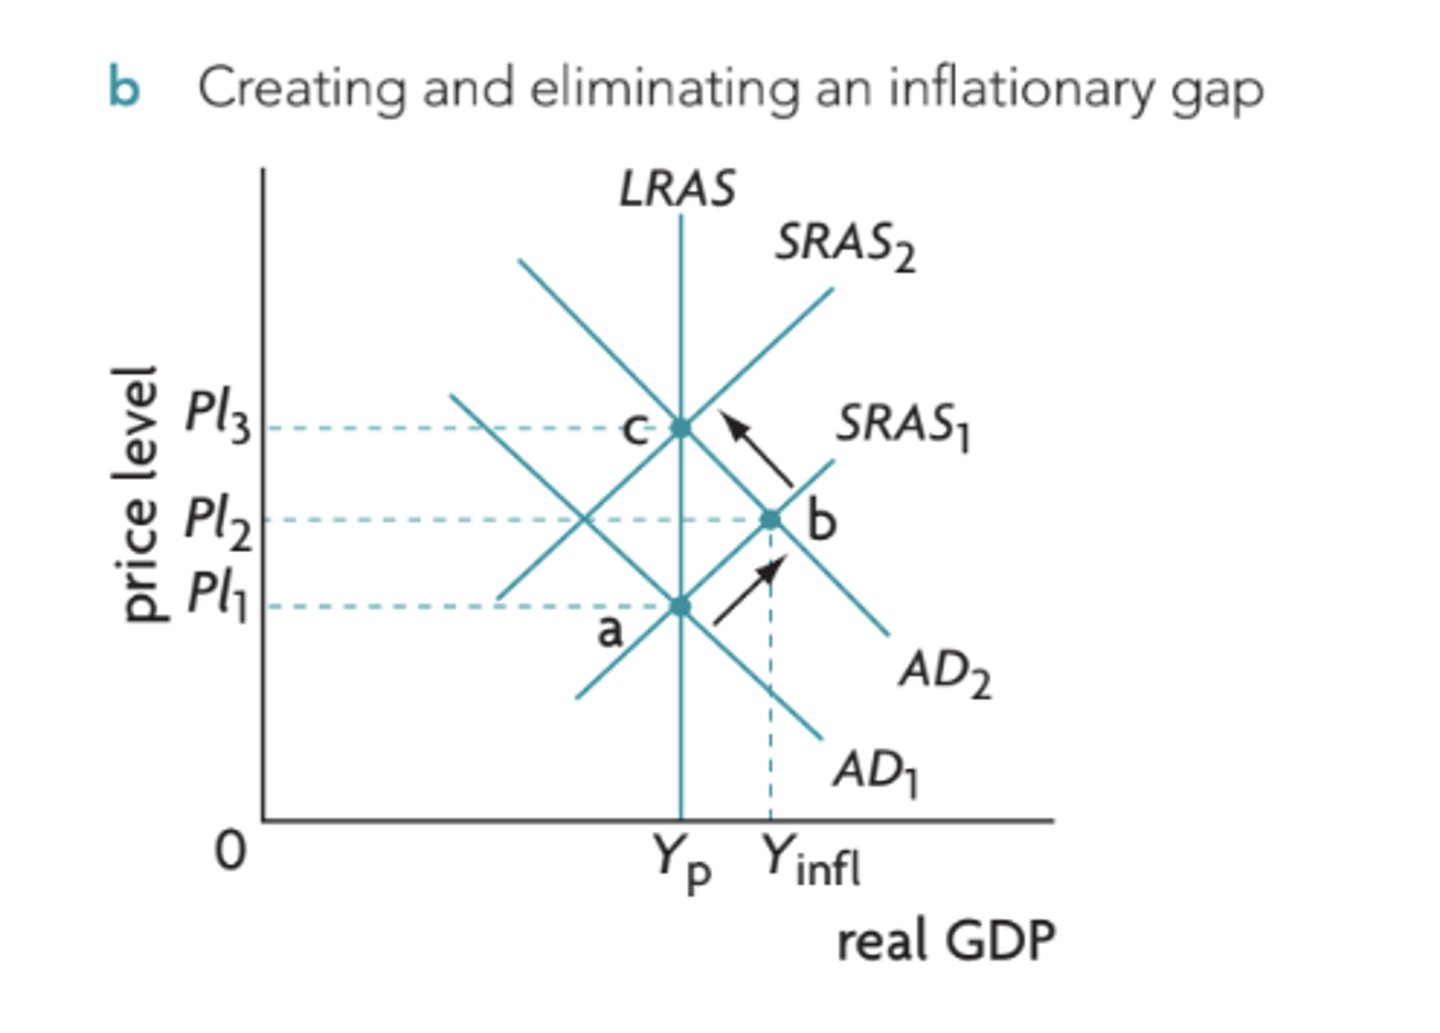
An inflationary gap occurs because with AD the quantity of realGDP that the four components of demand want to buy at the price level is greater than the economy's potential output. There is too much total demand in the economy and firms respond by producing greater quantities of rGDP than potential GDP. Because of this firms labor increases and unemployment falls to be less than NRU.
Why does an inflationary gap occur?
An increase in SRAS will lead to lower price levels and higher economic output while decreases in SRAS will lead to less economic output and higher price levels. This is known as Stagflation.
What is the effect of an increase/decrease in SRAS (on a monetarist model)?
a period of slow economic growth and high unemployment (stagnation) while prices rise (inflation) simultaneously
Stagflation
Because of the assumption that in the long-run resources costs (wages) will adjust upward or downward to help the economy achieve full employment or potential output.
Why can't output gaps (recessionary/inflationary) not persist in the long run? - in the monetarist/new classical view
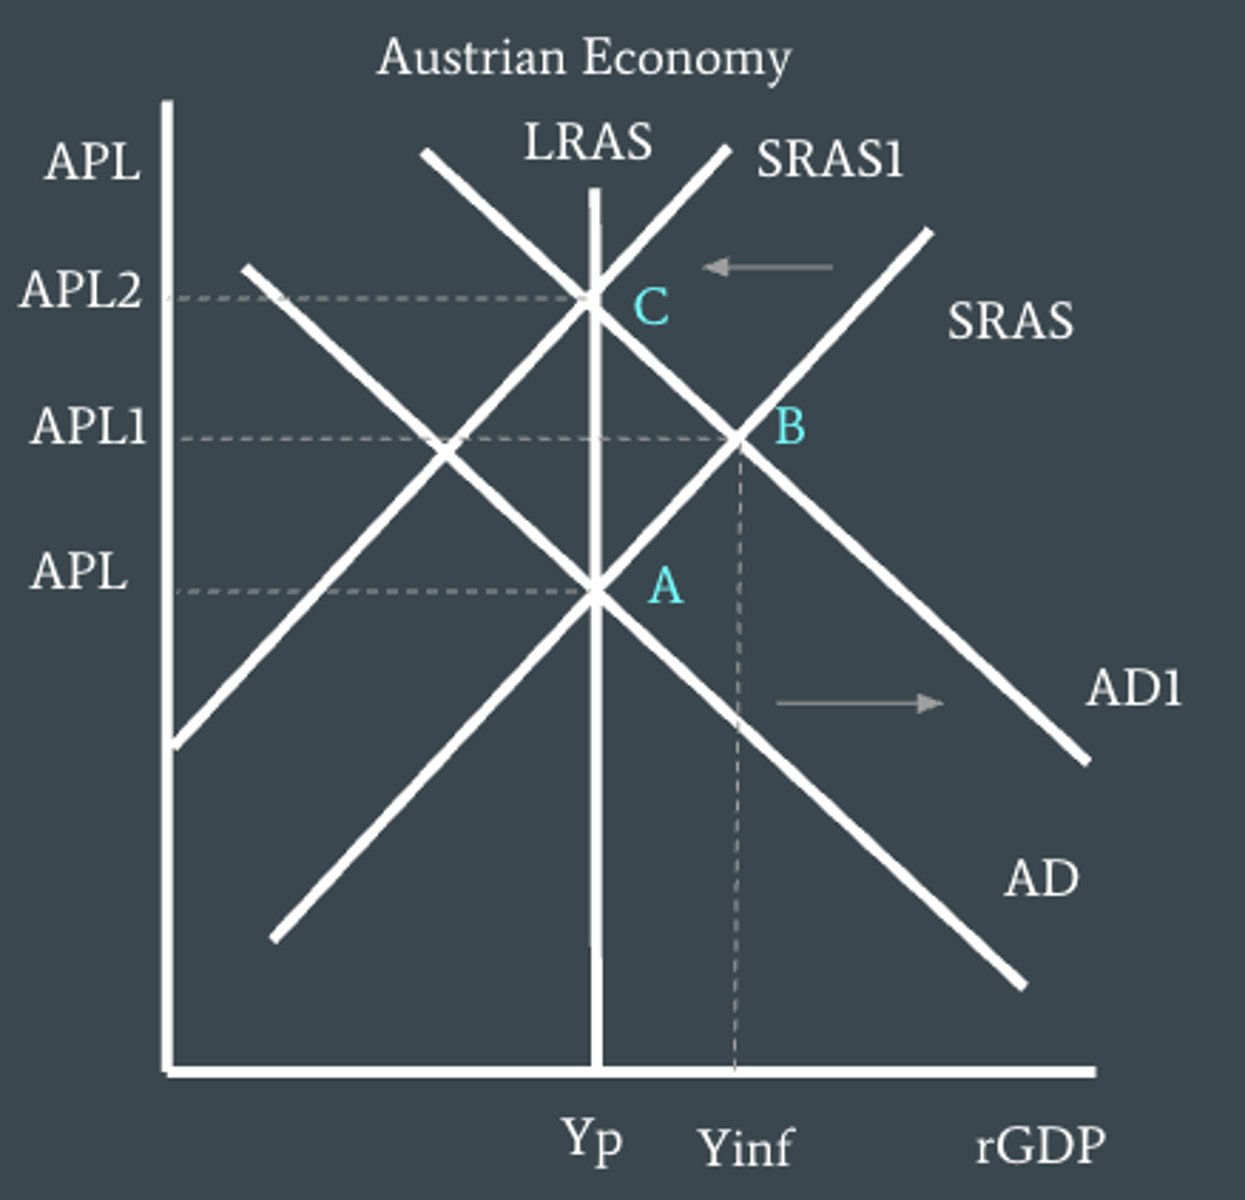
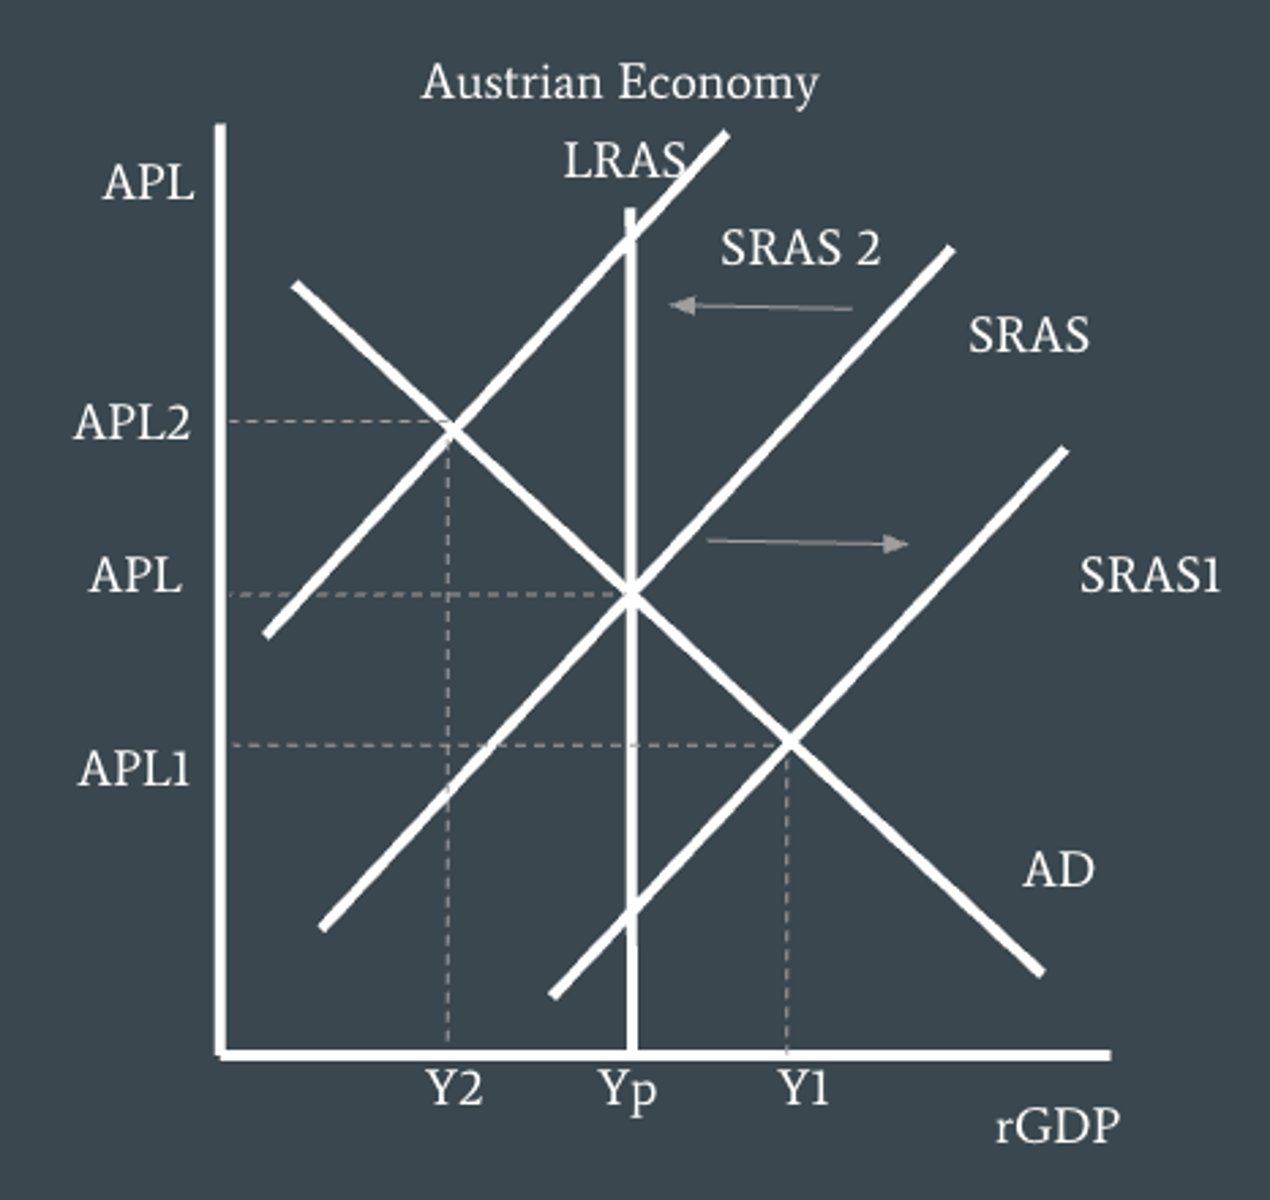
If AD increases due to reduction of income taxes this moves the equilibrium level of output from A to B. IN the short run wages will remain fixed and firms will benefit from selling more output at higher prices with similar production costs, increasing profitability. However, as workers see their buying power decreasing they will demand higher wages which will increase firms costs of production, thus decreasing SRAS to SRAS1 and moving output from B to C.
Why would an inflationary gap not persist in the long run (monetarist view)?
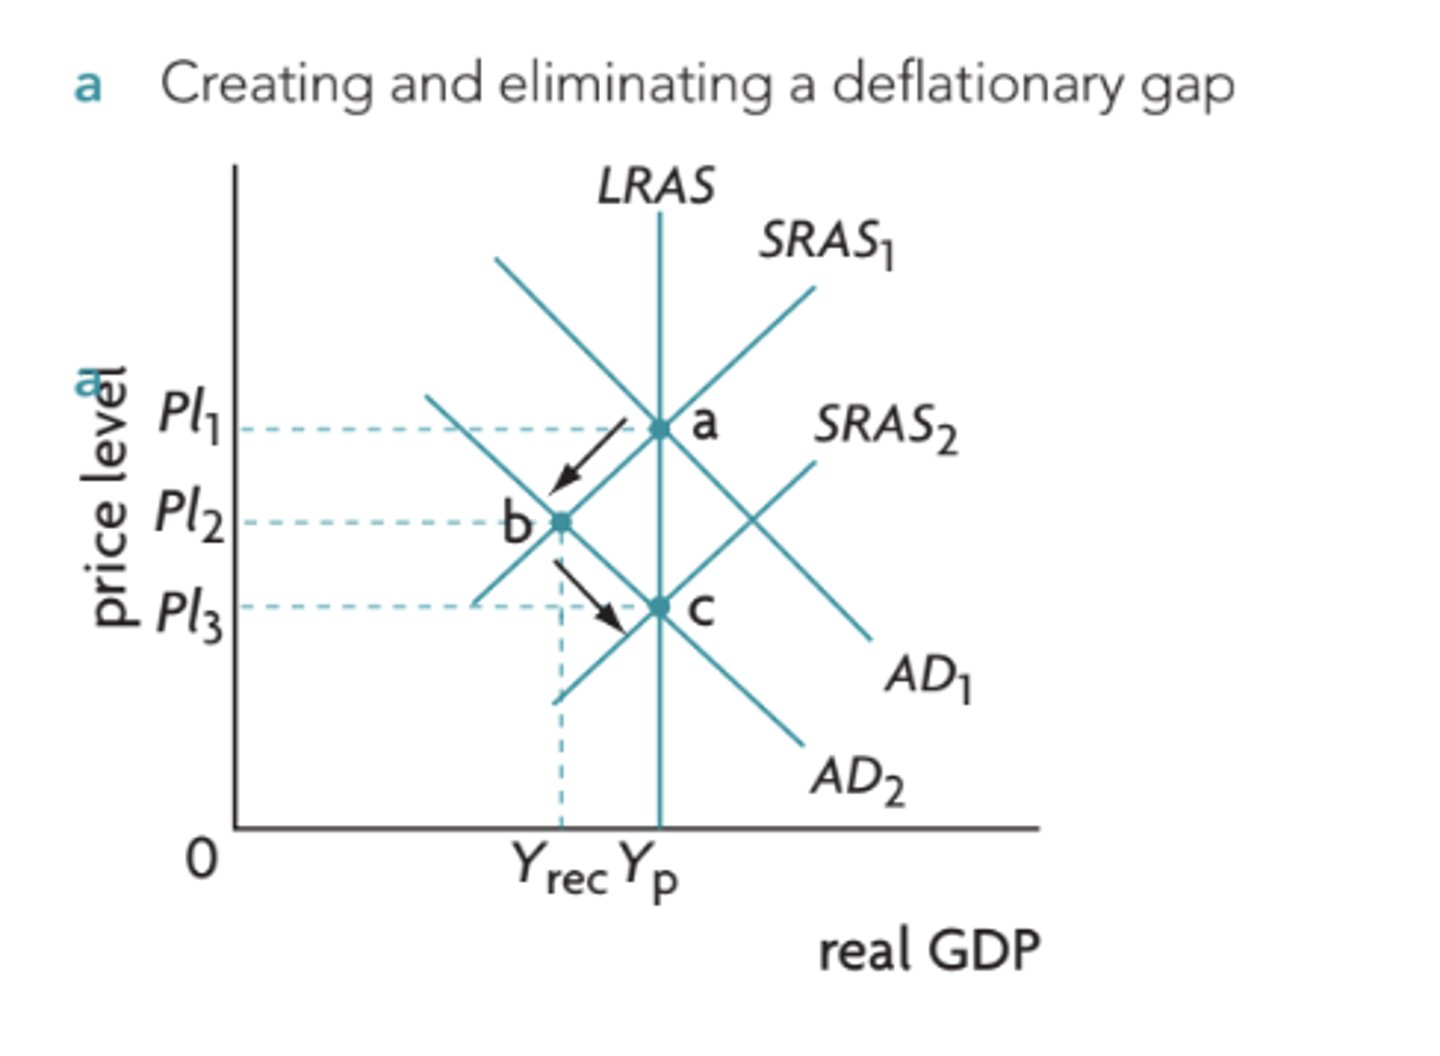
If there is a decrease in AD from AD1 to AD2 it will causes the economy to move in the short run from A to B where a deflationary gap arises. At B real GDP as fallen to Yrec and price level has fallen from P1 to P2. However, since in the long run the economy can't remain in an output gap. The price fall is matched by a fall in wages shifting SRAS1 to SRAS2 until the economy is back on the LRAS curve; point C. This way the gap is eliminated and only change that occurs is a fall in price level.
Why would a deflationary gap not persist in the long-run (monetarist view)?
Keynesian economists would argue that wages are able to adjust upwards but that they largely do not flex downward keeping the economy from moving into the 'long-run'. They argue that there is an asymmetry between wages in the upward and downwards directions. Wages are sticky. They also argue that along with wages, product prices will also not fall easily.
What is the Keynes perspective?
In a recession if wages do not go down, firms will avoid lowering their price because it would reduce their profits. Moreover, oligopolistic firms may fear price wars; if one firm lowers its price, then others may lower theirs more aggressively in an effort to capture market shares, and then all the firms will be worse off. Such factors make it unlikely for prices to fall even in a recession
Why do Keynesian economists argue that product prices would also not fall easily (even in recessionary gaps)?
Means that wages do not fall easily.
- labor contracts
- min. wage legislations
- union power
- employer resistance due to moral
What does it mean when wages are sticky and what factors keep them sticky (4) ?
the economy may get stuck in the short run.
What may happen if wages and prices do not fall easily?
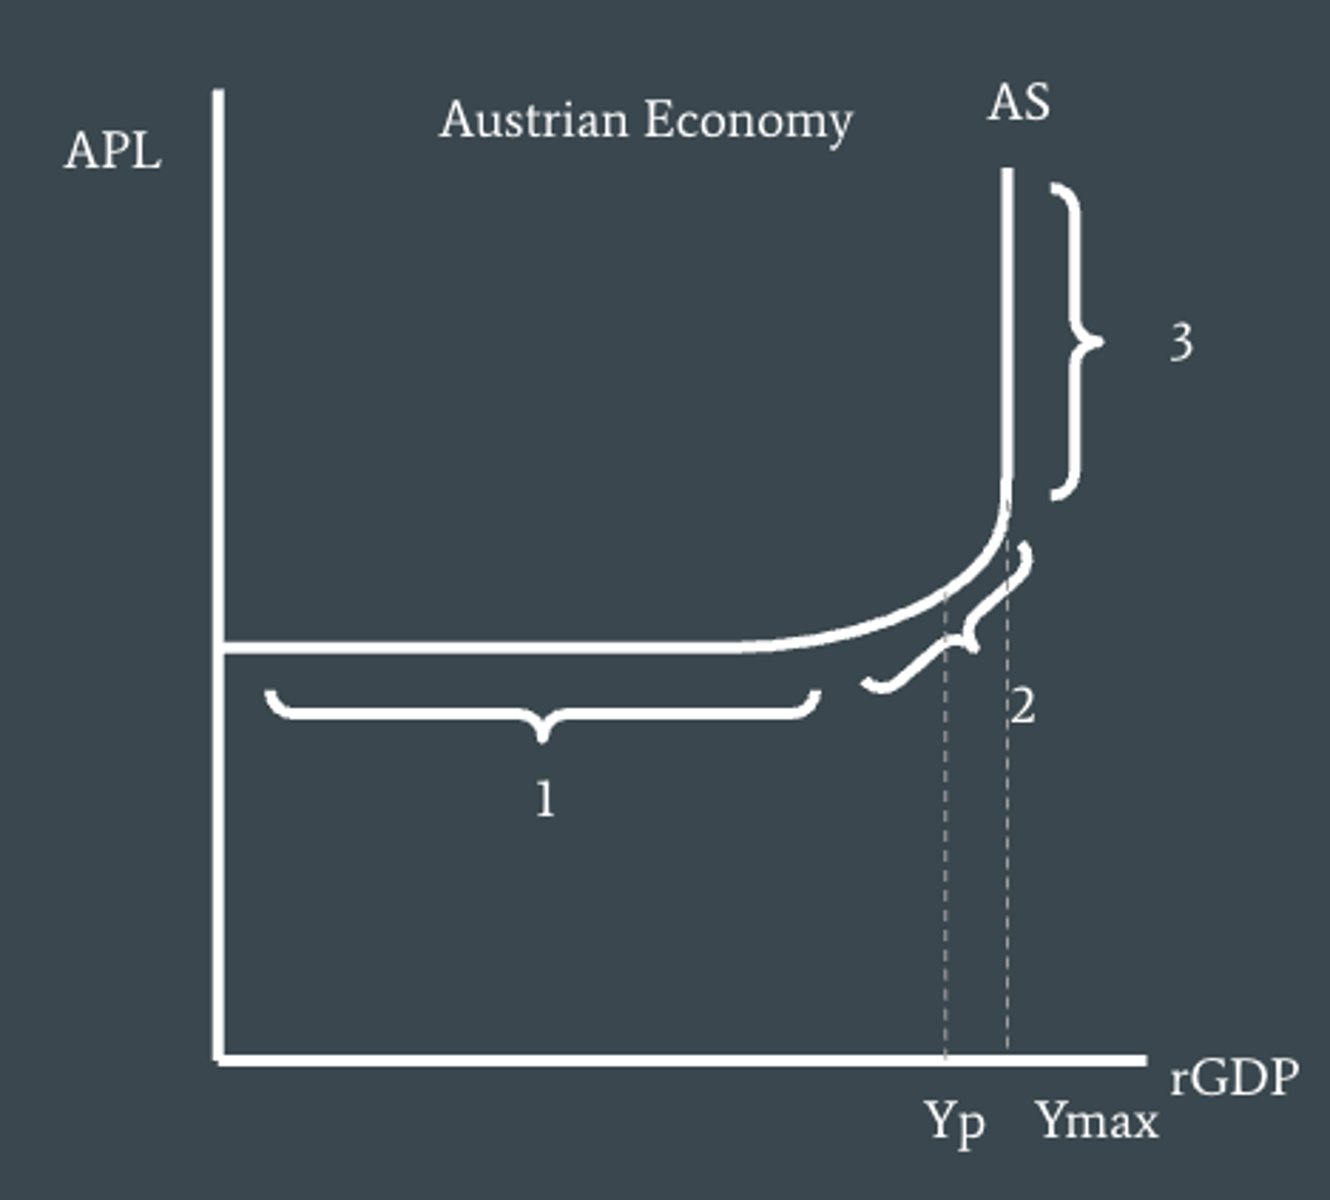
Section 1: GDP is low and unemployment of resources are high - there is a lot of spare capacity in the economy.
Section 2: Increases in rGDP are accompanied by increases in the price level. As output increases so does the use of resources which leads to no spare capacity. Wages and other resources prices begin to rise meaning costs of production increase. The only way that firms will be induced to increase output is if they can sell it at higher prices
Section 3: This section shows that output has reached its maximum. Output can no longer increase because firms are suing all resources at their absolute maximum.
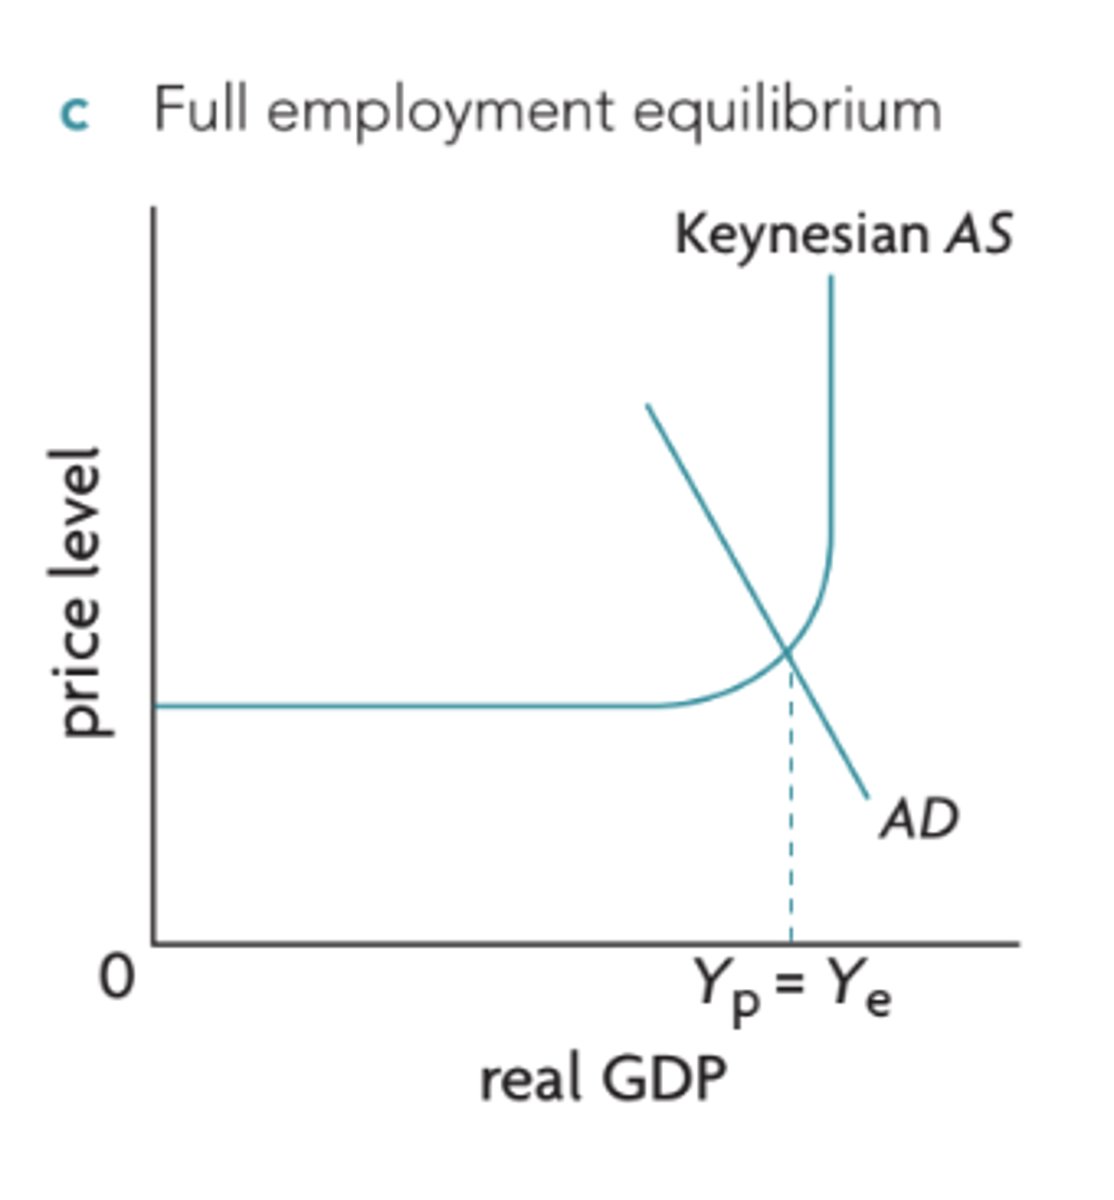
What are the 3 distinct sections of the Keynes AS curve and what do they mean?
anywhere that AD interest AS
Where is equilibrium in the Keynes model?
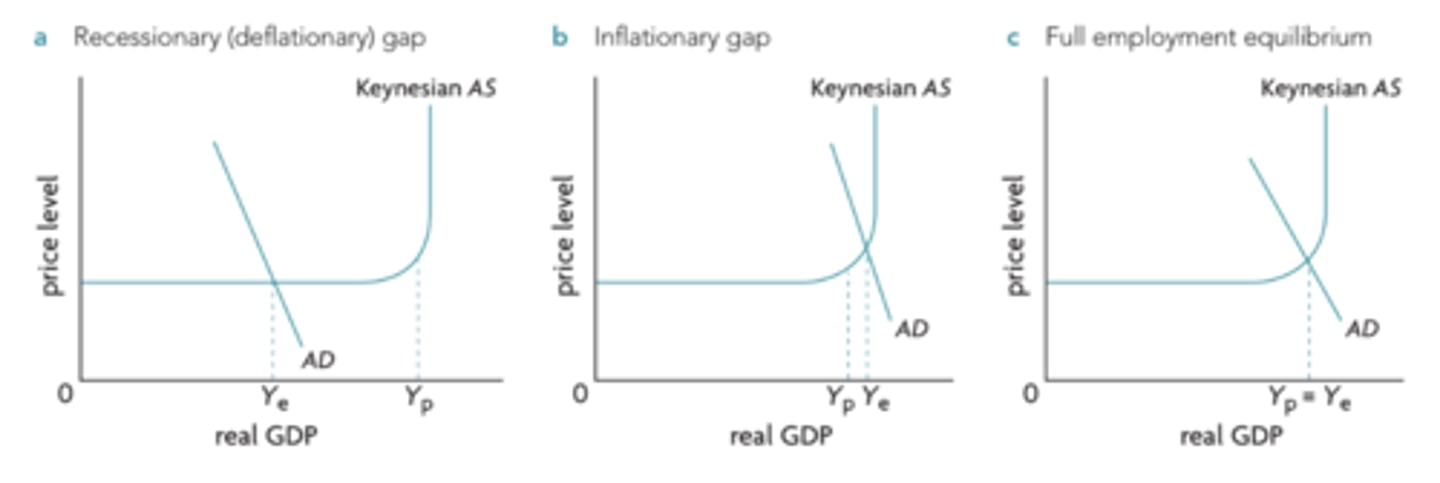
A - shows a deflationary gap where the economy produces at Ye which is less than Yp (potential GDP) with unemployment greater than NRU. Here AD is too weak to induce firms to produce at Yp
B - shows an inflationary gap where the economy is producing at Ye which is greater than Yp. Here there is strong AD, a decrease in unemployment below NRU as the economy approaches max capacity, price level has increased.
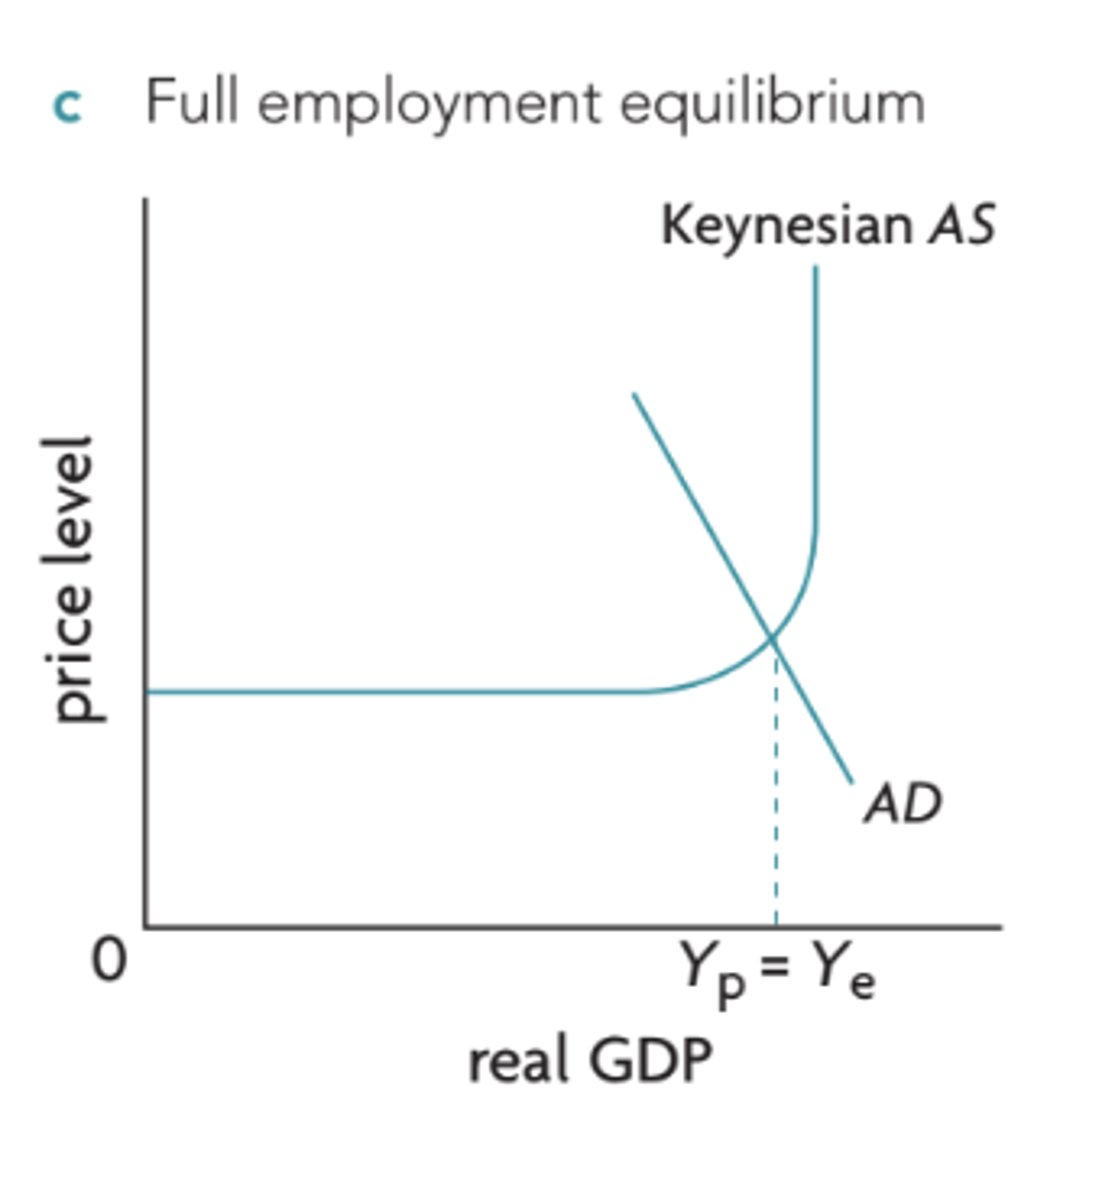
C - the economy has reached full employment equilibrium or potential output.
What are the 3 equilibrium states of the Keynes model?
1- Increases in the quantity of factors of production.
2- Improvements in the quality of factors of production.
3- Improvements in efficiency.
4- Improvements in technology.
5- Institutional changes.
What are factors that change Keynes AS or LRAS (5)?
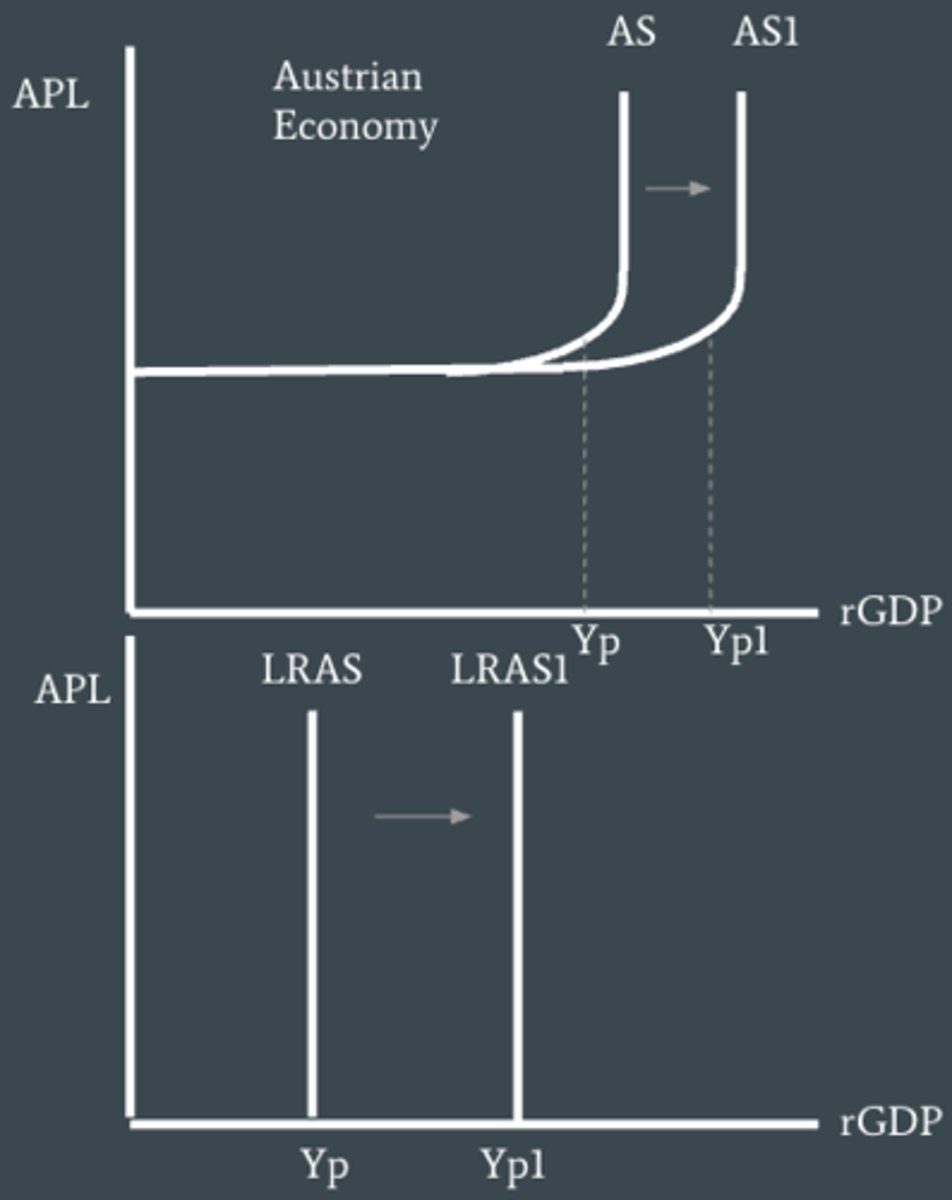
if quantity of factors of production (discovery of oil reserves) increases then it means the economy is capable of producing more rGDP shifting KAS?LRAS to the right but if the quantity decreases the shift will be to the left.
Increases in the quantities of factors of production as shifters of KAS or LRAS
Improvements in the quality of factors will shift the curves to the right. Eg - greater levels of education or skills/health means an improvement in labor resources as highly skilled and educated and healthier workers can produce more output than the same number of workers who are unskilled or less healthy.
Improvements in the quality of factors of production as shifters of KAS or LRAS
When an economy increase its efficiency in production it makes better use of its scare resources and can therefore produce at greater quantities of output. With this potential output increase and the curves would shift to the right. If the economy decreases its efficiency the curves would shift to the left.
Improvements in efficiency as shifters of KAS or LRAS
This means that the factors of production suing it can produce more output shifting the curves to the right. Eg - machines or better equipment (internet, self-checkout)
Improvements in technology as shifters of KAS or LRAS
Institutional changes can have important effects on how efficiently scare resources are used and thus output produced.
Institutional changes as shifters of KAS or LRAS
- The Mmodel automatically corrects def. gaps by returning to full employment equilibrium, while the Kmodel shows that an economy can remain (long periods of time) in an equilibrium where there is less than full employment (def. gaps), caused by insufficient AD.
- The M model says that govs should try to make markets work as freely as possible so that wages and product prices can respond to the forces of demand and supply while the Kmodel says the gov must intervene in the economy with specific measures to help it come out of deflationary gaps
- In Mmodel when AD increases it will always result in high price levels -> policies should focus on achieving long-run growth (based on efforts to shift LRAS to the right) while in the Kmodel/view increases in AD do not need to result in higher prices -> policies should focus on increasing AD = not harmless but essential to reduce def. gaps and prevent inflationary gaps.
What are some implications of the monetarist/new classical and Keynesian models?