Stats. Closed Note Assessment #3
1/77
There's no tags or description
Looks like no tags are added yet.
Name | Mastery | Learn | Test | Matching | Spaced | Call with Kai |
|---|
No analytics yet
Send a link to your students to track their progress
78 Terms
When do you use a one-sample t-test?
Compare the significant difference between a sample mean and some pre-determined value (Is it higher or lower?)
What is ‘t’ in a one-sample t-test?
Represents the number of standard errors between the sample mean and the pre-determined value.
What is ‘t’ conceptually?
Identical to the z-score of a sample mean.
What is ‘p’?
Probability that we would have gotten the results we got, even if the null hypothesis (H0) were true
What can we conclude about the population if the null hypothesis is true in a one-sample t-test?
IF the population mean of the variable is equal to our pre-determined set point, THEN we would only obtain the observed difference between the sample mean and our pre-determined value in [p*100]% of random samples.
What can be the consequence of using the one-tailed p in one’s research?
P-hacking
On the other hand, researchers always use the _______.
Two-sided p
Mean difference
The difference between the sample mean and the test value.
When do we reject the null hypothesis?
If p had been lower than 0.05
What is ‘df’ (degrees of freedom) for MOST inferential analyses?
df = n - 1
What is ‘d’ in a one-sample t-test?
Effect size
What is true when reporting non-significant results for inferential analyses?
Do not have to report mean and standard deviation.
How do you round decimals in APA format when p < .01?
Report p to three decimal places. If not, all statistics are reported to two decimal places.
What is the size effect when 0.20 ≤ d ≤ 0.50 for inferential analyses?
Small
What is the size effect when 0.50 ≤ d ≤ 0.80 for inferential analyses?
Medium
What is the size effect when d ≥ 0.80 for inferential analyses?
Large
When do you use an independent-samples t-test?
Compare how significantly different the mean is of some variable between TWO groups.
What does it mean when the results are significantly different in an independent-samples t-test?
The difference between means in our sample is SO BIG that we conclude there is probably a difference between group means in the population.
What example demonstrates a one-sample t-test?
Will the scale of happiness (1 = not happy, 5 = very happy) be higher or lower than scale midpoint of 3?
What example demonstrates an independent-samples t-test?
Is there a significant difference in the mean of parents’ household income between Donald Trump supporters and Anti-Donald Trump supporters?
What is ‘t’ in an independent-samples t-test?
The observed effect in the size of the difference between means.
When do you use a paired sample t-test (repeated-measures/dependent-measure/within subjects)?
Compare a pre-treatment mean to a post-treatment mean
Were the scores on variable #1 significantly different from scores similarly scored variable #2?
What examples demonstrates a paired-samples t-test?
Did the average UTA student do significantly better on the SAT math portion or the SAT verbal portion?
Is happiness significantly different between weekdays vs. weekends?
How do you define p in ANY situation?
If the null hypothesis were true, then we would find the effect we found (or a larger effect) in [p*100]% of random samples.
What is true for ALL t-test?
Looking at the effect of a categorical IV on a continuous DV.
When do we use correlation tests?
Measures the relationship between two continuous variables.
What example demonstrates a POSITIVE correlation?
When IQ increases, then GPA tends to increase.
What example demonstrates a NEGATIVE correlation?
When narcissism increases, then modesty tends to decrease.
Positive Correlation
When R = +1, so as y goes up, x goes up too (same direction).
Negative Correlation
When R = -1, so as y goes up, x goes down (opposite direction).
Zero correlation
When R = 0, then there is no x-y relationship.
How to evaluate the strength of the correlation?
The absolute value of ‘R’. Closer to 1, the stronger the correlation. Closer to 0, the weaker the correlation.
What is ‘df’ (degrees of freedom) in Correlation/Bivariate Correlation (regression tests?
df = n -2
What is the difference between regression and correlation?
While both correlation and regression provide the strength and direction of a relationship, regression ALSO enables prediction.
y(outcome-variable)
Represents the outcome value of the regression.
x(predictor-variable)
Represents the value of the predictor variable
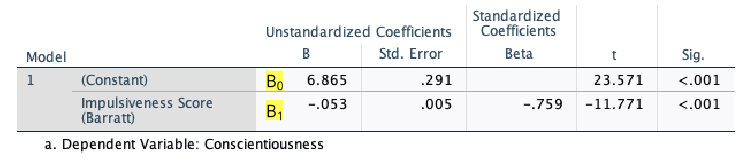
B1:slope
“slope” of the relationship between x and y

B0:constant
y-intercept—where the regression line crosses the y-axis
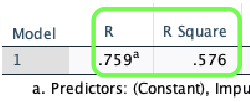
R
“Multiple Correlation Coefficient” — correlation between the observed values of the dependent variable and the values predicted by the model.

R2
% shared variance. Tells you the predictive power of the predictors on the dependent variable.
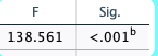
What does F represent in regression tests?
Demonstrates the significance of the model.
What is beta (β) in regression tests?
“Standardized slope” — when all the variables convert into z-scores. For every 1 SD increase in the predictor variable, the dependent variable will change by β SDs.
When do you use One-way ANOVA tests?
Testing for significant differences between two or MORE independent groups.
If F increases, then p ____.
Decreases —> Significant!
When testing between-group differences for only two groups, you can use…
Independent-samples t-test and one-way ANOVA
When p is greater than alpha, you should ___ the null hypothesis and that there is a ____ effect.
Not reject the null hypothesis; non-significant effect
What example demonstrates one-way ANOVA tests?
Is there a significant difference in average screen time between Instagram users, Snapchat users, and TikTok users?
When p is less than alpha, the analysis is said to be ______.
Significant.
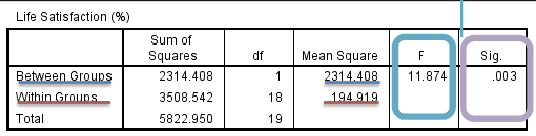
What describes ‘F’ in ANOVA tests?
Between-groups variability / Within-Group Variability
For equivalent analyses, t2 = ____.
F
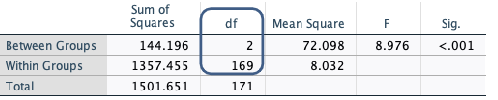
What is ‘df’ for one-way ANOVA tests?
Between groups = k -1
Within groups = n - k
What decrease F?
Adding levels to the IV that do not add between-group variance
Adding levels to the IV with small N
If F decreases, then p _____.
Increases —> Not Significant!
What is the size effect when η2 is .01 to .06 for ANOVA?
Small effect (ANOVA)
What is the size effect when η2 is .06 to .14 for ANOVA?
Medium effect (ANOVA)
What is the size effect when η2 is larger than .14 for ANOVA?
Large effect (ANOVA)
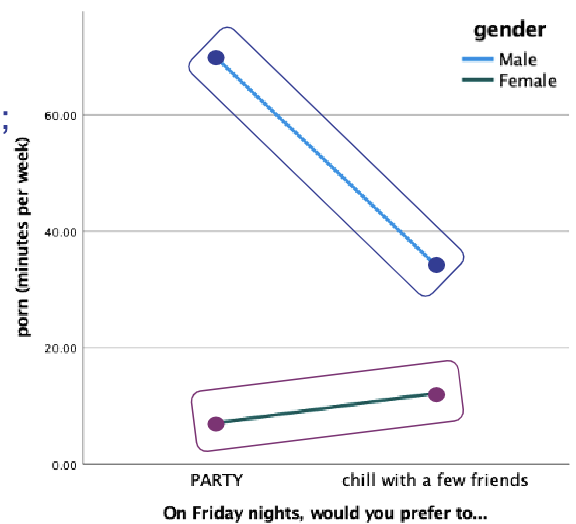
When do you 2×2 Factorial ANOVA?
Testing the interaction effect between two independent variables on a numeric outcome variable.
Main Effect
Effect of the independent variables on the outcome variable (i.e does gender (vs. sex-life) have a significant main effect on narcissism?)
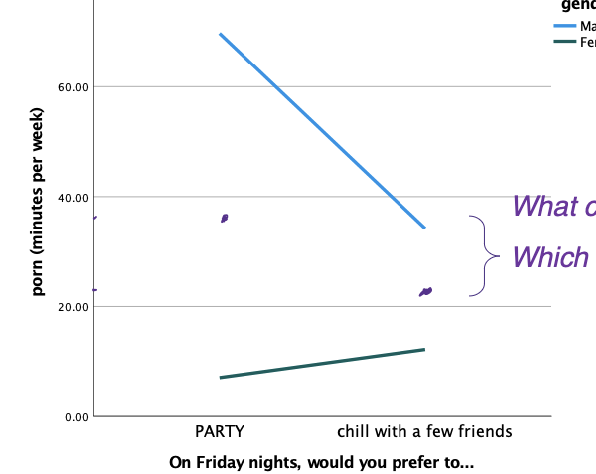
Interaction effect
How the relationship of the outcome variable and independent variable is moderated by another independent variable (i.e. the relationship between sex frequency and narcissism depends on one’s gender)
If the lines are _____, you have a _____ interaction effect.
NOT parallel; Significant
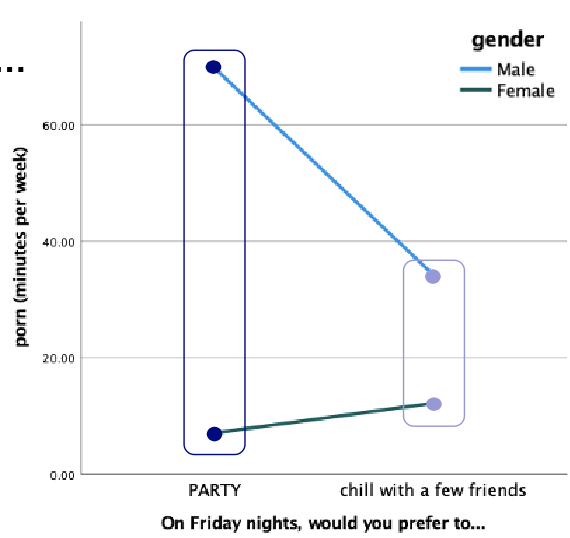
How do you read main effect #1 on a graph?
Directly above each value on the x-axis, draw a dot EXACTLY between the two lines.
How do you read main effect #2 on a graph?
Above the direct center between the two values on the x-axis, (disregards IV #1) draw a dot in the direct center of each of the two lines.
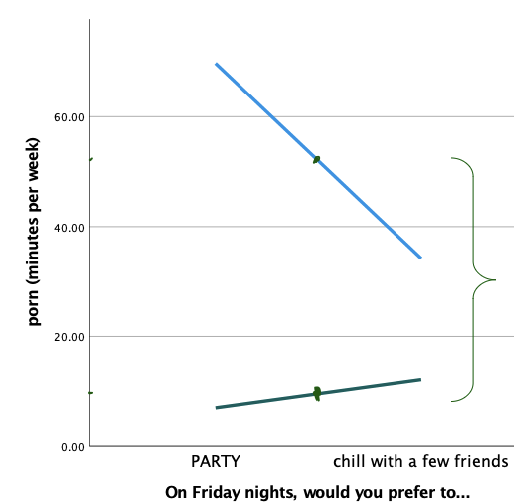
How do you read the interaction effect on a graph (Key —> Y effect at one of the x-axis categories)?
Compare line endpoints on the left vs. right
How do you read the interaction effect on a graph (X —> Y effect on one of the line categories)?
Compare the lines individually.
When describing an interaction effect, always say:
Among…; However, among…
When do you use X2 test of independence?
Testing whether two categorical variables are related or not.
What example demonstrates a X2 test?
Is belief in ghosts (yes vs. no) related to openness to legalization of cannabis (0% vs. 100%)?
What is the null hypothesis for X2 tests?
The two categorical variables are NOT related.
Base rate
Rates among that category, regardless of the other variable.
When using the ____ as your base rate, use the ____ cell to compare the mismatches between the cells and the base rates.
Bottom of the columns; first
When using the ____ as your base rate, use the ____ cell to compare the mismatches between the cells and the base rates.
Rows; second
What is the size effect when Cramer’s V is < 0.2 for X2?
Small effect (X2)
What is the size effect when Cramer’s V is 0.2 to 0.6 for X2?
Medium effect (X2)
What is the size effect when Cramer’s V is more than 0.6 for X2?
Large effect (X2)
If a cell has an expect count less than ______, then the results are _____.
5; invalid
What is the size effect when R2 < 0.08 for correlation or regression?
Small effect (R2)
What is the size effect when 0.08 ≤ R2 ≤ 0.24 for correlation or regression?
Medium effect (R2)
What is the size effect when R2 > 0.24 for correlation or regression?
Large effect (R2)