KEY ISSUES #1-4 : CHAPTER 2
1/70
Earn XP
Name | Mastery | Learn | Test | Matching | Spaced |
|---|
No study sessions yet.
71 Terms
2/3s of the world inhabitants clustered in 4 regions
Europe
Southeast Asia
South Asia
East Asia
Site and situation of population clusters
Low-lying areas with fertile soil and temperate climate
Near an ocean or a river with easy access to an ocean
Sparsely populated regions
Humans avoid clustering in certain physical environments
Dry lands
Wet lands
Cold lands
High lands
The 5 “Toos”
Too hot
Too cold
Too dry
Too wet
Too hilly
Ecumene
Permanent human settlement
Nonecumene
Uninhabited area
Arithmetic density
Total number of objects in an area
Population / land density
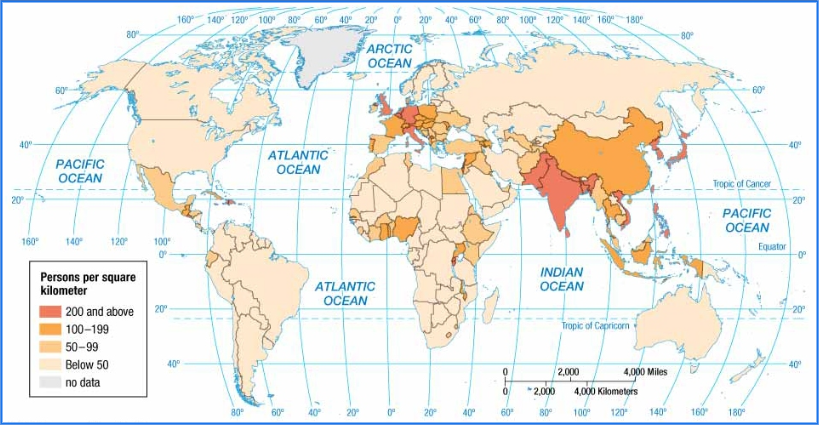
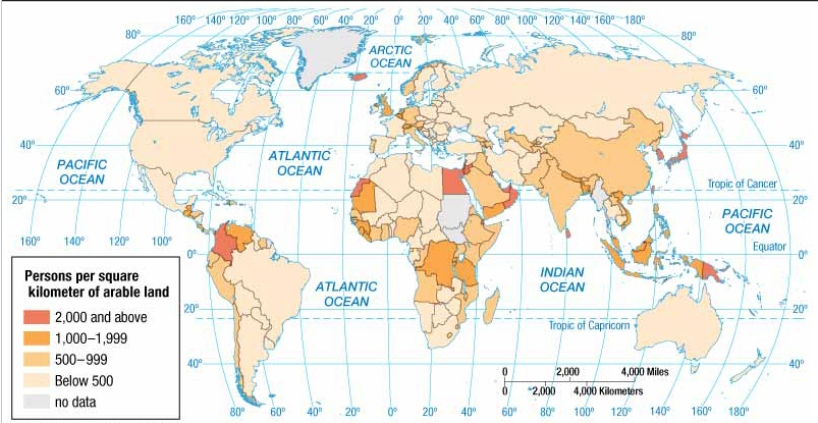
Physiological density
Number of people supported by a unit area of farmable (arable) land
Population / arable land
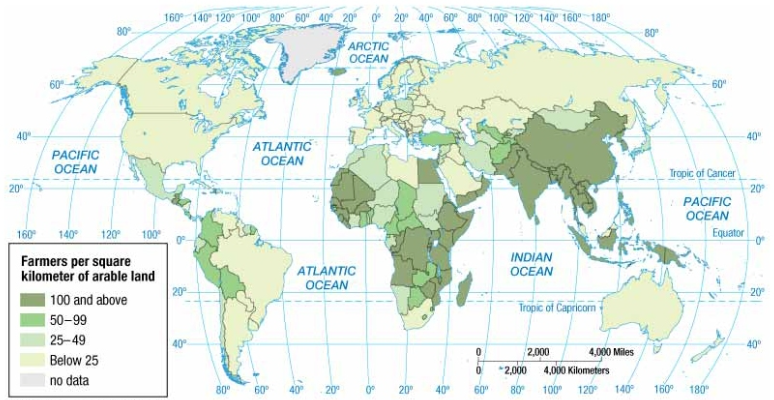
Agriculture density
Ratio of the number of farmers to amount of arable land
Population of farmers / arable land area
Crude Birth Rate (CBR)
Total number of live births in a year out of 1000 living people
Crude Death Rate (CDR)
Total number of deaths in a year out of 1000 living people
Natural Increase Rate/Rate of Natural Increase (NIR/NRI)
Percent by which a population grows in a year
((CBR-CDR) / 1000) x 100
Components of population growth - NIR
Affects the “doubling time” — number of years to double population assuming a constant rate of increase
Rule of 70: 70 / growth rate percent = “doubling time”
95% of the natural increase is clustered in developing countries
Total Fertility Rate - TFR
Average number of babies a woman will have during her child-bearing years (15-49)
TFR for the world is 2.3
Low in developed countries
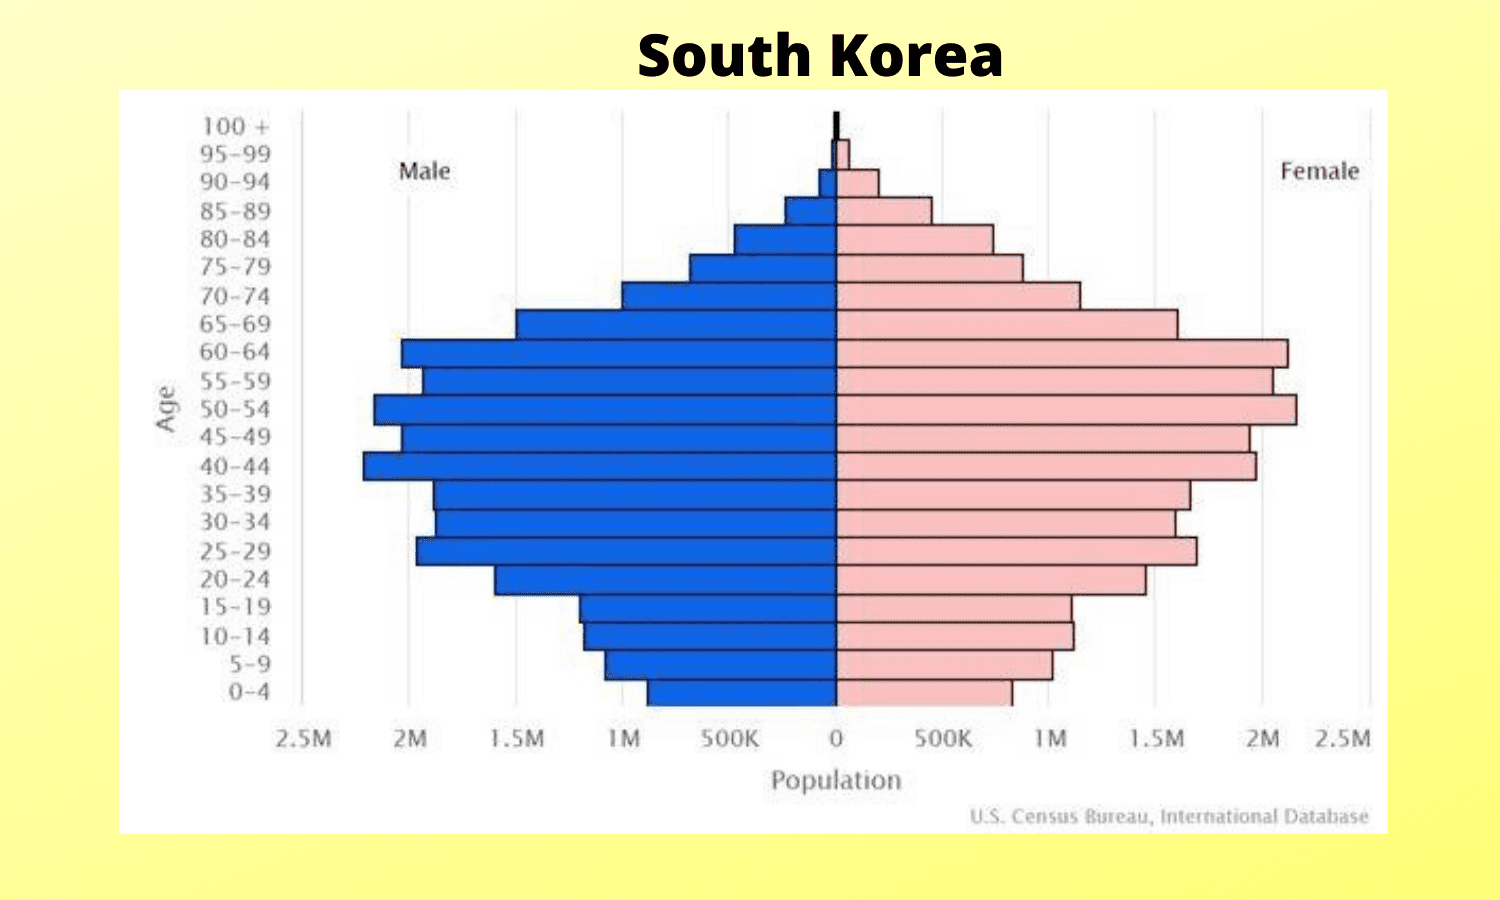
Republic of Korea is 0.78
US is 1.64
High in underdeveloped countries
Sub-Saharan Africa is 4-5+
Infant Mortality Rates - IMR
Number of deaths of infants under one year out of 1000 live births per year
Classified as per 1000 births rather than a percentage
Low in developed countries
High in Sub-Saharan Africa
Child Mortality Rate - CMR
Number of deaths in children under 5 years old out of 1000 live births per year
Dependency ratio
Measure used to indicate the ratio of people in the “dependent” (“non-working” or “unproductive”) compared to those who are working
Dependents = ages 0-14 and 65+ compared to 100 economically productive people (15-64)
Formula for Dependency ratio
(% of population under 15 + % of population aged 65+ / % of population ages 15-64) × 100
Sex ratio
Number of males per 100 females
Natural rate of 1.05 males per females (105 men per women)
Developing countries
Higher rates
Developed countries
Lower rates
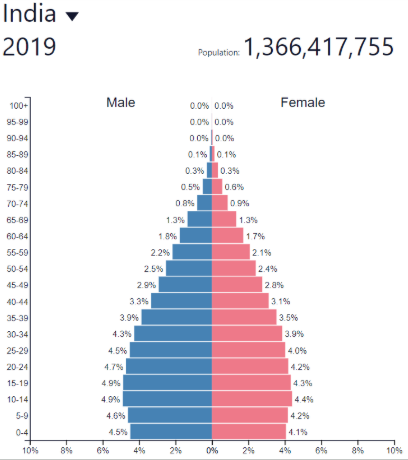
Y-Axis of population pyramids
Age cohorts usually grouped together in 5-year intervals
Youngest at the bottom, oldest at the top
X-Axis of population pyramids
Percent of males displayed to the left
Percent of females displayed to the right
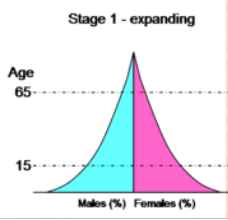
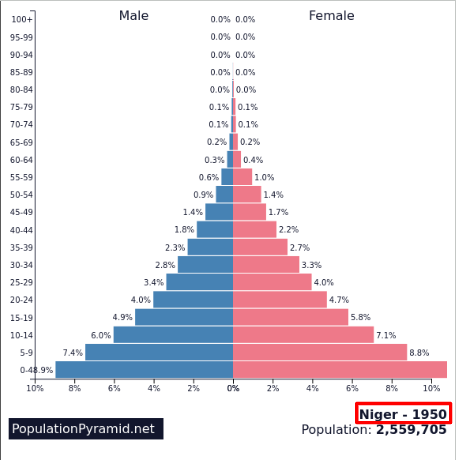
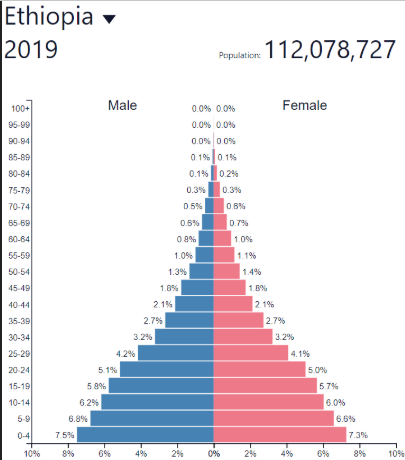
Expansive/expanding population pyramid
Wide bottom
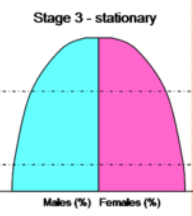
Stationary/column population pyramid
Wide bottom, rounded
Constricting/contracting population pyramid
Bottom curving into itself, rounded

Inverted/kite shape population pyramid
Japan, Italy
High fluctuating BR
High
High fluctuating DR
High

High fluctuating NIR
Low and fluctuating

High fluctuating development
Very low

High fluctuating: where?
Pre-industrial, very low income countries (LIC)
Uncontacted tribes

Early Expanding/Youthful BR
High
Early Expanding/Youthful DR
Decreasing rapidly

Early Expanding/Youthful NIR
Rapid increase

Early Expanding/Youthful development
Low (LIC)
Indicates the beginning of industrialization/increased access to healthcare

Early Expanding/Youthful: where?
LDCs like Sub-Saharan Africa, Afghanistan
Lots of other developing countries

Late expanding BR
Decreasing rapidly

Late expanding DR
Decreasing more slowly/Low

Late expanding NIR
Low and fluctuating

Late expanding development
Low to medium
"Newly Emerged Economy” (NEE)
Late expanding: where?
Post-industrial countries
Europe, North America, etc…

Low fluctuating/stable BR
Low

Low fluctuating/stable DR
Low

Low fluctuating/stable NIR
Low and fluctuating

Low fluctuating/stable development
High/very high (HDCs)
High developed country

Low fluctuating/stable: where?
Post-industrial countries
Europe, North America, etc…

Decline BR
Very low (Below the DR)

Decline DR
Low
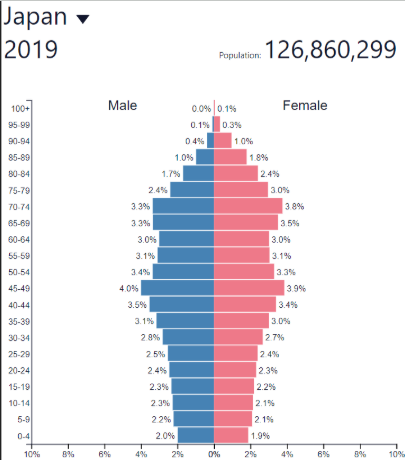
Decline NIR
Low; decreasing slowly

Decline development
Very high (HDCs)

Decline: where?
Russia, Japan
Some other European countries

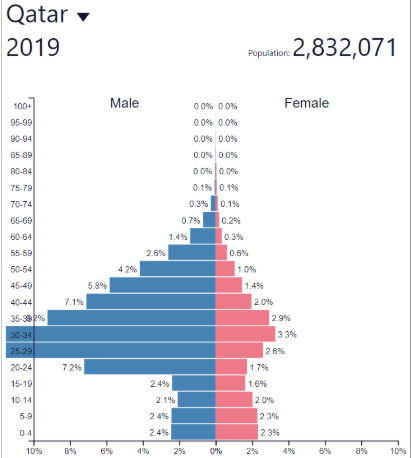
Anomalies/limitations
Some countries don’t quite fit the DTM
Population structure heavily skewed by migration
Skewed towards males?
Heavy oil producing countries around the Persian Gulf
High proportion of young male migrant workers
How do you lower BR/TFR?
Improve education and healthcare in LICs
Contraceptives
Can be pushback due to cultural/religious factors
Pro and Anti-Natalism
Countries grow too fast or are shrinking
Low birth-rates: Pro-Natalist policies
Japan
Denmark
Singapore
High birth-rates: Anti-Natalist policies
China’s One Child Policy (1970s-2015)
India’s forced sterilization (1960s-1970s)
One Child Policy : China
Couples had to apply to have a child
Men could not marry until 22, women until 20
One Child
Increased social credit score
Money, food, expanded opportunities
Second Child
Massive fines, reduction in social credit
Voluntary and involuntary sterilization
Sex selective proccesses
Aborted female babies due to a desire for a male heir
End of the One Child Policy
Officially ended in 2015 in favor of the Two Child Policy
Kinda a Three Child Policy now
India
1970s
Forced sterilization program to combat population growth
Outcry for inhumane—affective Antinatalist policy
Thomas Malthus (1798)
Claimed that the population would grow faster than the food supply would
Would cause a great famine
Critiques of Malthus
Considered too pessimistic
Thought supply of resources was fixed, not expanding
Disagree that population was not a problem
Larger population = economic growth = more food
Theory and reality
Food production increased over the last 90 years (Faster than Malthus thought)
Model predicted that the world population would quadruple over 50 years
Not even India’s population growth has surpassed food production
First criticism of Malthusian Theory
Factors have slowed population growth
Contraceptives
Education and advancements in women
Seconds criticism of Malthusian Theory
Factors that increased farming efficiency
Mechanized farming
Hybrid seeds
Chemical fertilizers
Third criticism of Malthusian Theory
New technologies and inventions
More efficient travel to deliver food to a wider range of consumers without spoiling
Refrigeration in trucks and railcars as well as homes
Tin cans to preserve food for longer periods
Neo-Malthusians
Mid 1900s
Same beliefs, but argue that technology can’t save the population