Unit 0 - AP Psychology
1/76
There's no tags or description
Looks like no tags are added yet.
Name | Mastery | Learn | Test | Matching | Spaced | Call with Kai |
|---|
No analytics yet
Send a link to your students to track their progress
77 Terms
Psychology
The study of behavior and mental processes.
Critical Thinking
Puts ideas to test by examining assumptions, appraising the source, discerning hidden biases, evaluating evidence, and assessing conclusions.
Hindsight Bias
The tendency to believe, after learning the outcome, that one would have foreseen it.
“I knew it all along!"
Overconfidence
The tendency to overestimate your knowledge and/or ability.
Confirmation Bias
The tendency to search for, interpret, favor, and recall information in a way that confirms ones preexisting beliefs or hypotheses.
Theory
A general idea on a phenomenon.
Hypothesis
Educated prediction/guess.
Falsifiable
A mark for its scientific strength.
Can it be proven false?
Operational Definitions
Exact specifications on how the research is conducted, how variables are measured, etc..
Peer Review
Reviews who can provide additional insight or perspective.
Replication
The ability to do research a second time to ensure the reliability of the results.
Sample
Selected Participants
Representative Sample
Reflects the characteristics of greater target population on key demographics.
Age, sex, race, level of education etc.
Random Sample
Every member of the target population had an equal change of being selected.
Generalizataility
The ability to apply the results of a study to a broader group of people and/or other situations/contexts.
Sampling Bias
The4 tendency for researchers to target their participants to increase the likelihood of proving their hypothesis, failure to properly gather participant as a representative sample of the population, leading to skewed results, or generalize from a few vivid but unrepresentative responses.
Case Study
A descriptive technique in which one individual or group is studied in depth in the hope of revealing universal principles.
Naturalistic Observation
A descriptive technique of observing and recording behavior in naturally occurring situations without trying to manipulate or control the situation.
Survey
A descriptive technique (not an actual method) used to obtain self-reported attitudes and behaviors of a particular group, usually by questioning the group.
Population
The entire group of individuals that a researcher wants to study and draw conclusions about.
Social Desirability Bias
The tendency for people to provide answers that may be dishonest because they are seeking approval and/or want to highlight their character strengths.
Self-Report Bias
Participants can try to affect the outcome of the research and/or be unrealistic about themselves.
They try to please the researcher or even try to purposely challenge the researchers hypothesis.
Wording Effects
How questions are worded can skew reponces.
Meta-analysis
A statistical procedure that analysis the results of multiple studies to reach an overall conclusion.
Convenience Sampling
Participants are selected because they are easily available and close to the researcher, rather than through a random or scientific selection method.
Variable
Any measurable characteristic, trait, or factor that can change or vary in a research study.
Positive Correlation
Both are affected in the same way; either both go up or both go down.
Negative Correlation
Inverse relationship; as one increases, the other decreases.
Correlation
Indicates the relationship between two sets of data.
Correlation Coefficient
The statistical measure which is noted on a scale from -1.0 to +1.0 (r-value).
Scatter Plot
Data is displayed to show correlation. The closer the correlation coefficient is to -1 or +1, the stronger the correlation.
Directionality Problem
Can’t say which caused which.
3rd Factor Problem
Could be no cause-and-effect at all.
Illusory Correlation
When we believe there is a relationship between variables where none exists.
Regression Toward the Mean
The tendency for extreme or unusual scores/events to fall back toward the average.
Experimental Methodology
The ONLY method that can establish a cause and effect relationship between variables.
Independent Variable
The researcher manipulates one variable and observes its effects.
Dependent Variable
The independent variable affects this variable.
Experimental Group
Gets the independent variable.
Control Group
Doesn’t get the independent variable.
Random Group Assignment
There must be this or the experimental design is flawed.
Single-blind Study
Participants don’t know which group they’re in.
Placebo
Fake or inert substance with known effects. Assures participants don’t know which group they’re in.
Placebo Effect
Experimental results caused by expectations alone (i.e. the participant acts or claims to feel a certain way because they think they have the drug that would cause that reaction).
Experimenter Bias
Experimenter unintentionally encourages the participant to respond in a way that supports the hypothesis. The experimenter
Double-blind Procedure
Neither the researcher nor participant is aware of group assignment.
Confounding Variables
Things that can affect your DV - other than the IV. Need to identify compounds and control them, when/if possible.
Validity
The extent to which a test or experiment measures or predicts what it intends to.
Non-experimental Methodology
Observing conclusions through things like case studies, surveys, and naturalistic observation, without manipulating variables.
Quantitative Research
A method that relies on and supplies numerical data (ex. survey, results, test scores).
Likert Scale
Give a numeral rating to measure options, attitudes, or behaviors, allowing for statistical analysis.
Qualitative Research
A method that relies on in-depth, narrative analysis that cannot be translated into numerical data (ex. case studies, structured interview responses).
Institutional Review
Approval from research institution through a board.
Informed Consent
Giving potential participants enough information about the study to enable them to choose whether or not to participant.
Informed Assent
When a parent or guardian consents for a minor.
Confidentiality
Personal information remains confidential; no personal information is published with results.
Anonymity
Researchers are unaware of any identifying information that can tie results/reponses to any particular participant.
Protection From Harm
No long-term physical or psychological harm occurs.
All animal participants must be well cared for.
If an animal has lost quality of life from participation, it should be humanely euthanized.
Debriefing
The post experimental explanation of a study, including its purpose and the use of deception and/or research confederates (if applicable).
Research Confederates
Individuals who seem to be participants but in reality are part of the research team.
Structured Interview
All people interviewed got the same set of questions.
Descriptive Statistics
Numerical data used to measure and describe characteristics of groups, including measures of central tendency and variation. These can be represented through the use of histograms or graphical representations of data points organized into user-specific ranges.
Mean
Average of scores
Median
In a distribution of scores, the number that falls in the middle numerically.
Mode
In a distribution of scores, the number that occurs the most frequently.
Percentile Rank
The percentage the scores that are less than or equal to a given score.
Range
Distance from highest and lowest scores.
Standard Deviation
The average distance from the mean for a set score; shows you the spread of scores.
Measures of Central Tendency
Describes the “typical” or middle point of a data set, like the mean, median, or mode.
Measures of Variability
Indicates how spread out the data points are from that sentral point including range and standard deviation.
Normal Curve/Distribution
Represented by a symmetrical bell shaped curve that describes the destitution of many types of data where most scores fall in the middle and fewer scores fall in the extremes.
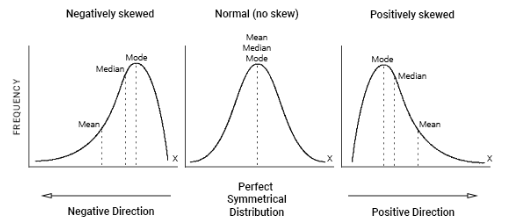
Skewed Destitution
Represented as an asymmetrical curve, with more scores falling to one end or the other.
Bimodal Distribution
A type of statistical distribution that shows two distinct peaks in a data set.
Positive Skew and Negative Skew
Inferential Statistics/Data
Numerical data that allow one to generalize/inter sample data the probability of something being true of a larger population.
Statistical Significance (p-value)
The degree to which you are sure that the dependent variable was a result of exposure to the independent variable.
To be considered statistically significant, you want to be as close as you can to the p-value of 0.05 (or less).
5% likely a result of chance.
95% sure that the IV caused the DV.
Effect Size
Tells you how meaningful the relationship between two variables or difference between two groups is.