Measuring economic activity
1/22
There's no tags or description
Looks like no tags are added yet.
Name | Mastery | Learn | Test | Matching | Spaced | Call with Kai |
|---|
No analytics yet
Send a link to your students to track their progress
23 Terms
national income
measures economic activity within country
main method of determining economic activity = measuring rate of change of output
nominal GDP
GDP = total value of final goods produced within a country over a time period, regardless of who owns the FOP
nominal GNI
GNI = total income received by residents of a country, regardless of where they live
more relevant metric
basically nominal GDP + net income earned abroad
circular flow of income
injections add money to circular flow and increase its size
increased gov spending (G)
increased investment (I)
increased exports (X)
leakages remove money and reduce its size
increased savings by households (S)
increased taxation by government (T)
increased import purchases (M)
high levels of interdependence between all these components
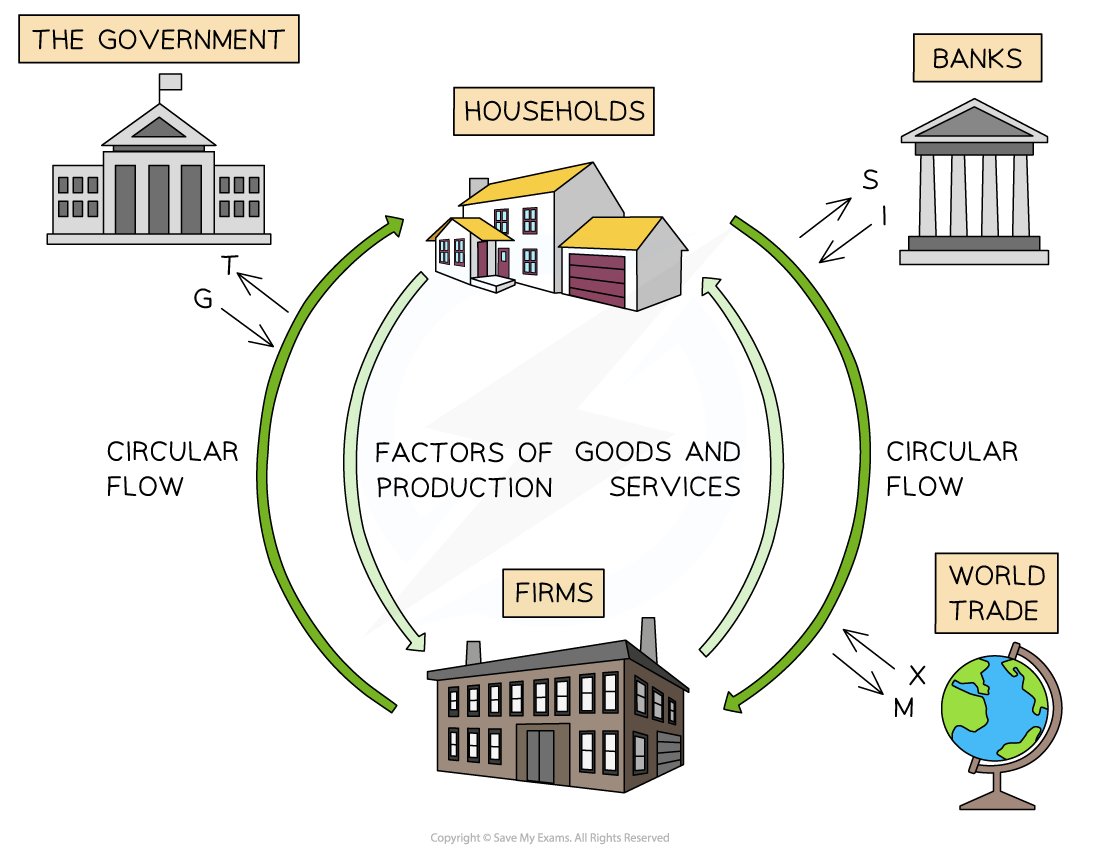
how the flow of income is equal to the expenditure flow & value of output flow
income flow from firms to houses = expenditure flow from houses to firm
household incomes from selling FOP = expenditures by households on goods and services
these 2 flows are also equal to the value of the goods/servies or the value of the total output produced by firms
size of changes affecting size of economy
injections > withdrawals = economic growth
withdrawals > injections = economic decline
changes to any factors that influence gov spending, investment, exports, etc will increase/decrease size of circular flow of income
calculating national income
all 3 approaches should provide the same figure
value of finished goods is equal to expenditure paid to acquire them
value of GDP = monetary worth
volume of GDP = physical number
expenditure approach in calculating national income
adds up value of all expenditures in the economy in a year
consumption (C), gov spending (G) , investment (I) exports (X), imports (M) and net exports (X-M)
nominal GDP = C + I + G + (X-M)
components of expenditure approach
consumption: total spending on goods by consumers in an economy
investment: total spending on capital goods by firms
gov spending: total spending by gov in economy
doesn’t include transfer payments
net exports: difference between revenue gained from selling goods abroad and expenditure on goods from abroad
income approach in calculating national income
adds up payments for the FOP in a year
includes wages (W), rent (R), interest from capital (I) and profit (P) from entrepreneurship
national income = W + R + I + P
output approach in calculating national income
adds up value of all finished goods produced within the economy each year
real GDP and GNI
nominal means the metric hasn’t been adjusted for inflation, so it’s the actual value of all goods produced in an economy in a 1-year period
real GDP & GNI is adjusted for inflation
they’re calculated using a price deflator, GDP deflator, used to convert GDP/GNI from current prices to constant prices
Real GDP = Nominal GDP / GDP deflator x 100
real GDP/capita & GNI/capita
real GDP or GNI/capita = Real GDP or GNI/ the population
shows mean wealth of each citizen in country
provides insight on standard of living as it shows how much of the total output in an economy corresponds to each person on avg
PPP (purchasing power parity)
PPP is a conversion factor, calculates relative purchasing power of different currencies
shows number of units of a country’s currency that are required to buy a product in the local economy, as 1$ would buy that product in the US
helps make a more accurate standard of living comparison between countries
national income statistics to measure well-being
national income statistics are useful for comparing countries
allow judgments to be made about relative wealth and standard of living within each country
allow comparisons to be made over same or different time periods
real GDP is a better comparison than nominal GDP
one country may have higher rate of economic growth but much higher rate of inflation
real GDP/capita is better than real GDP because takes into account population differences
real GNI/capita is more realistic for analysing income available per person than GDP/capita
limitations of using GDP Data to compare living standards between countries over time
lack of information on inequality
distribution of income in an economy is an average (GDP/capita)
differences in SOL within same country can be significant
quality of goods
GDP provides no information on fluctuations of quality of goods
if quality worsens but prices are lower, SOL is judged to have increase, while poor quality may have actually decreased it
doesn’t include unpaid work
if unpaid work was included GDP/capita would be higher
differences in hours worked
GDP data doesn’t capture amount of time taken to produce the GDP/Capita
in 1 country where it takes less time to generate income than in a similar country, SOL should be higher
environmental factors
doesn’t capture environmental and health impacts of generating income within a country
if there are fewer externalities in generating income in 1 country, SOL should be higher
the business cycle
changes to real GDP that occur in the economy over time
it’s the actual growth
real GDP fluctuates above and below the long-term trend rate of growth
points in the cycle: peak, expansion, contraction, trough
peak: maximum real GDP
expansion: positive growth in real GDP, unemployment falling, general price level rising
contraction: negative growth in real GDP, growing unemployment of resources, falling price levels
trough: minimum real GDP
flow of real GDP can be moderated by gov intervention
characteristics of a recession (contraction lasting for more than 6 months)
occurs when there are 2 or more consecutive quarters of negative economic growth
increased unemployment
increasing negative output gap and spare production capacity
low confidence for firms/households
low inflation
increase in gov expenditure leading to a budget deficit
characteristics of a boom
increasing rates of economic growth
decreased unemployment
reduction of negative output gap or creation of positive gap, spare capacity reduced
high confidence, more risky decisions
increasing inflation
improvement in government budget as tax revenue rises and expenditure falls
alternative measures of well-being
OECD Better life index
Happiness index
Happy Planet index
GDP focuses on production, happiness includes health, relationships, environment, education etc
national income statistics present more positive data while national happiness surveys present more normative data
Easterlin Paradox: happiness and increases in income have a direct relationship up to a point, beyond that point relationship is less evident
OECD better life index
has 11 variables which it considers essential to well-being
housing: living conditions and proportion of household expenditure spent on housing
income: net income and net wealth
jobs: job security, average earnings and unemployment rate
community: social support networks
education: quality of education
environment: environmental health, pollution
civic engagement: voter turnout and community involvement in legislation
health: quality of healthy, life expectancy
life satisfaction: overall satisfaction of life
safety: how safe people feel walking alone at night
work-life balance: percentage of employees working long hours, amount of time for leisure
happy planet index HPI
measures sustainable wellbeing, how efficiently countries deliver long happy lives using the earths resources sustainably
measures country’s progress using: Wellbeing, life expectancy, ecological footprint
HPI score = wellbeing x life expectancy / ecological footprint
happiness index
survey that measures happiness in 10 different areas of a persons life:
psychological well being
health
time balance
community
social support
education, art, culture
environment
governance
financial security
work