Topic 4 Interspecies Interactions
1/43
There's no tags or description
Looks like no tags are added yet.
Name | Mastery | Learn | Test | Matching | Spaced |
|---|
No study sessions yet.
44 Terms
Parasitoid
An organism that lives within and consumes the tissues of a living host, eventually killing it
Mesopredators
Relatively small carnivores that consume herbivores
Top Predators
Predators that typically consume both herbivores and mesopredators
Biological Control
Introductions of one species to help control the abundance of another species
Huffaker’s Predator-Prey Lab Experiment
To determine the factors that cause predator–prey cycles, Huffaker manipulated the number and distribution of oranges in a tray filled with oranges and rubber balls
He also added posts that only the prey species were able to climb
The prey drifted from the posts to colonize new oranges
Because the predators had to walk from one orange to another and avoid Vaseline barriers, the prey stayed one step ahead of the predators
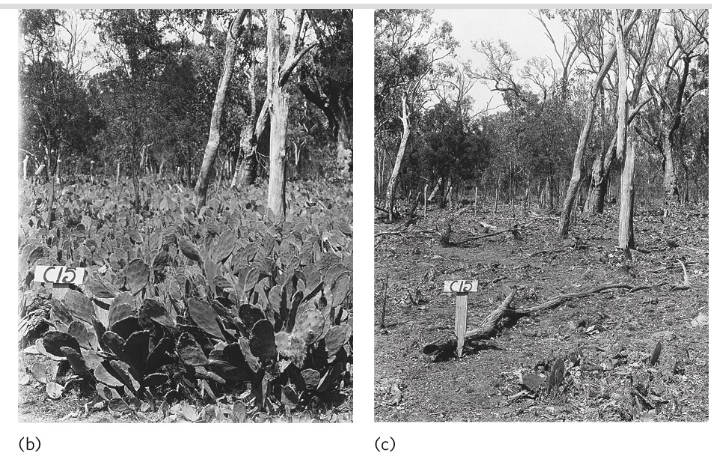
Prickly Pear Cactus vs Catus Moth
Following the import of the cactus from South America to Australia, its numbers increased dramatically
To reduce the abundance of the cactus, the cactus moth was introduced to Australia from South America
(A) A site in Queensland, Australia, in 1926, before the introduction of the moth
(B) The same site 3 years after the introduction of the moth
Lotka–Volterra Model
A model of predator–prey interactions that incorporates oscillations in the abundances of predator and prey populations and shows predator numbers lagging behind those of their prey
Equilibrium Isocline
The population size of one species that causes the population of another species to be stable
Also known as Zero Growth Isocline
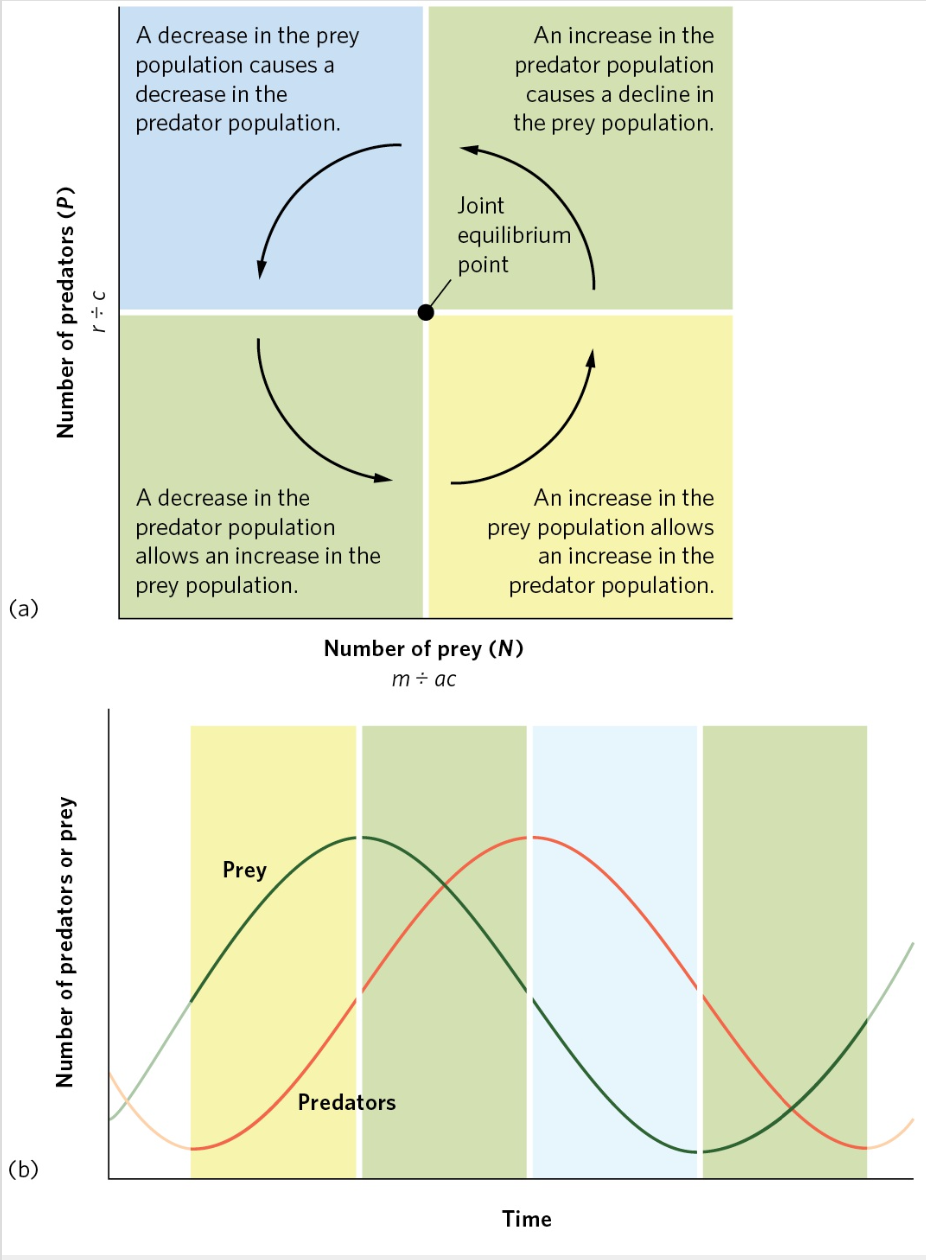
Predator-Prey Oscillations
(A) With a decline in predators, prey can increase in abundance
The increase in prey then provides more food for predators; this allows predators to increase their population size through reproduction
As predators grow more numerous, they start to kill prey at such a high rate that the prey population begins to decline
A decline in available prey reduces the survival and reproduction of the predator population, which starts to decline
(B) Over time, both populations cycle up and down in abundance, with predator abundance lagging behind prey abundance
Functional Response
The relationship between the density of prey and an individual predator’s rate of food consumption
Type I Functional Response
A functional response in which a predator’s rate of prey consumption increases in a linear fashion with an increase in prey density until satiation occurs
Type II Functional Response
A functional response in which a predator’s rate of prey consumption begins to slow down as prey density increases and then plateaus when satiation occurs.
Type III Functional Response
A functional response in which a predator exhibits low prey consumption under low prey densities, rapid consumption under moderate prey densities, and slowing prey consumption under high prey densities
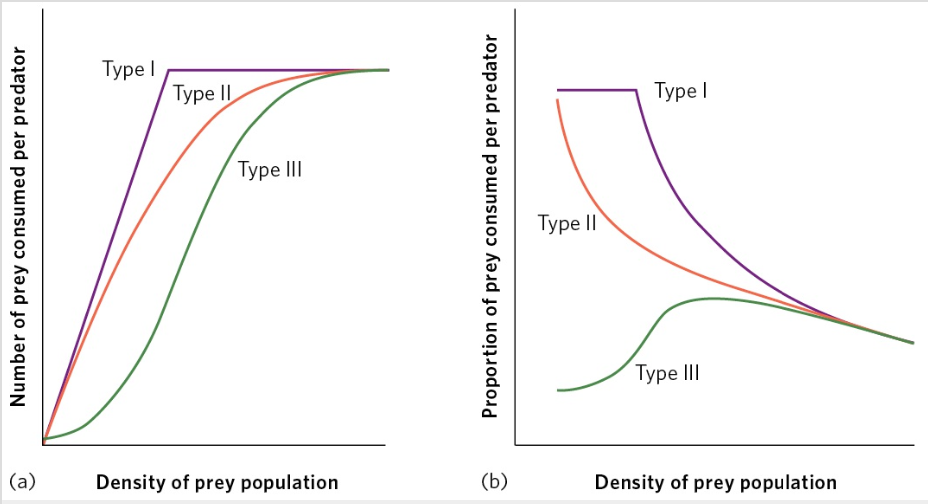
Functional Responses of Predators
(A) When we consider the number of prey consumed per predator, we see that a type I response exhibits a linear relationship between the density of the prey population and the number of prey a predator consumes until eventually the predator is satiated
In contrast, a type II response exhibits a slowing rate of prey consumption as prey density increases
the slowing rate is due to an increase in the time spent handling the additional prey
Eventually, the predator achieves satiation
A type III response also shows a slowing rate of consumption when prey density is high
In addition, it exhibits the effect of a predator learning a search image for prey as the prey density increases across the lower range
(B) When we consider the proportion of prey consumed, we see that the type I response results in a constant proportion of prey being consumed—prior to satiation—as prey density increases
A type II response results in a decreasing proportion of prey being consumed
Finally, a type III response initially causes an increased proportion of prey consumed, followed by a decrease
Numerical Response
A change in the number of predators through population growth or population movement due to immigration or emigration
Crypsis
Camouflage that either allows an individual to match its environment or breaks up the outline of an individual to blend in better with the background environment
Warning Coloration
A strategy in which distastefulness evolves in association with very conspicuous colors and patterns
Also known as Aposematism
Batesian Mimicry
When palatable species evolve warning coloration that resembles unpalatable species
Müllerian Mimicry
When several unpalatable species evolve a similar pattern of warning coloration
Chemical Defenses
Ex = skunks spray potential threats with foul-smelling chemicals from posterior glands
Ex = when monarch butterfly caterpillars feed on milkweed, they store some of the milkweed toxins in their body, which make the butterfly very distasteful to predatory birds
Ex = Bombardier beetlescontain two glands, each of which makes a distinct chemical
When agitated, the beetle mixes these two chemicals, causing a reaction that makes the liquid approach 100°C.
They shoot the boiling hot liquid out of their abdomen, causing pain or death to small predators
Zombie Carpenter Ants
Carpenter ants that become infected by a fungus crawl down from the canopy and attach themselves to the underside of a leaf by biting the leaf vein and then dying
After death, a spore-producing stalk grows out of the ant’s head and releases its spores into the environment
Chytrid Fungus
Surveys of amphibians in Central America demonstrated that the fungus was spreading from the northwest to the southeast
Surveys of amphibians at the El Copé site detected a sharp decline in amphibians, both in species that are active during the day and species that are active at night
Emerging infectious disease and the loss of biodiversity in a Neotropical amphibian community
Horizontal Transmission
When a parasite moves between individuals other than parents and their offspring
Vertical Transmission
When a parasite is transmitted from a parent to its offspring
Vector
An organism that a parasite uses to disperse from one host to another
Reservoir Species
Species that can carry a parasite but do not succumb to the disease that the parasite causes in other species
Susceptible-Infected-Resistant (S-I-R) Model
The simplest model of infectious disease transmission that incorporates immunity
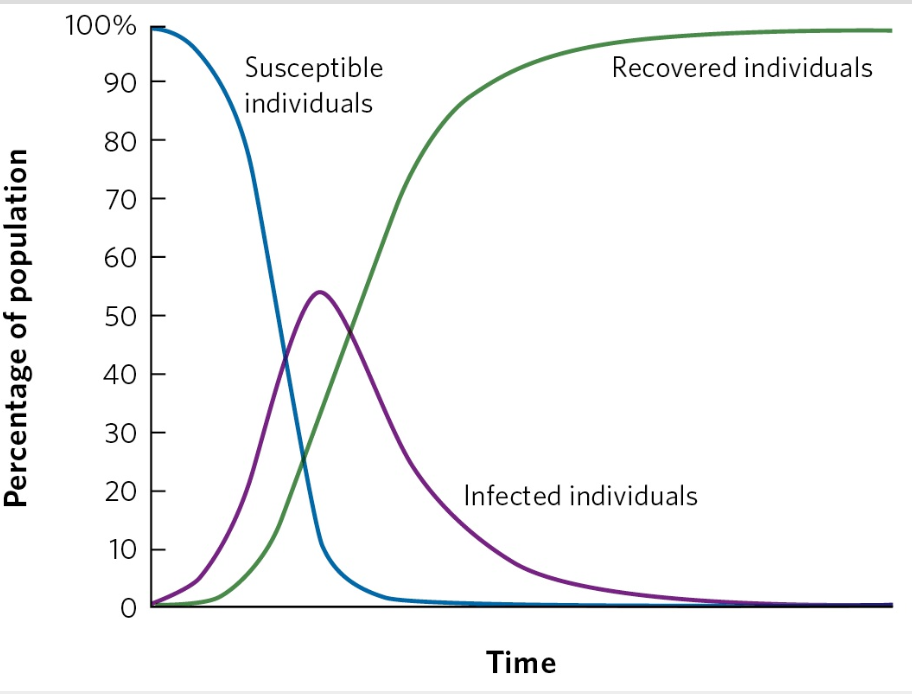
The Dynamic of an Infection Over Time
In the basic S-I-R model, all individuals in a population are initially susceptible
When the infection is introduced at the beginning of the time period, there is an initial rapid growth in the number of infected individuals
As some infected individuals recover and become resistant, there are fewer susceptible individuals left to infect, so the number of infected individuals declines
European Rabbits & Myxoma Virus
After being introduced to Australia in 1859, the rabbit population exploded and consumed nearly all the vegetation that was needed by ranchers for raising sheep
In 1950, the government tried a new approach
A virus known as Myxoma had been discovered in South American rabbits
Turned out to be highly lethal to European rabbits; an infected rabbit dies within 48 hours
In rabbit populations that had never been exposed to the virus, nearly all infected rabbits died
However, a small percentage of resistant rabbits survived and passed on their resistant genes to the next generation
At the same time, selection favored less lethal virus strains, which could reproduce and get transmitted by mosquitoes that only feed on live rabbits
Since rabbit populations evolved higher resistance and viruses evolved to be nonlethal, rabbit populations that experienced more epidemics of the disease experienced less mortality
Resource
Anything an organism consumes or uses that causes an increase in the growth rate of a population when it becomes more available
Limiting Resource
a factor that restricts the growth, reproduction, or survival of a population in an ecosystem due to its limited availability
Intraspecific Competition
Competition among individuals of the same species
Interspecific Competition
Competition among individuals of different species
Liebig’s Law of the Minimum
Law stating that a population increases until the supply of the most limiting resource prevents it from increasing further
Competitive Exclusion Principle
The principle that two species cannot coexist indefinitely when they are both limited by the same resource
Asymmetric Competition
one individual or species has a greater impact on resource consumption and competition than another, leading to unequal resource distribution and effects on the competing organisms
Exploitative Competition
Competition in which individuals consume and drive down the abundance of a resource to the point that other individuals cannot persist
Interference Competition
When competitors do not immediately consume resources but defend them
Allelopathy
A type of interference that occurs when organisms use chemicals to harm their competitors
Apparent Competition
When two species have a negative effect on each other through an enemy, such as a predator, parasite, or herbivore
Gause’s Experiment on Paramecia
When Paramecium aurelia was raised under low or high food supply, the population size—measured in terms of the total volume of protist cells—grew rapidly at first and then slowed as they reached their carrying capacity
When twice as much food was provided, the species achieved a population size that was twice as large
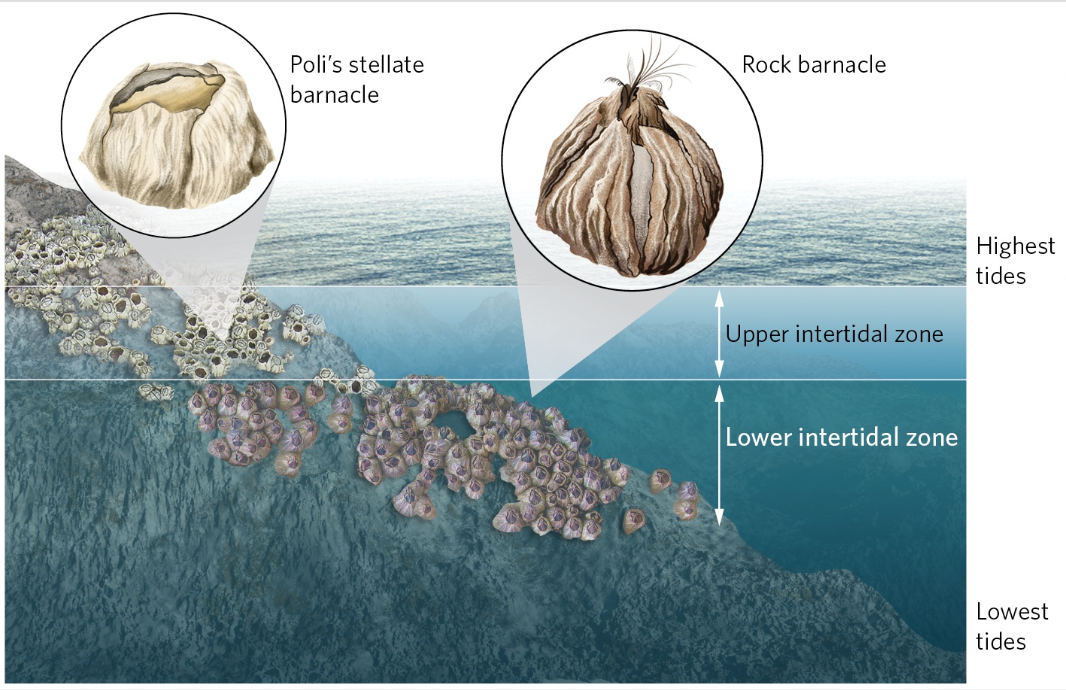
Connell’s Competition Between Barnacles
In Great Britain, Poli’s stellate barnacle lives in the upper intertidal zone because it is more resistant to desiccation and it cannot compete successfully in the lower intertidal zone
In contrast, the rock barnacle lives in the lower intertidal zone because it is the superior competitor but is not resistant to the desiccating environment of the upper intertidal zone
Describe how the outcomes of specific interspecific interactions can range between being positive and negative
Positive → mutualism, commensalism, facilitation
Negative → competition, predation, herbivory, parasitism
How do Mutualists Deal with Cheaters?
through mechanisms that penalize or limit the cheaters' access to benefits while maintaining the overall benefits of the mutualism for the cooperative species
Ex = Host Sanctioning, Selective Partner Choice, Community-Level Effects