Stats 2 multiple choice questions
1/54
There's no tags or description
Looks like no tags are added yet.
Name | Mastery | Learn | Test | Matching | Spaced |
|---|
No study sessions yet.
55 Terms
A variable used to represent a categorical variable in regression by coding it numerically (usually 0 or 1)
example:
Gender Male = 1, Female = 0
In a regression predicting salary
Salary = 30,000 + 5,000 (Gender)
Being male adds $5,000 to the salary compared to being female
a. Dummy variable
b. Collinearity Variable
c. Interaction Variable
d. Variance inflation factor
e. Parsimony variable
a. Dummy variable
Not an actual type of variable, this usually refers to the problem of multicollinearity when two or more predictors in a regression are highly correlated
Example
X1 = years of experience
X2 - age
high correlation between X1 and X2 = multicollinearity
a. Dummy variable
b. Collinearity Variable
c. Interaction Variable
d. Variance inflation factor
e. Parsimony variable
b. Collinearity Variable
A variable that captures how the effect of one predictor depends on another. Often created by multiplying two predictors together
Example:
Education x Gender
Regression
Salary = 20,000 +2,000(education) + 5,000(Gender) + 1,500(education x gender)
The effect of education on salary is different for men and women
a. Dummy variable
b. Collinearity Variable
c. Interaction Variable
d. Variance inflation factor
e. Parsimony variable
c. Interaction Variable
A measure used to detect multicollinearity in regression. It quantifies how much the variance of a regression coefficient is inflated due to correlation with other predictors
example:
If VIF for X1 = 10, then the coefficient estimate for X1 is unstable because X1 is highly correlated with other predictors
a. Dummy variable
b. Collinearity Variable
c. Interaction Variable
d. Variance inflation factor
e. Parsimony variable
d. Variance inflation factor
A variable that keeps the mode simple and efficient, avoiding unnecessary complexity. This relates to the principle of parsimony (Occam’s Razor) in model building
Example:
Instead of including dozens of tiny predictors for predicting test scores, you might just include study hours and class attendance because they explain most of the variance
a. Dummy variable
b. Collinearity Variable
c. Interaction Variable
d. Variance inflation factor
e. Parsimony variable
e. Parsimony variable
Whats the error degrees of freedom formula
n - (k+1)
What is the response variable
the outcome measured, observed or recorded in a study or experiment
Example from the gold ball study: travel distance of the gold ball in yards
What is the factor
is the variable that the researcher manipulates, controls, or selects to determine its effects on the response variable.
often has different Levels
example from golf ball study: Type of golf ball (Type A, Type B, Type C)
example: storage temperature (0 degrees, 10 degrees, 20 degrees)
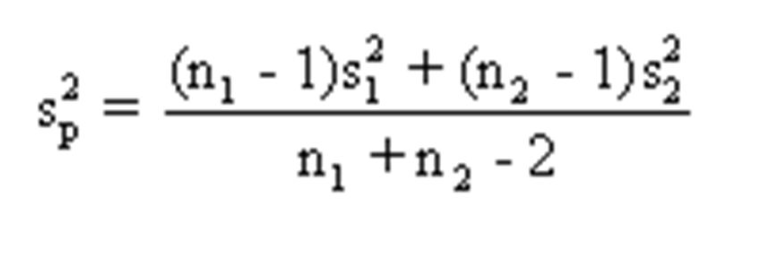
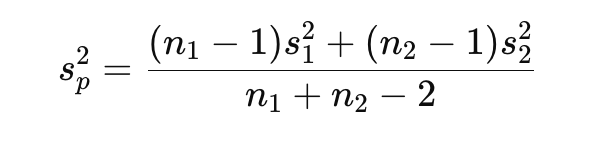
what is the pooled variance estimate formula
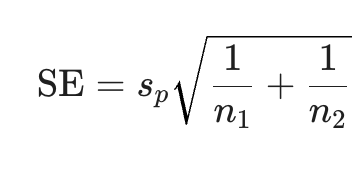
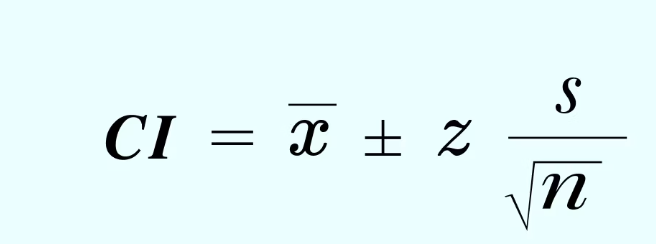
Whats the SE formula
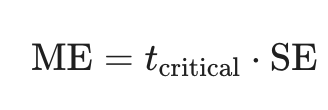
Whats the ME formula
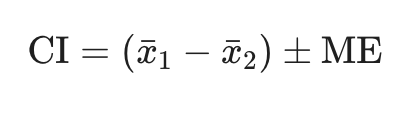
Confidence interval formula with variance
Decreased sales due to a fire at a meat packing plant is an example of a(n) ______ component
a. trend
b. cyclical
c. seasonal
d. irregular
d. irregular
Why:
irregular = unexpected, unpredicted events that disrupt normal patterns
A company has recorded its annual online sales for the past 10 years and notices that sales increase every single year as more customers shift to online shopping and the company expands its digital presence. This long-term upward movement represents which component of a time series
a. trend
b. cyclical
c. seasonal
d. irregular
a. trend
why:
Trend = long-term increase or decrease over many years
An economist notices that employment levels trend to rise and fall approximately every 5-7 years, following expansions and contractions in the national economy. These multi-year fluctuations represent which component of a time series?
a. trend
b. cyclical
c. seasonal
d. irregular
b. cyclical
Why:
cyclical = multi-year up-and-down movements tied to the economic cycle
A retail store observes that sales spike every November and December due to holiday shopping and drop every January. These predictable, repeating patterns occur every year. What type of time series component does this represent?
a. trend
b. cyclical
c. seasonal
d. irregular
c. seasonal
Why:
Seasonal = regular patterns that repeat every year at the same time (monthly, quarterly, holiday-related)
In exponentially smoothed time series, the smoothing constant w is chosen on the basis of how much smoothing is required. In general, which of the following statements is true?
a. A small value of w, such as w = 0.1, results in very little smoothing, while a large value, such as w = 0.9, may result in excessive smoothing
b. A small value of w, such as w = 0.1, results in excessive smoothing, while a large value, such as w = 0.9, results in very little smoothing
c. A small value of w, such as w = 0.1, and a large value, such as w = 0.9 may both result in very little smoothing
d. A small value of w, such as w = 0.1, and a large value, such as w = 0.9 may both result in excessive smoothing
b. A small value of w, such as w = 0.1, results in excessive smoothing, while a large value, such as w = 0.9, results in very little smoothing
Suppose the average loan size for the 229 loans is $25,000 with a standard deviation of $3,000. Calculate the 95% confidence interval estimate of the population mean loan size for all borrowers.
95% confidence interval = 1.96
answer: (24,875.46, 25,124.54)

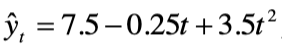
A quadratic equation fitted to annual time series data is, where t = 1 for 1997, t = 2 fro 1998, etc. The forecasted value for 2004 is:
a. 3.25
b.10.75
c. 28.0
d. 229.5
d. 229.5
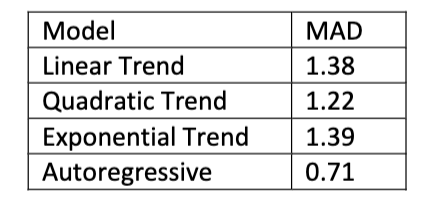
The following is the list of mean absolute deviation (MAD) statistics for each of the four models that have been estimated for a particular time series
Based on the MAD criterion, the most appropriate model is
A. linear trend
B. quadratic trend
C. exponential trend
D. autoregressive
D. autoregressive
why: it yields lowest average absolute forecast error
If X and Y in a regression model are perfectly related,
a. The Pearson product-moment correlation would be 0
b. the SSR would be 0
c. the coefficient of determination would be 0
d. the standard error of the estimate would be 0
d. The standard error of the estimate would be 0
Why: because all points in the graph can be connected by one smooth function
The least squares criterion for estimating regression coefficients is to
a. minimize the error sum of squares
b. maximize the p-value
c. maximize the standard error of the estimate
d. minimize the SST
a. minimize the error sum of squares
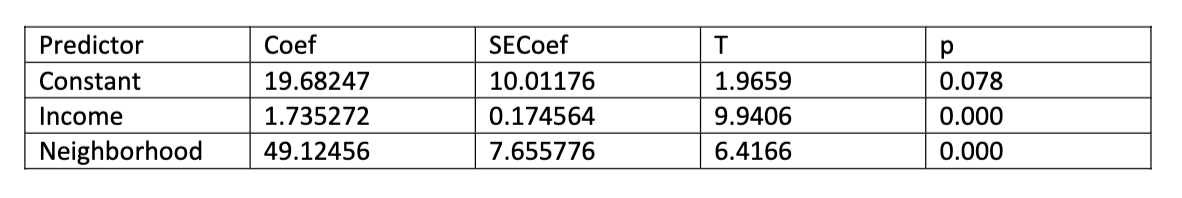
The following regression results are for a model to predict monthly household expenditure on groceries in ($’s) using annual household income in $1,000’s and household neighborhood (0 = suburban, 1 = rural) as predictors
For a rural household with $70,000 annual income, the model predicts monthly grocery expenditures of ____
190.28
In a multiple regression analysis, the correlation among the independent variables is termed
a. heteroscedasticity
b. parsimony
c. linearity
d. collinearity
d. adjusted coefficient of determination
d. collinearity
What do we mean when we say that a simple linear regression model is “statistically” significant?
a. All of the statistics computed from the sample make sense
b. the model is an excellent predictor of y
c. the model is “practically” useful for predicting y
d. the mode is a better predictor of y than the sample average, y-hat
d. the mode is a better predictor of y than the sample average , y-hat
If a simple linear regression line has a y-intercept of 10 and a slope of 4, and the residual is 1 when x = 2, the actual value of y is:
a. 14
b. 15
c. 18
d. 19
d. 19
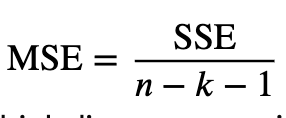
In a multiple regression analysis involving 25 data points, the SSE is 36 and the MSE is 1.8. In this case, the number of the independent variables must be:
a. 6
b. 5
c. 4
d. 3
c. 4
In an attempt to determine the factors that affect the amount of energy used, 200 households were analyzed. In each, the number of occupants and the amount of electricity used were measured. The response variable in a simple regression analysis of this data would be.
a. the number of occupants per household
b. the number of households
c. the amount of electricity used
d. either the number of occupants per household or the amount of electricity used
e. none of the other choices is correct
c. the amount of electricity used
why: because we want to predict the amount of energy used, therefore response is the amount of electricity used
F =
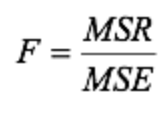
MSR formula =
SSR / K
MSE formula =
SSE / n - k - 1
SSE formula
SST - SSR
In a regression model involving a total of 30 observations, the following estimated regression equation was obtained: Y-hat = 170 + 34X1 - 3X2 + 9X3 + 58X4 + 3X5. For this model, SSR = 1,760 and SST = 2,000. What is the observed F-value? report 2 decimal places.
35.20
Confidence interval formula with standard deviation
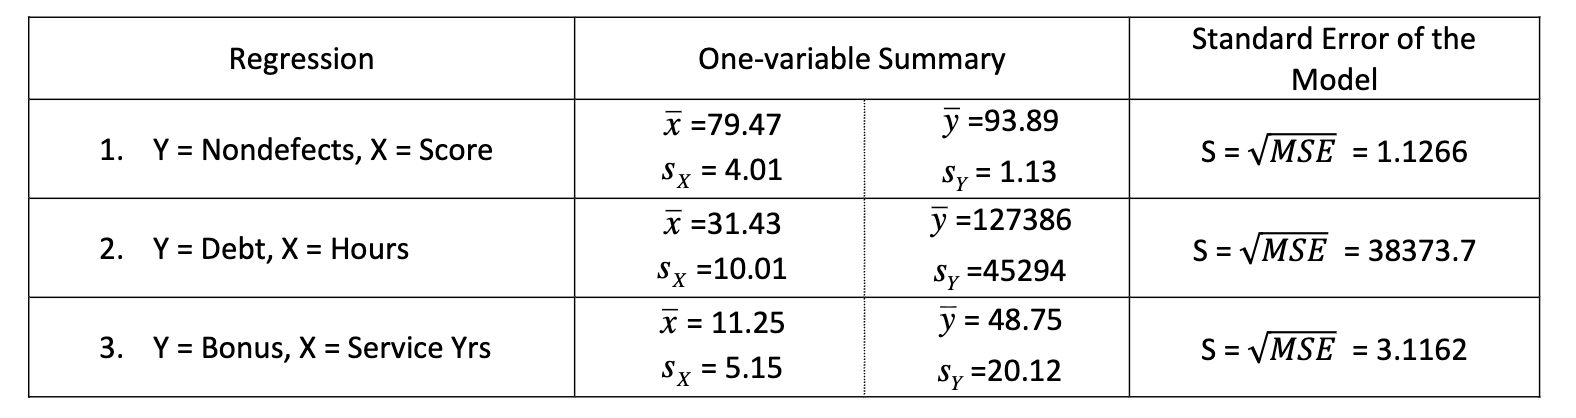
Simple Linear Regression analyses were run for 3 scenarios. Some one-variable summary information and the standard error of the regression model for each scenario are provided in the table below. Which regression provides the best “goodness-of-fit” (the most improvement in predictability compared to a one-sample analysis)?
a. nondefects v score
b. debt v hours
c. bonus v service years
d. connot be determined without R2
c. bonus v service years
Answer A for true and B for false. A regression analysis between sales (in $1,000’s) and advertising (in 100’s ) resulted in the following least squares line: y-hat = 77 + 8x. This implies that if the current advertising budget is doubled, sales are predicted to increase by $16,000
False
we don’t know the original budget
If two variables, x and y, have a strong linear relationship, then
a. x causes y to happen
b. y causes x to happen
c. answers a and b are both correct
d. there may or may not be any causal relationship between x and y
d. there may or may not be any causal relationship between x and y
Simple linear model
it’s positive

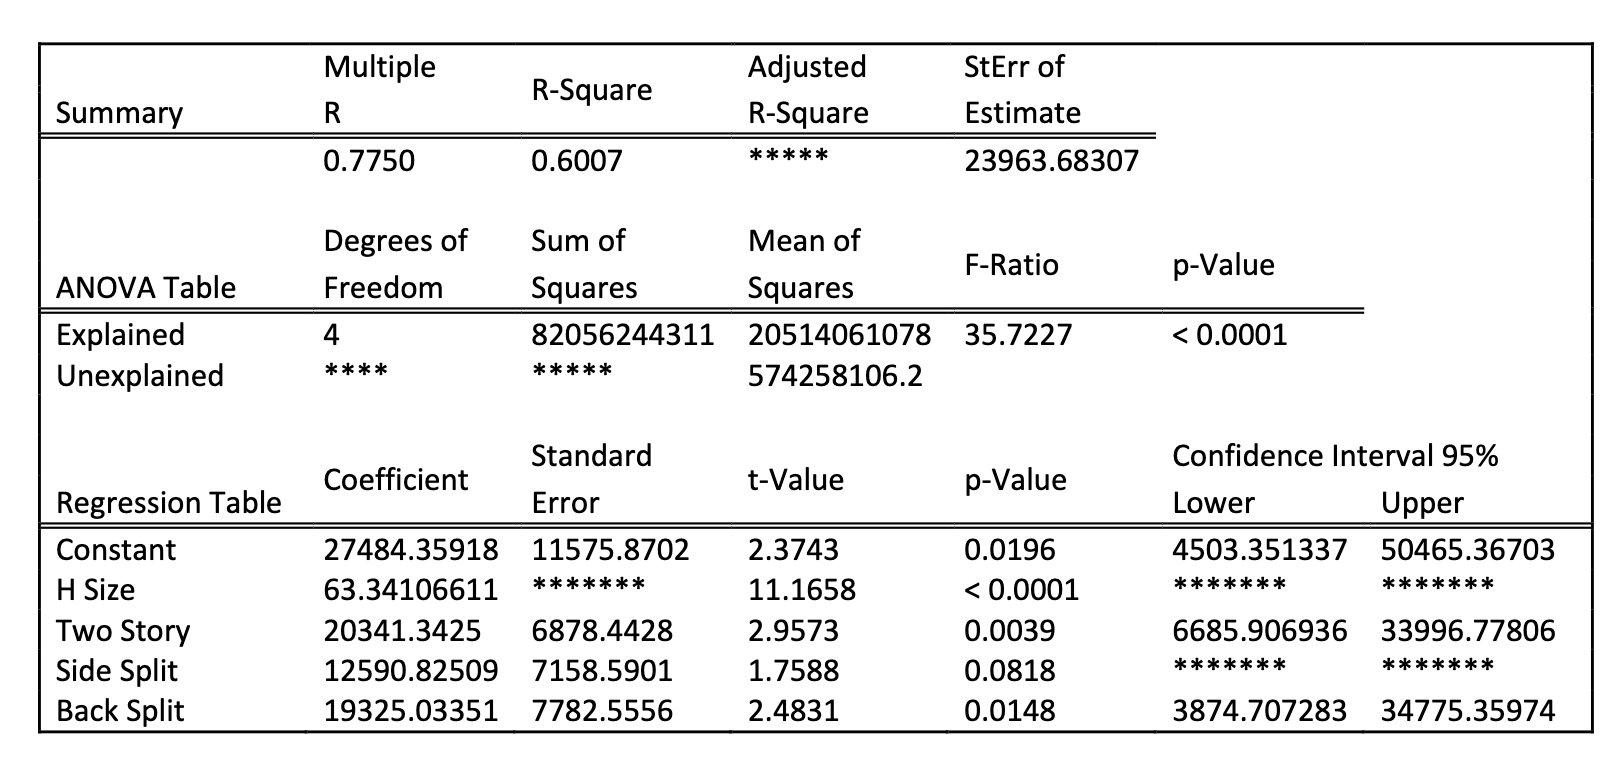
to determine if the regression model is statistically significant, the appropriate null and alternative hypotheses are:


for the test of the significance of the regression model, the value of the test statistic is _____ report 4 decimal places
35.7227
its the F-ratio

Write a hypotheses for the test of the significance of the predictor size of the home in the model
H0: Bsize = 0 HA: B size ≠ 0
For the test of significance of the predictor size of home, the best conclusion is
a. reject H0
b. do not reject H0
c. There is strong evidence that the size of the home is significant in predicting the selling price in this model
d. There is strong evidence that the size of the home is not significant in predicting
c. There is strong evidence that the size of the home is significant in predicting the selling price in this model
significant = reject H0 not significant = Do not reject H0
The H-size p-value is <0.0001
The 95% confidence interval estimate of the population coefficient on house size:
a. will capture 0
b. given not capture 0 and will be positive
c. will not capture 0 and will be negative
d. we cannot tell anything about the interval without knowing SE (b1)
b. given not capture 0 and will be positive
why: H size of coefficient = 63.34… which is positive
and p-value < 0.0001 reject H0 therefore unlikely to capture 0
The error degrees of freedom in the regression model are
95
n = 100
k = 4
n - (k+1) = 100 - (4 +1) = 95
Write the simplified (specific) equation to predict the selling price of a two story home
y-hat = 27484.35918 + 63.34106611(H size) + 20341.3425 + b3(0) + b4 (0) - then simplify
y-hat = B0 + b1(H size) + b2 (two story) + b3(side split) +b4(back split)
B0 = constant = 27484.35918
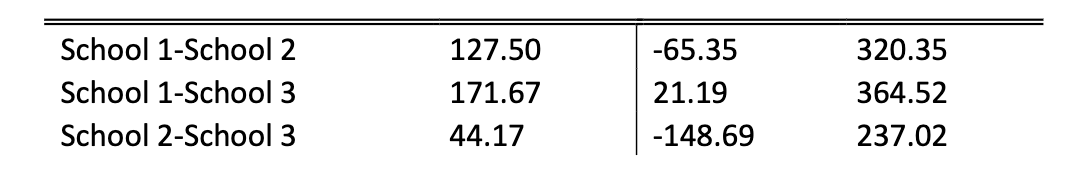
What conclusion can you make based on the given information?
a. There are no significant differences in the mean GMAT scores for the three graduate schools
b. The mean GMAT score is highest for school 1, second highest for school 2, and lowest for school 3
c. The only significant difference in mean scores is between schools 1 and 3, with the mean GMAT score higher for school 1
d. The only significant differences in mean scores is between schools 1 and 3, with the mean GMAT score higher for school 3
e. there is no significant difference in the mean GMAT scores between schools 1 and 3, but the mean GMAT score for school 1 is higher than for school2 and the mean GMAt score is higher for school 2 than for school 3
c. The only significant difference in mean scores is between schools 1 and 3, with the mean GMAT score higher for school 1
School 1 - School 3 is significant because it does not capture 0 from 21.19 - 364.52, then 171.67 is positive so GMAT score is higher for school 1 than 3
If a hypothesis has a significance level of 0.05, this means that
a. when the null hypothesis is true, we don’t reject it 5% of the time
b. When the null hypothesis is false, we don’t reject it 5% of the time
c. When the null hypothesis is false, we reject it 5% of the time
d. When the null hypothesis is true, we reject it 5% of the time
e. none of the above answers
c. When the null hypothesis is false, we reject it 5% of the time
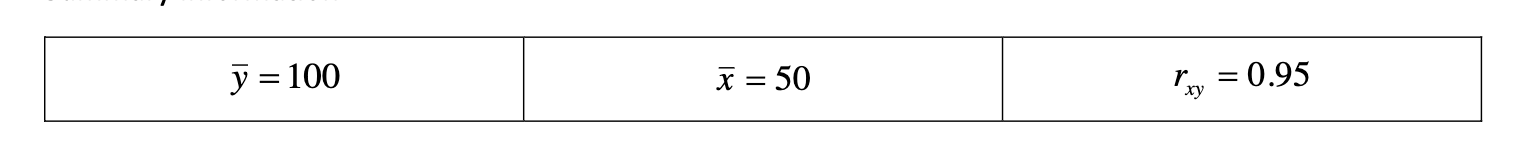
If an observation of X has the value 55, which of the following is most reasonable?
a. The corresponding value of Y is 90
b. The corresponding value of Y is 110
C. We do not have enough information to know anything about the value of Y
b. The corresponding value of Y is 110
There is a strong correlation with rxy= 0.95 so if X has a value of 55 above the mean of 50 then Y will also most likely have a value above the mean of 100 so the best answer is 110
observational study definition
An observational study is a type of research in which the investigator observes individuals or phenomena without manipulating any variables. The researcher simply records data as it naturally occurs.
experimental
The opposite of an observational study is an experimental study (also called an experiment).
In an experimental study, the researcher actively manipulates one or more variables—typically assigning subjects to different treatment groups—to observe the effect of that manipulation
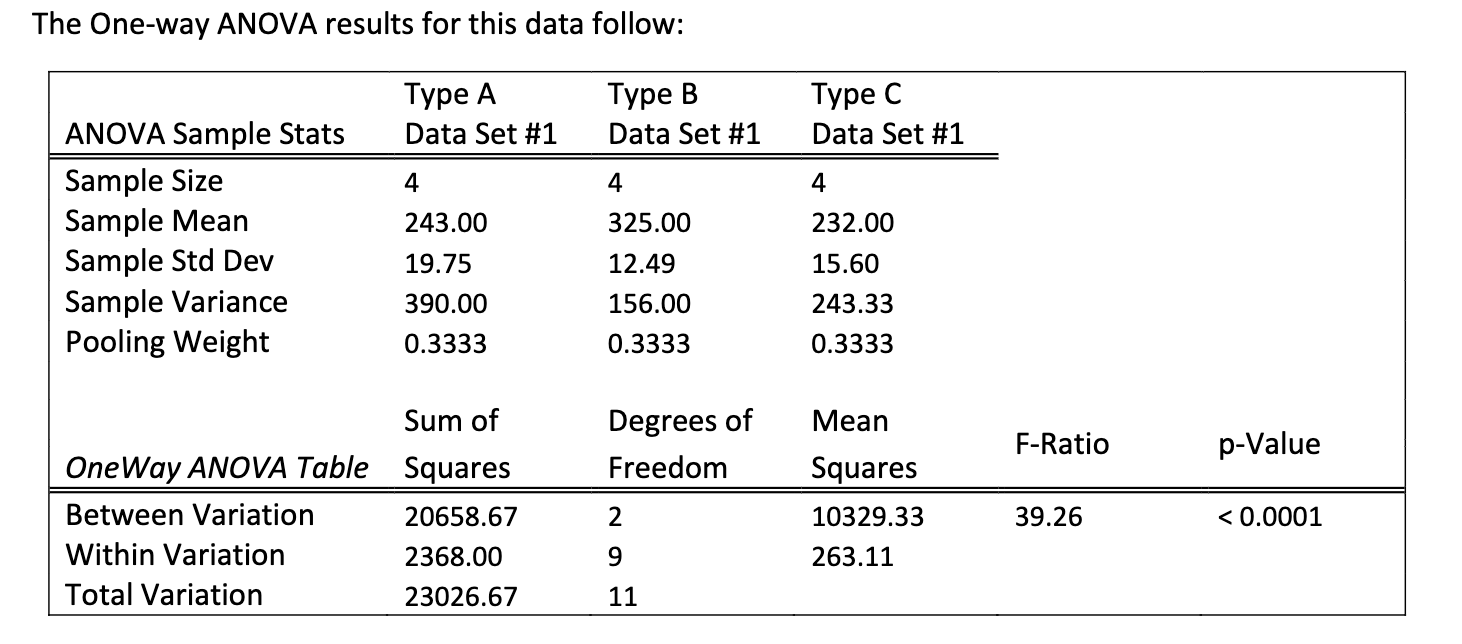
The response variable is __
a. type of golf ball
b. golfer
c. golf ball manufacturer
d. Travel distance of the gold ball in yards
d. travel distance of the gold ball in yards
Why: think response variable is connected with the goal of the study, the goal of the study is to see which gold ball travels the farthest, therefore its d

Based on the ANOVA results, you should
a. reject the null hypothesis, conclude that the three types of gold balls travel the same distance on average, and stop
b. do not reject the null hypothesis, and conclude that the three types of golf
c. reject the null hypothesis, conclude the three types of golf balls do not travel the same distance on average, and conduct a post hoc analysis
d. not reject the null hypothesis, conclude that the three types of golf balls do not travel the same distance on average, and conduct a post hoc analysis
c. reject the null hypothesis, conclude the three types of golf balls do not travel the same distance on average, and conduct a post hoc analysis
Why: p-p-value is <0.0001

Suppose the P-value for the test is 0.035, IT IS NOT, but suppose that it is. Which of the following is the best interpretation of that value?
a. The probability that the population mean is 50 is 0.035
b. The probability that the population mean is not 50 is 0.035
c. There is a 3.5% chance that a random sample would result in an average as different from 50 as the observed average is if the population mean is really 50
d. There is a 3.5% chance that the sample average is biased
c. There is a 3.5% chance that a random sample would result in an average as different from 50 as the observed average is if the population mean is really 50
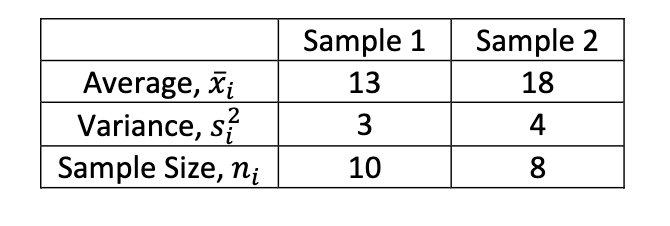
What is the value of the pooled variance estimate?
3.4375

Calculate the 99% confidence interval estimate in population means
(-7.57, -2.43)