Conservation Bio Exam 2
1/54
There's no tags or description
Looks like no tags are added yet.
Name | Mastery | Learn | Test | Matching | Spaced |
|---|
No study sessions yet.
55 Terms
Population ecology is the study of
the factors that affect characteristics
of populations such as growth rates, population size, age distribution, sex ratio, dispersal rates, and geographic spacing.
A population is a group of
individuals of the same species living together
in the same place at same time.
Population ecology is very important to "management" of species such as:
endangered species
species used for harvest, sustainable harvest
invasive species or pests
Populations are fundamental units of
conservation (including preservation,
management, sustainable use, and legal protection)
Individuals in a population are
spatially, genetically, and ecologically cohesive with each other ....
and with individuals in other populations when there
is dispersal or migration among populations.
Population size depends on:
Birth rate
Death rate
Immigration (dispersal of individuals into population)
Emigration (dispersal out of population)
Many different ecological factors affect birth rates and there are many different causes of mortality ... such as?
predation, competition (starvation), disease, weather, natural disaster, accident
Other characteristics of populations include:
age distribution, reproductive
output of females of different ages, survival of individuals of different ages, sex ratio, and generation time (or length).
Tools of Population Ecology
Life tables, survivorship curves, age distributions, mathematical models
Life table includes information on
survival and fecundity (number of offspring)
for females of different ages in a population.
Fecundity is the
average number of offspring produced by females of a given age.
Life table can be used to calculate the
population growth rate per
generation (change in number of individuals each generation per
each individual in present generation).
population growth rate per generation is also called the
net reproductive rate and symbolized by R0
R0 is growth per generation.
R0 =
(lx)(mx) (survivorship x fecundity)
If R0 > 1 then
population is growing
If R0 < 1 then
population is declining, individuals not able to
“replace” themselves.
Population growth rate can also be calculated over a
defined time interval,
regardless of generations.
Difference between birth and death rates gives the
per-capita rate of increase (r),
sometimes called intrinsic rate of increase.
If r > 0 then population is
growing
If r < 0 then population is
declining
For example, if r = 0.03, then difference
between birth and death rate is
3 individuals for every 100 individuals in the population.
r can be considered a characteristic of a
population and also a species.
Populations of the same species living in similar environments will have similar r values.
REMEMBER: r, by itself, does not give the population size; it only gives
the amount of change in population size.
When there are no limits on population growth (excess resources),
per-capita rate of increase (r) is
maximized and called r max .
Maximum rate of population growth equals:
ΔN/Δt = N × r max (N is population size or # of individuals)
To get population size at any point on the curve, you would use:
Nt = N0ert
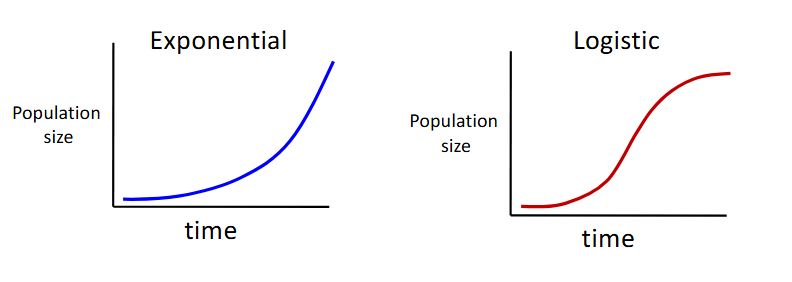
Exponential growth is
density-independent (the rate of growth does not
slow down as more individuals are added to the population,
there is no carrying capacity).
Most growth in natural populations is
density-dependent.
(negative density-dependence)
called logistic population growth.
it involves a carrying capacity, K
exponential vs. logistic pop. growth graph
Carrying capacity is
specific for a particular
species in a particular environment at a particular time.
During logistic growth, as a population
gets near the carrying capacity,
growth rate slows down and stabilizes at zero
birth rate = death rate
Population growth rate: exponential
ΔN/Δt = N × r max
Population growth rate: logistic
What factors determine the carrying capacity?
Food (resources)
Competition among individuals
Other factors (predation and disease
logistic growth model differs from exponential by including
carrying capacity (K)
Many different factors affect population size and growth rates.
Some of these factors are deterministic, Other factors are stochastic
factors are deterministic
they affect (regulate) the population
in the same way all the time
factors are stochastic
they affect the population at random
times and in random ways
are particularly important
to small populations
Applications of population ecology in conservation
1. Managing and preserving metapopulations
2. Population viability analysis (PVA)
3. Analyzing life tables to understand recruitment limitation )
4. Measuring and using carrying capacity
5. Determining levels of sustainable harvest
Almost every species consists of more
than one population.
Usually these multiple populations are
geographically separated, although some
dispersal among populations occurs
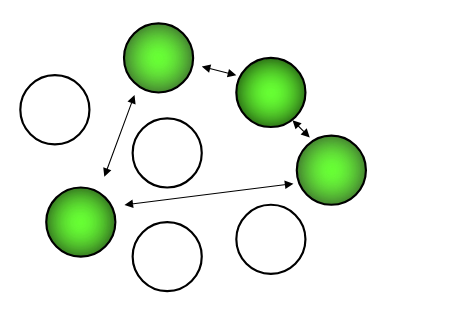
Together a set of populations forms a
metapopulation.
Metapopulations are independent and yet linked
Their dynamics are separate (they grow and decline) but individuals can move in-between them via dispersal
In all metapopulations, there is an
equilibrium number of subpopulations determined by extinction and colonization rates for each subpopulation.
Equilibrium is a “balance” between
extinction and colonization.
High colonization rate and extinction rate (> 0.5) indicates a
very dynamic situation.
What does this mean?
Subpopulations are constantly going extinct but then habitat patch quickly being recolonized.
The equilibrium number of subpopulations does not say
which sites are occupied, this can vary a lot.
When m > 0.5 and E > 0.5 then 50% or fewer sites have a subpopulation but rapid turnover among sites.
Metapopulations often exist or were created because of
habitat fragmentation.
Classic or Levins model
equal rates of dispersal
from and among each subpopulation.
Subpopulations are identical in all respects
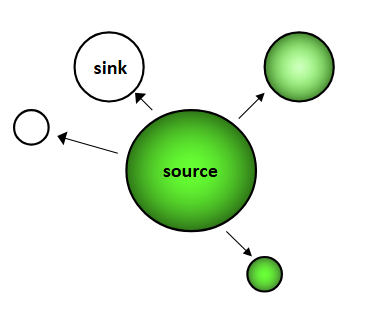
“Mainland-island” model –
dispersal from large source
subpopulations to smaller sink
populations that often go extinct.
Examples of managing and preserving metapopulations
1. Florida Scrub Jay
Low colonization rate combined with potentially high extinction rate (small metapop size) means each metapopulation is at risk
2. Desert bighorn sheep
Management by re-introduction into unoccupied mountain ranges, and protection of the dispersal corridors.
Population Viability Analysis
A modeling technique that uses specific life history information to determine the persistence time of a population and/or its likelihood of extinction in a defined time period.
PVA models goals
goal is to evaluate what will happen to a population under different management scenarios or changes in the environment (climate change, habitat loss, invasive species).
Growth of an individual from one age, stage, or size class to the next is described by
transition probabilities.
K is not determined solely
by resource availability. Also determined by how much
resource an individual requires to survive and reproduce –