Honors Math BC: FLASHCARDS
0.0(0)
Card Sorting
1/124
Earn XP
Description and Tags
MATH
Last updated 7:40 AM on 6/8/23
Name | Mastery | Learn | Test | Matching | Spaced | Call with Kai |
|---|
No analytics yet
Send a link to your students to track their progress
125 Terms
1
New cards
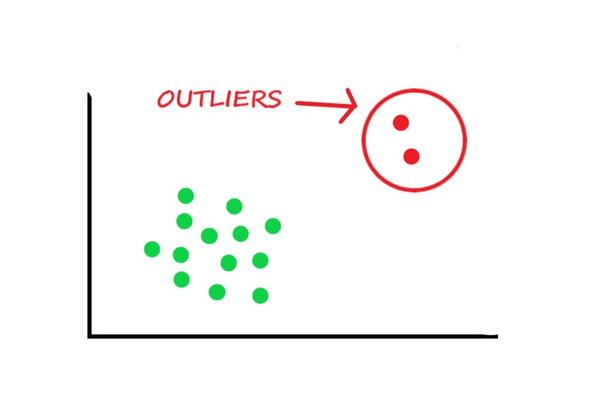
Outlier Data
A piece of data separate from the majority
2
New cards
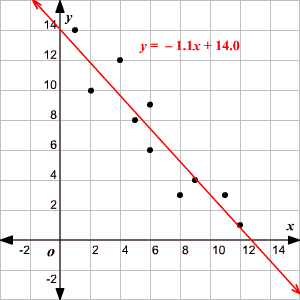
Curve of Best Fit (Linear)
a curve the best approximates the trend on a scatter plot.
3
New cards
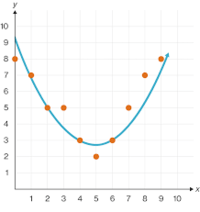
Curved of Best Fit (Quadratic)
a curve the best approximates the trend on a scatter plot.
4
New cards
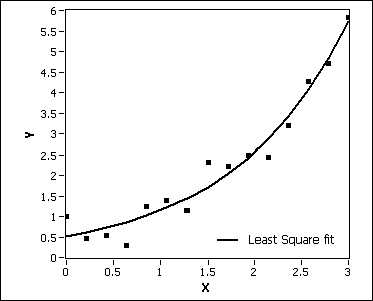
Curved of Best Fit (Exponential)
a curve the best approximates the trend on a scatter plot.
5
New cards
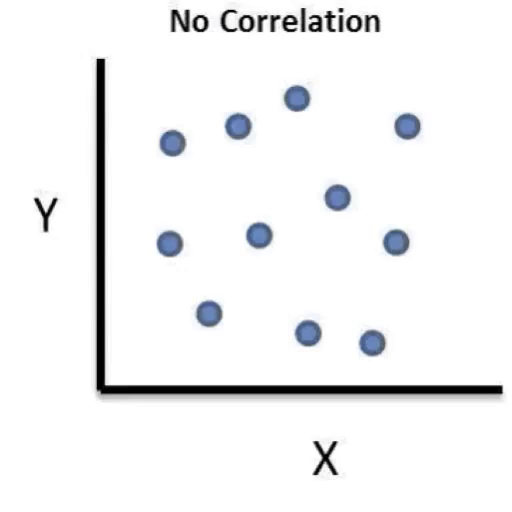
No Correlation
Dots or pieces of data spread across a graph, unable to form a trend line.
6
New cards
Negative Linear Relationship (Correlation)
a relationship where data of the y value decreases, while data of the x value increases
7
New cards
Positive Linear Relationship (Correlation)
a relationship where data of the y value increases, while data of the x value increases
8
New cards
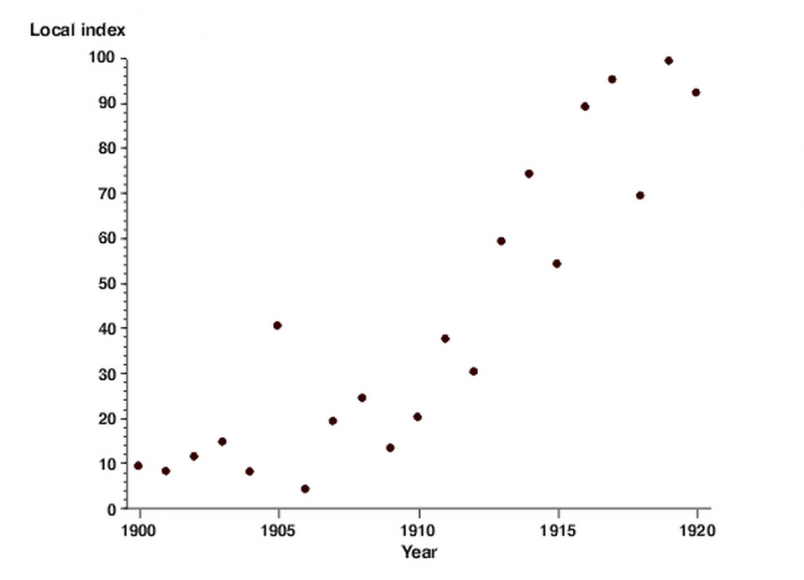
Scatterplot
numerical data on a visual graph
9
New cards
Mode
the value that appears most out of a data set
10
New cards
Median
for pieces of data that has an odd number, the middle value is the median. however, for pieces of data with en even number, take the mean of the two middle value to get the median.
11
New cards
Mean
the average of all values in a data set. (find the sum of all values in a data set, then divide the sum by the number of values)
12
New cards
Summation
The sum of all values in a data set.
13
New cards
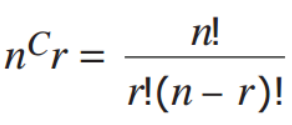
Combination (and its formula)
the number of possible ways to arrange or select objects when there is no order.
14
New cards
Geometric Sequence
sequence of numbers where the terms is being continuously multiplied by a rate

15
New cards
Inverse of a Function
the process of when x & y value switch place; (2,9) → (9,2); y=7x-4 → y=(x/7)+(4/7)
16
New cards
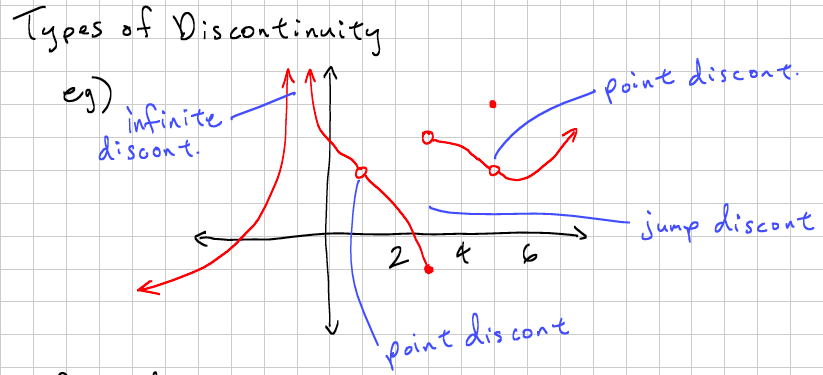
Discontinuity
a point at which a function is discontinuous or undefined.
17
New cards
Linear Function (Vertical Dilation)
vertical dilation (stretch or compression) of the parent function, f(x) = x
18
New cards
Transformations of Parent Function (Translation)
translations of a function strictly affects the ‘C’ and ‘D’
19
New cards
Transformations of Parent Function (Dilation)
dilation of a function strictly affects the ‘A’ and ‘B’ values,
20
New cards
Transformations of Parent Function (Reflection)
reflection of a function strictly affects the ‘A’ and ‘B’ values when turned negative.
21
New cards
Parent function: Exponential vs. Logarithmic
EXPONENTIAL: f(x) = b^x where b > one.
\
LOGARITHMIC: f(x) = log-base-b (X), where ‘b’ >1
\
LOGARITHMIC: f(x) = log-base-b (X), where ‘b’ >1
22
New cards
Parent function: Rational
f(x) = 1/x, where x isn’t ‘0’
23
New cards
Parent Function: Cubic vs. Cube Root
CUBIC: f(x)=x^3
CUBE ROOT: f(x)=∛x
CUBE ROOT: f(x)=∛x
24
New cards
Parent Function: Absolute Value vs. Square Root
ABS VAL: f(x) = |x|
SQ RT: f(x) = √x
SQ RT: f(x) = √x
25
New cards
Function Notation
one input per output using the term ‘f(x)’
26
New cards
End Behavior
term used to dictate the domain and range of a function; i.e.:
x→∞, f(x) →∞
x→-∞, f(x)→-∞
x→∞, f(x) →∞
x→-∞, f(x)→-∞
27
New cards
Extrema
the amount of vertices on a function.

28
New cards
Increasing/Decreasing
a function can be described as increasing/decreasing/constant for either an interval or for the entire domain
29
New cards
Range
all ‘y’ values in a function
30
New cards
Domain
all ‘x’ values in a function
31
New cards
Function
relationship between x & y values that forms data that could be represented through a line on a graph
32
New cards
Relations
a set of ordered pairs
33
New cards
Quadratic Formula
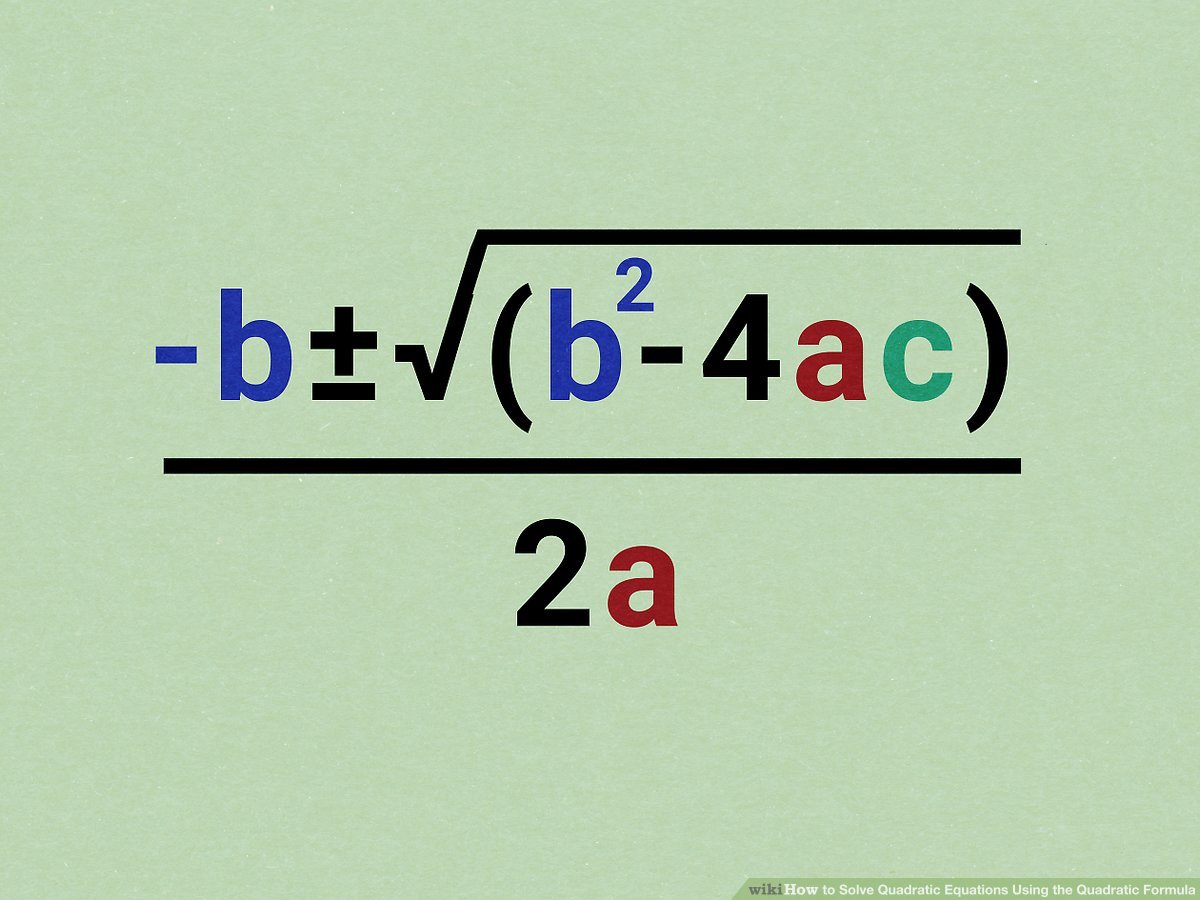
34
New cards
Vertex of a Quadratic Function
The global/absolute maximum or minimum of the function.
35
New cards
Graph of a Quadratic Equation
Parabola/f(x)=ax^2+bx+c
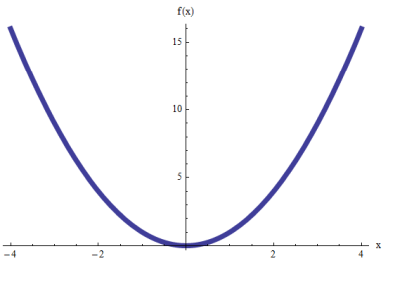
36
New cards
Dependent/Independent Variable
X-value serves as an independent value (time, age, ect)
Y-value serves as a dependent variable (money, population, ect.)
Y-value serves as a dependent variable (money, population, ect.)
37
New cards
System of Linear Inequalities
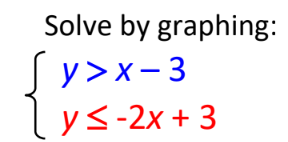
38
New cards
Graphing Linear Inequalities
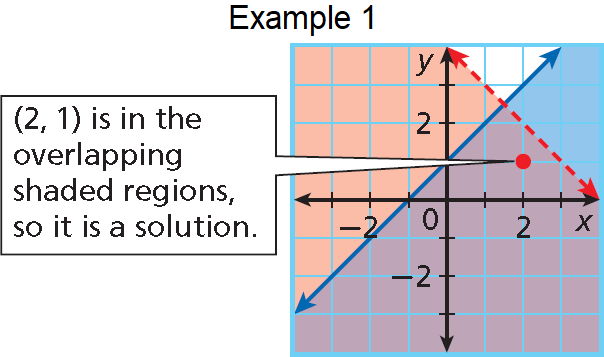
39
New cards
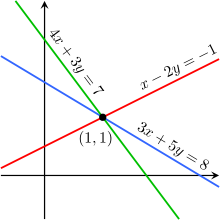
Systems of Equations (Linear)
40
New cards
Systems of Equations (Quadratic)

41
New cards
Systems of Equations (Linear) (Elimination)
the process of scaling and subtracting two equations from each other to find an ordered pair.
42
New cards
Systems of Equations (Linear) (Substitution)
the process of scaling two functions and setting them equal to each other to find an ordered pair.
43
New cards
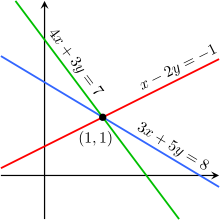
Systems of Equations (Linear) (Graphing)
44
New cards
Parallel Lines
Two linear functions of a graph that will never intersect
45
New cards
Perpendicular Lines
Two linear functions that intersect at a 90 degree angle
46
New cards
Slopes of Lines
change in y/change in x
47
New cards
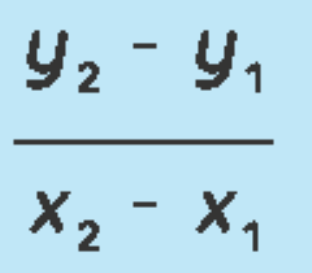
Slope Formula
48
New cards
Slope
‘m’ in ‘y=mx+b’
49
New cards
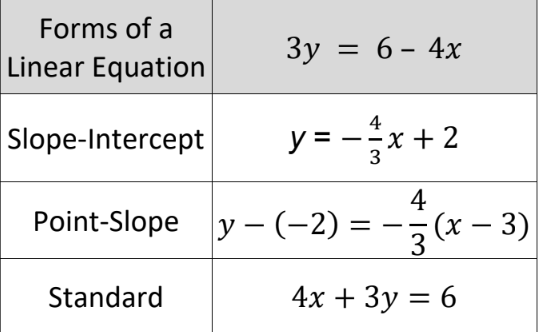
Equivalent Forms of A Linear Equation
\
50
New cards
Linear Equation Point-Slope Form
\

51
New cards
Linear Equation Slope-Intercept Form

52
New cards
Linear Equation Standard Form

53
New cards
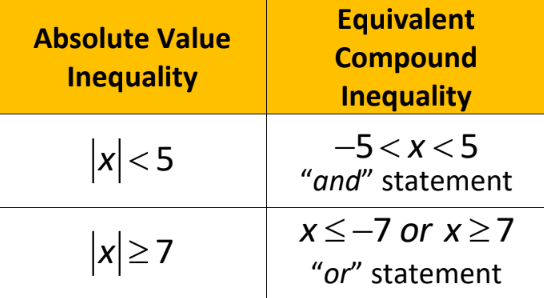
Absolute Value Inequalities
54
New cards
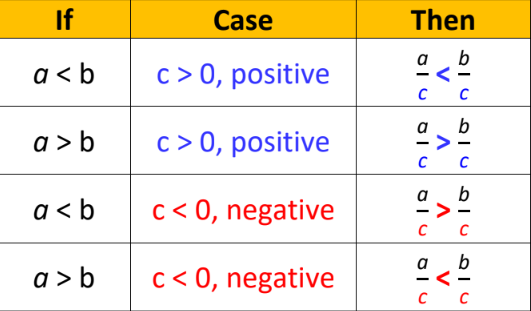
Division Property of Inequalities
55
New cards
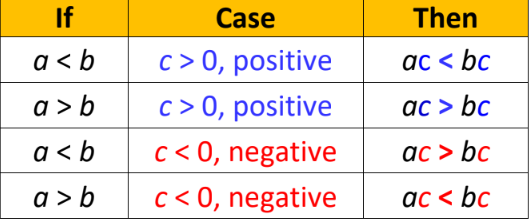
Multiplication Property of Inequality
56
New cards
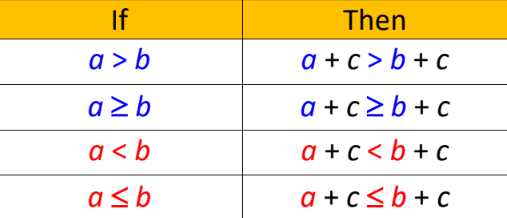
Addition/Subtraction Property of Inequality
57
New cards
Transition Property of Inequality

58
New cards
Graphing of an Inequality
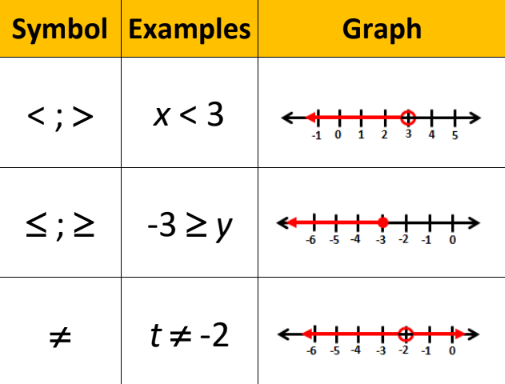
59
New cards
Inequality
an algebraic sentence or function comparing two quantities
60
New cards
Quadratic Equation (number/types of roots)
two distinct real roots; one real w/ multiplicities; zero real, two complex roots
61
New cards
Quadratic Equation
f(x)=ax^2+bx+c
62
New cards
Horizontal Line
y=c; c can be any real #; constant function
63
New cards
Vertical Line
x=a; a can be any real #; constant function
64
New cards
Literal Equation
formula/equation that consists primarily of variables
65
New cards
Coordinate Plane
two dimensional graph with ability to plot points and functions
66
New cards
X-intercept
where a function intercepts when y=0
67
New cards
Zeros
where a function intercepts when y=0
68
New cards
Solutions or Roots
solve using ‘zero product property’
69
New cards
Zero Product Property
if ab = 0, then a = 0 or b = 0.
70
New cards
Add/Subtract Radical Expressions
add/subtract numerical factors of the like radicals.
71
New cards
Square Root
Two factors of a value identical to each other that when multiplied, gives you that value.
72
New cards
Prime Polynomial
Cannot be factored into a product of lesser degree polynomial factors.
73
New cards
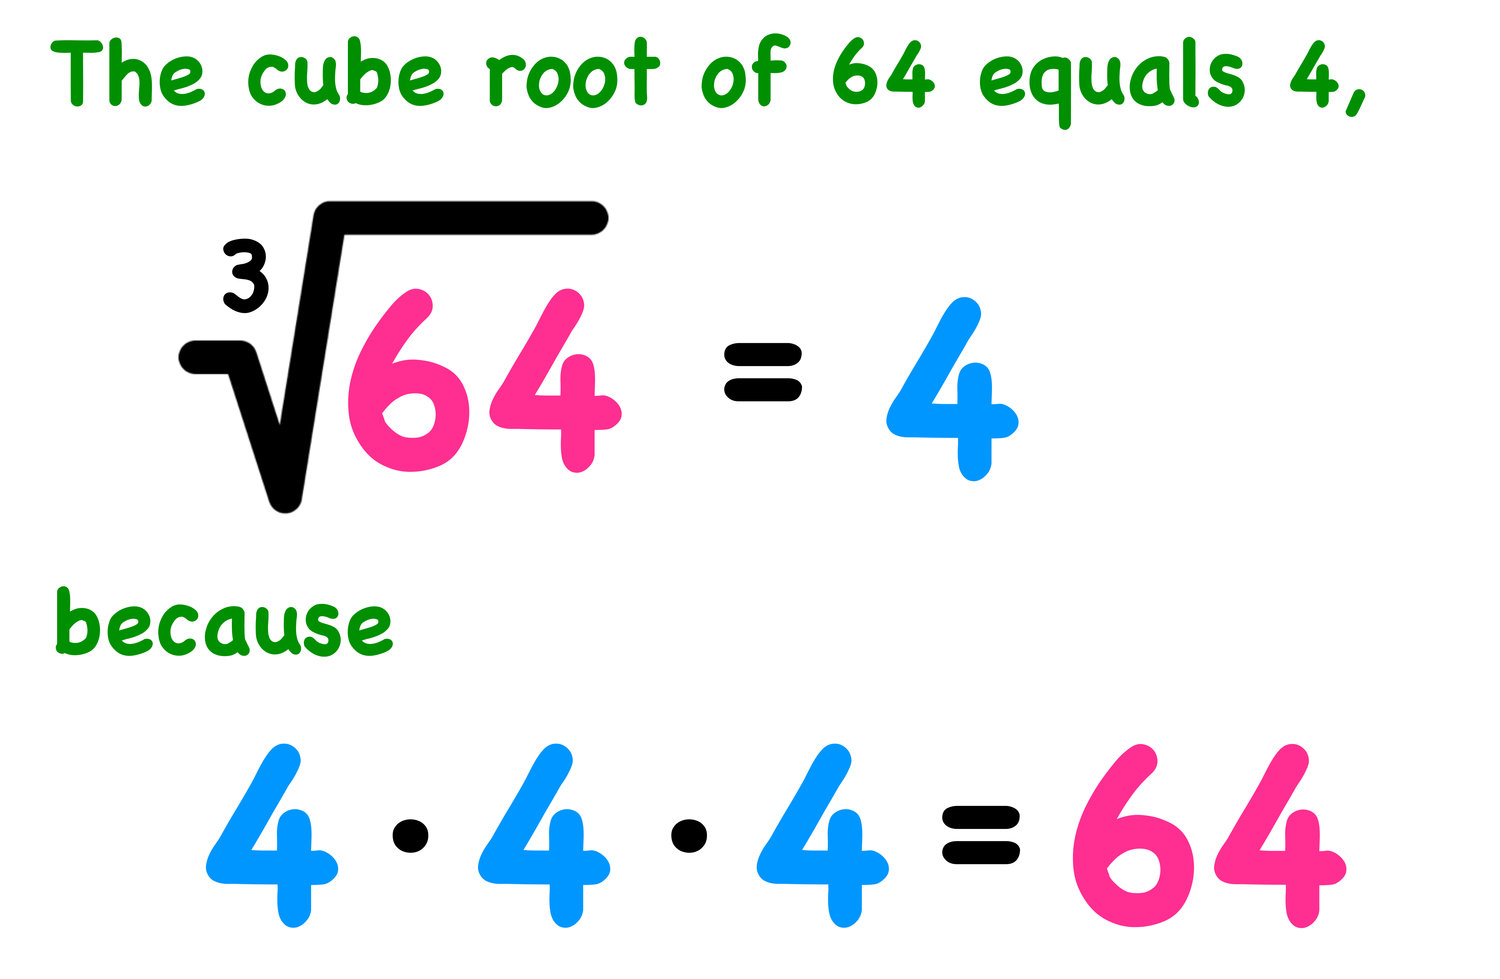
Cube Root
74
New cards
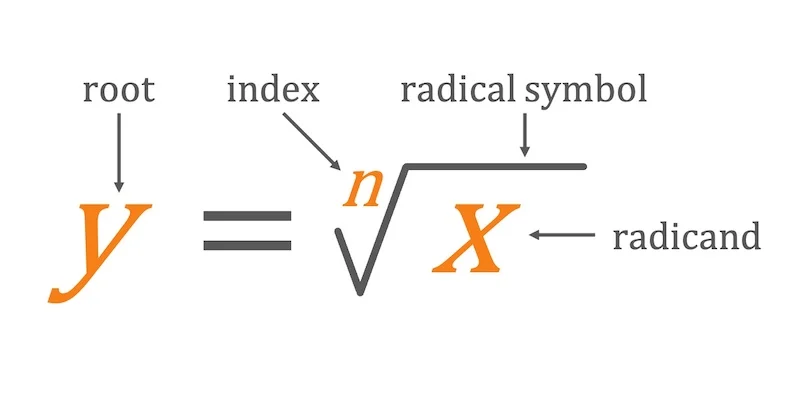
nth root
75
New cards
Product Property of Radical
the nth root of a product equals the product of the nth roots
76
New cards
Simplify Radical Expressions
simplify radical and combine like terms when possible
77
New cards
Quotient Property of Radicals
the nth root of a quotient equals the quotient of the nth roots of the numerator and denominator
78
New cards
Divide Polynomials (Monomial Divisor)
divide each term of the dividend by the monomial divisor
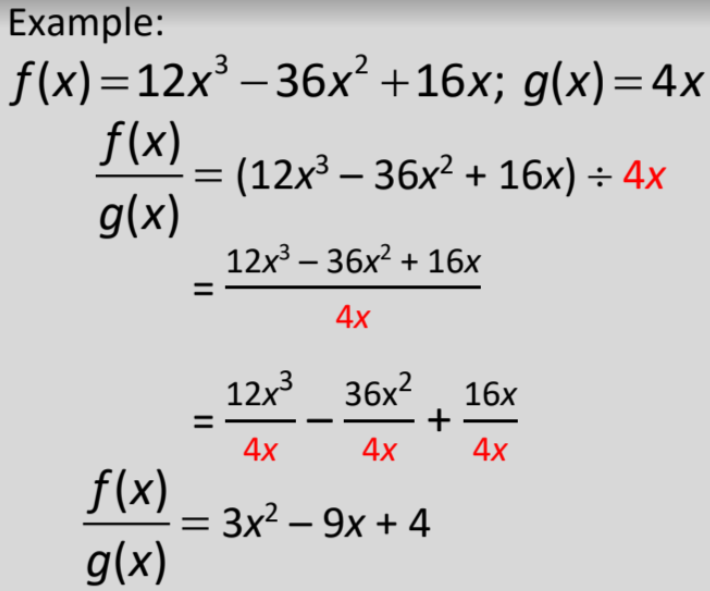
79
New cards
Divide Polynomials (Binomial Divisor)
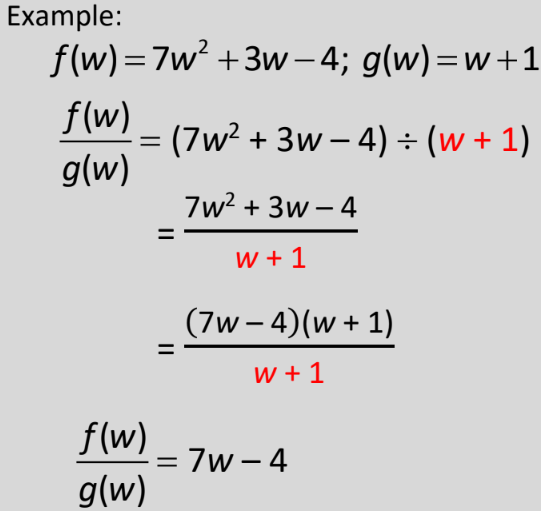
80
New cards
Factoring Sum and Difference of Cubes
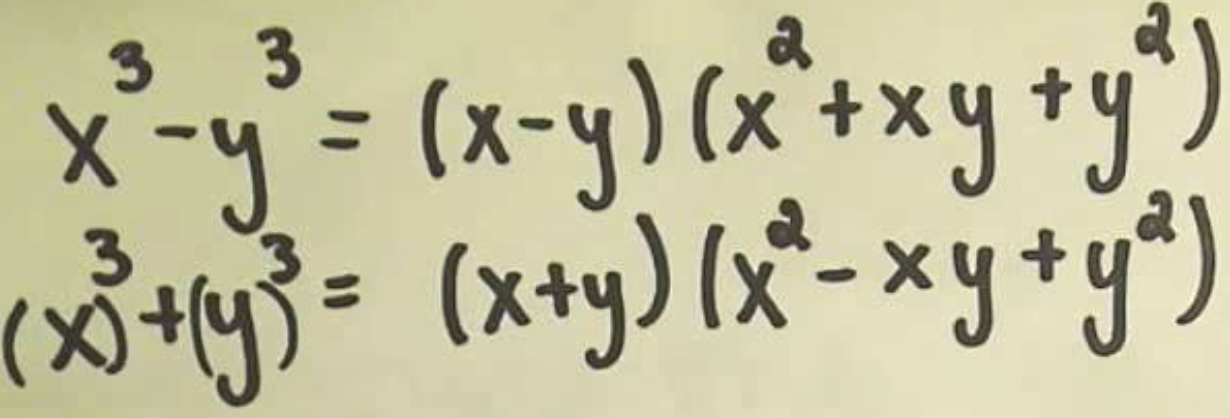
81
New cards
Difference of Squares
DOTS! a^2-b^2
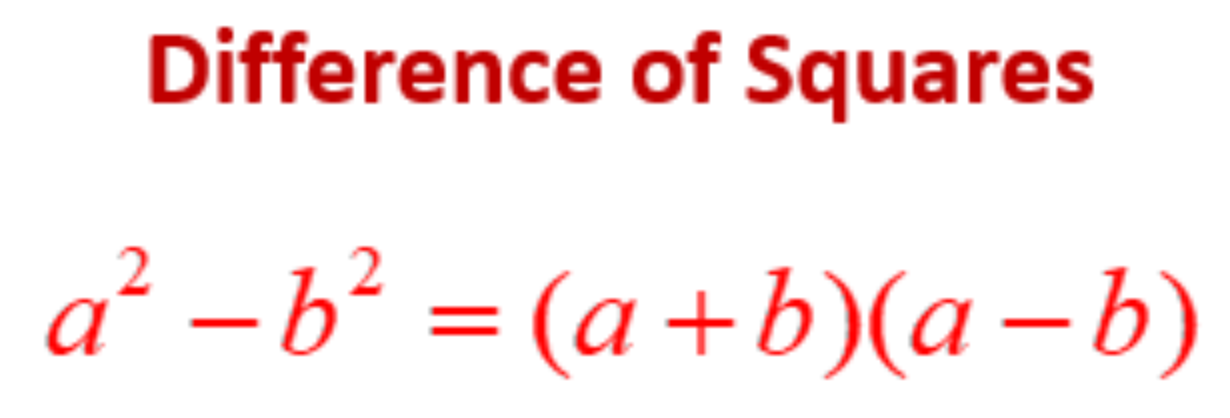
82
New cards
Permutation (Formula)
calculates the # of permutations
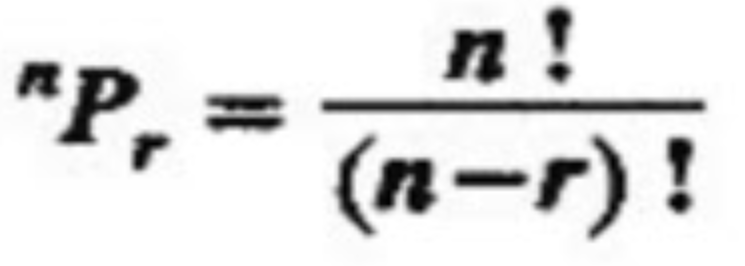
83
New cards
Perfect Square Trinomial

84
New cards
Arithmetic Sequence
a sequence of values that has a constant difference between every two consecutive terms
85
New cards
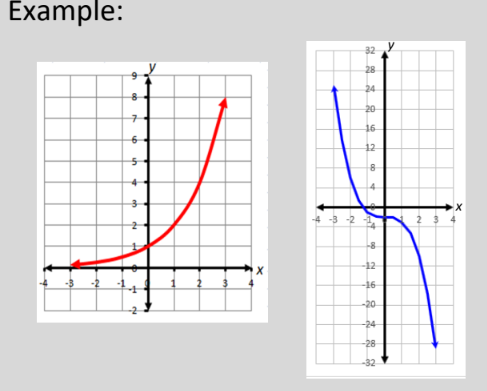
Continuity
a function that is continuous at every point in its domain
86
New cards
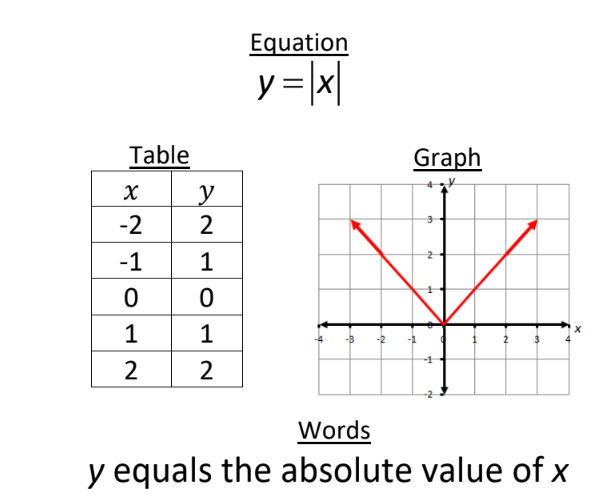
Multiple Representations of Functions
functions can be represented through a Table, Words, Equation, or Graph.
87
New cards
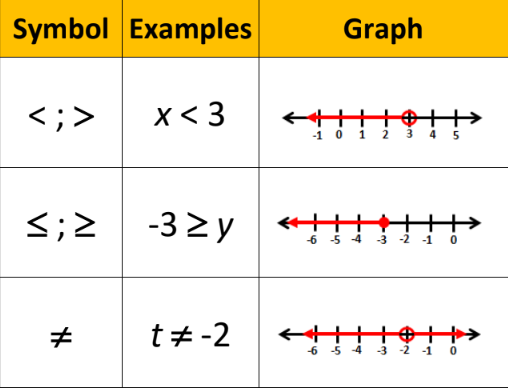
Graph of an Inequality
88
New cards
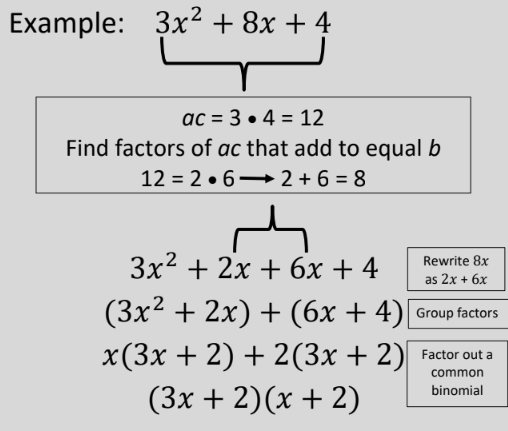
Factor by Grouping
89
New cards
Parent Function: Linear vs. Quadratic
LINEAR: f(x)=x
QUADRATIC: f(x)=x^2
QUADRATIC: f(x)=x^2
90
New cards
Graphing Linear Inequalities
\
91
New cards
System of Linear Equations (Number of Solutions)
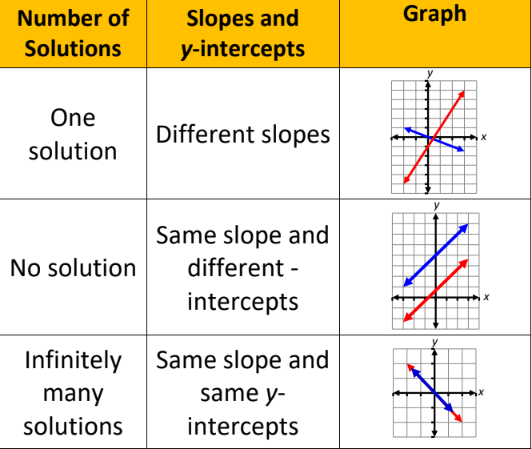
92
New cards
Mathematical Notation
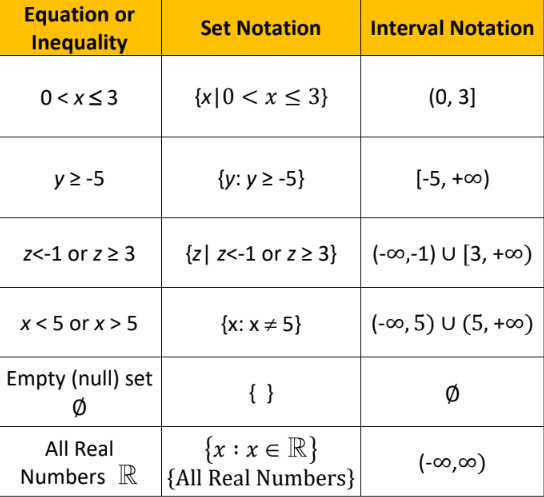
93
New cards
Greatest Common Factor
get the gcf of all terms of the polynomial and then apply distributive property.
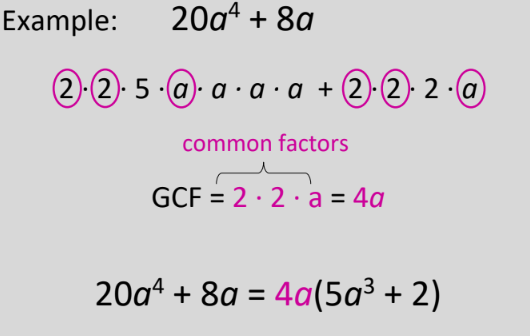
94
New cards
Factors of a Monomial
number(s) and/or variable(s) multiplied to form a monomial
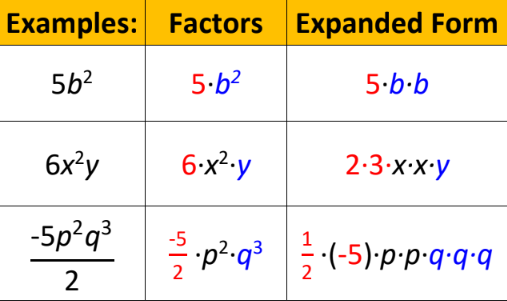
95
New cards
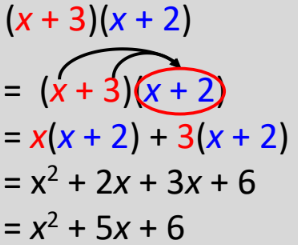
Multiply Binomials
use distributive property!!!!
96
New cards
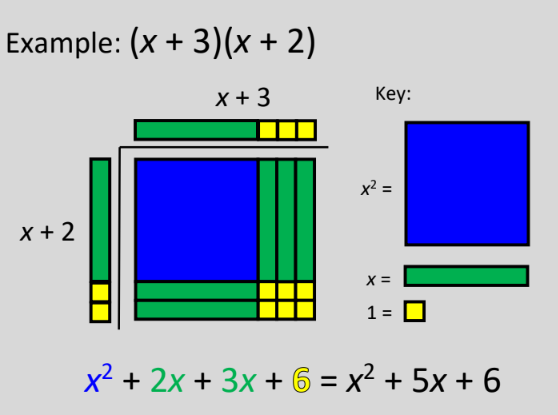
Multiply Binomials (Model)
use distributive property!!!!!
97
New cards
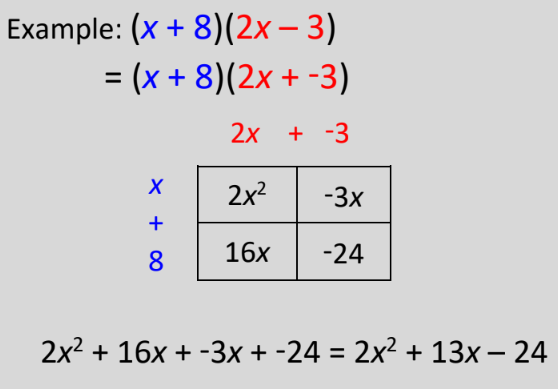
Multiply Binomials (Graphic Organizer)
apply distributive property!!!!!!
98
New cards
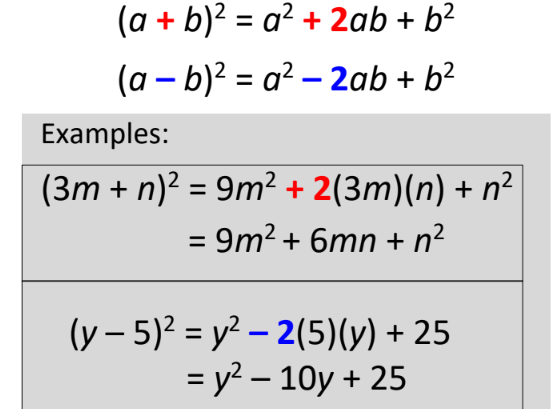
Multiply Binomials (Squaring a Binomial)
99
New cards
Multiply Binomials (Sum and Difference)
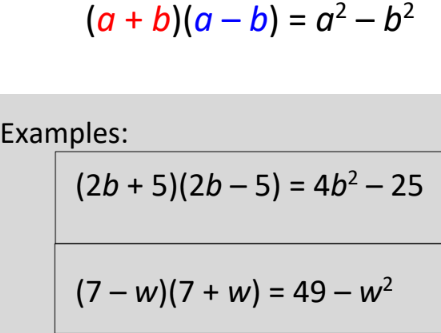
100
New cards
Real Numbers
the set of all rational and irrational numbers, including: natural, whole, and integers.