Inequality and poverty
1/26
There's no tags or description
Looks like no tags are added yet.
Name | Mastery | Learn | Test | Matching | Spaced | Call with Kai |
|---|
No analytics yet
Send a link to your students to track their progress
27 Terms
equity
a condition in which people receive from a relationship in proportion to what they give to it
efficiency
using resources in such a way as to maximise the production of goods and services
equity vs equality
giving everyone what they need to be successful vs treating everyone the same
income inequality vs. wealth inequality
income: unequal distribution of flow of income to households (rent, wages, profit, interest)
wealth: differences in amount of assets households own
absolute poverty
situation where individuals cannot afford to acquire the basic necessities for a healthy and safe existence
relative poverty
situation where household income is a certain percentage less than the median household income in the economy
households living with <50% of median household income considered to be in relative poverty
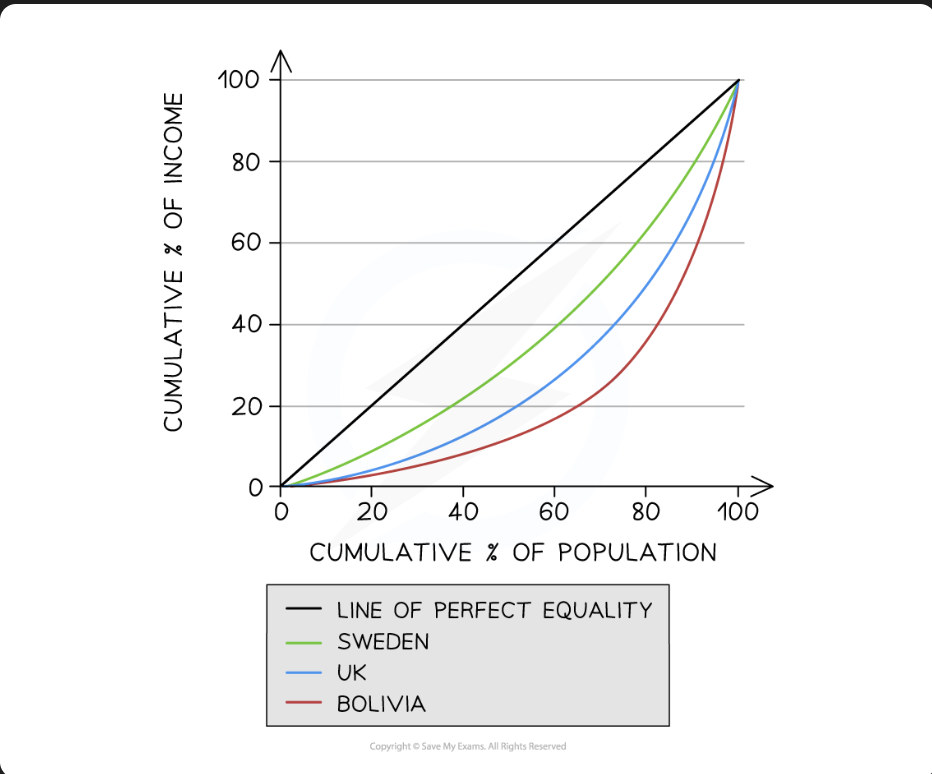
lorenz curve
visual representation of the income inequality existing between households in an economy
data presented in quintiles (population divided by 20%)
line of equality represents perfect income distribution (not desirable)
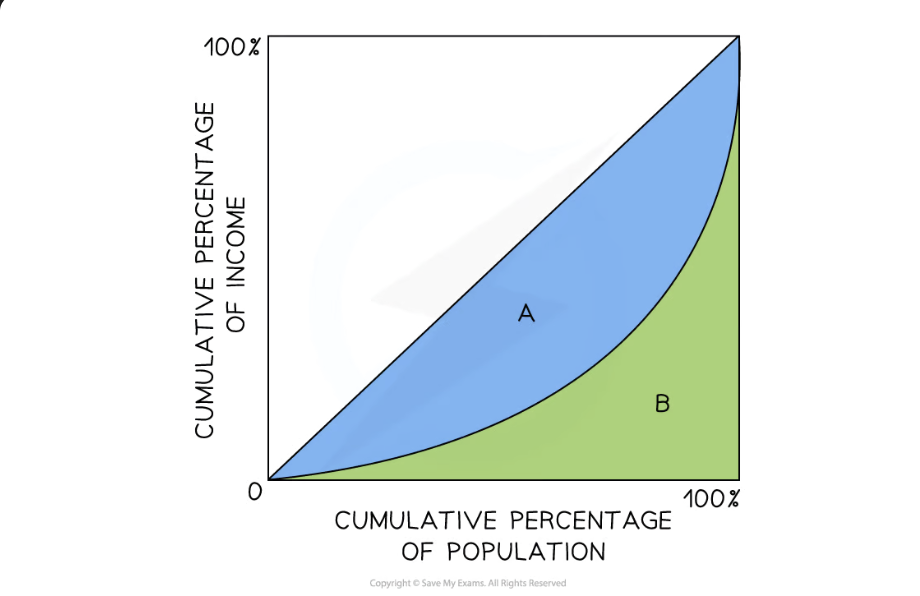
gini coefficient
gini coefficient = A / (A+B)
0 = absolute equality, 1 = perfect inequality
governments use progressive taxation and transfer payments to shift gini coeff. closer to 0
single indicators of poverty
international poverty line (IPL)
absolute minimum level of income a person must receive in order to meet basic needs required for human survival - 1.90$ a day
minimum income standard (MIS)
lowest amount of income needed for what society views as an acceptable SOL in the country
value differs from region to region
composite indicators of poverty
Multi dimensional poverty index (MPI)
survey to measure complexities of poor people’s lives each year
tracks deprivation across 3 dimensions and 10 indicators (health, education, living standards)
survey identifies which 10 deprivations each household experiences
household classed as poor if they suffer deprivations across 1/3 or more indicators
difficulties in measuring poverty
multi dimensional concept, difficult to quantify
measured through self reported surveys giving rise to multiple discrepancies
households identifying as poor may exhibit very diff characteristics from eachother
urban vs. rural poverty is very different
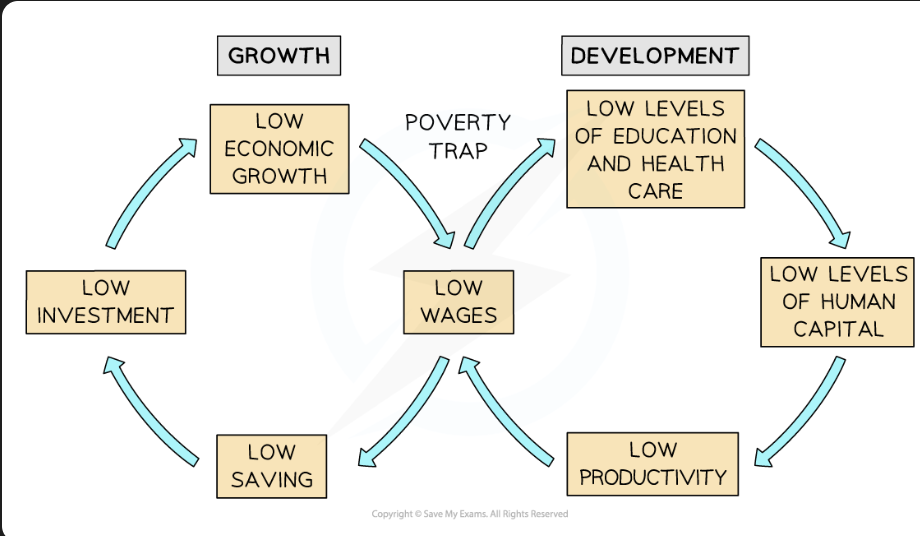
causes of poverty / poverty cycle
causes of inequality
differences in human capital
higher skill level, higher level of income
inequality of opportunity
unequal access to education and health = inequality of opportunity in job market
different levels of resource ownership
assets generate income
discrimination
gender, race, etc.
unequal status and power
economies w/ strong trade union membership provide workers w/ more power and higher levels of income and equality
gov taxes and benefits policies
countries providing range of benefits (unemployment, pension) raise income of lowest 20%, more equal distribution
progressive tax systems allow income earners to contribute according to their ability, more equal distribution
globalisation and technological change
integration of diff countries through increasing freedoms in cross border movement of people, goods, tech
globalisation speeds up industrialisation developing nations
more isolated countries experience higher levels of inequality
market based supply side policies
supply side policies provide great opportunities but also increase inequality
costs of inequality
impact on economic growth
increasing inequality becomes disincentive for workers to work and be productive
resources aren’t being used efficiently, national output falls, growth slows
gov unemployment payments and welfare benefits may increase
gov tax revenues decrease
impact on SOL
as inequality gap grows, rich get richer poor get poorer
wealthier people access the better education and healthcare, even less opportunity for poorer households in future
impact on social stability
more equal societies are more stable, with lower levels of crime
less equal societies suffer from political instability, social unrest and strife
role of taxation
used to redistribute income as to reduce income inequality
types of taxes:
direct: imposed on income and profits
paid directly to gov by individual or firm
indirect: imposed on spending
the less a consumer spends, the less indirect tax paid
types of tax systems
progressive:
as income rises, a larger percentage of income is paid as tax
regressive:
as income rises, smaller percentage of income is paid as tax
all indirect taxes are regressive
proportional:
as income rises, same percentage of income is paid in tax
indirect taxation and reduction of income inequality
selective use of indirect taxes can be used to improve income inequality
higher tax on luxury goods, goods with a PED>1,
no taxes on essential/necessity goods,
progressive taxation and reduction of income inequality
pros :
reduces disposable income for high income earners, redistributing income from those with higher to those with lower, reducing income inequality
redistribution often starts with provision of free education and healthcare
many govs use tax revenues to provide financial support to poorer households e.g disability payments, heating subsidies
cons:
discourages rich people from working as hard as large proportion of their income goes towards taxes, reducing overall productivity and growth
higher income individuals may participate in tax evasion affecting overall revenue generated
other policies that help break poverty cycle
investing in human capital
more generous transfer payments
establishment/increase of national minimum wage
establishing universal basic income
targeted gov spending on goods
policies to reduce discrimination
investing in human capital
investing in this supply side policy increases potential output of country (shifts PPC outwards)
higher education = higher skills = higher human capital = increased productivity = higher output = higher income
more generous transfer payments
transfer payments: payments made by gov where no goods/services are exchanged
usually given to poorest households, include unemployment, disability, pension payments
more benefits = higher wages = better healthcare/education = better human capital = better productivity = higher wages
cons: disincentives for unemployed people and poor people to accept work that would shorten their period of unemployment, higher burden on gov aswell as high unemployment rates
establishment/increase of national minimum wage
minimum wage set above free market rate
higher wages = better education/healthcare = better human capital = better productivity = higher wages
cons: allocative inefficiency
establishing universal basic incoem
UBI = guaranteed minimum income level, when necessary paid by gov to each individual
minimum income for all = better better education/healthcare = better human capital = better labour offer = decreased unemployment
targeted gov spending on goods/services
spending can be aimed at greatest needs in society
better education = higher human capital = increases productivity = higher output = higher wages
cons: opportunity cost of gov spending
policies to reduce discrimination
less discrimination leads to less social exclusion, leading to decrease in inequalities of opportunity and income
less discrimination = better productivity = higher wages
RWE: transfer payments
in 2003 Brazil enacted a scheme providing cash transfers of 35$ per month to families living below poverty line, aimed to reduce poverty, inequality, break poverty cycle
roughly 11% of population lived below poverty line then
gini coeff fell to 0.489 from 0.595, scheme reached over 46 million people
RWE: progressive taxation
Denmark has one of most progressive tax systems in the world with highest bracket paying up to 55% of income
Denmarks gini coeff fell from 0.282 to 0.277
tax revenue is readily reinvested into provision of free education, healthcare, and very generous paternity leave