EQ1- What are the processes operating within the hydrological cycle from global to local scale?
1/22
There's no tags or description
Looks like no tags are added yet.
Name | Mastery | Learn | Test | Matching | Spaced |
|---|
No study sessions yet.
23 Terms
Hydrological cycle
The circulation of water around the Earth.
closed system: no external inputs + outputs, but stores and flows.
Stores: places where water is held e.g. oceans
Fluxes: the measurement of rate of flow between the stores
Processes: the physical factors which drive the fluxes of water between stores.
Driven by:
Solar energy: more solar energy in the form of heat melts ice→water or evaporates water→water vapour, while less heat condenses water vapour→water or ice→water.
Gravitational potential energy: Causes rivers to flow downhill + precipitation to fall to the ground.
Description of hydrological cycle
Atmosphere: water largely exists as vapour with carrying capacity directly linked to temp. Clouds can contain liquid water or ice crystals (at high altitudes).
Cryosphere (Earth’s ice in all its forms) water: largely found in a solid state, some liquid as melt water + lakes.
Oceans: majority of water is stored in liquid form, only a small fraction as icebergs.
Land:
blue water: stored in rivers, streams, lakes + groundwater in liquid form.
green water: water stored in vegetation or the soil
Relative size + importance of stores
Residence time: the average length of time that a water molecule remains in a store.
-stores with high RT are more easily polluted as water is in situ for long RT’s.
-Soil mositure RT is low as spread thinly across Earth, so water is easily lost by evaporation, percolation, etc.
-Atmosphere RT is low as water evaporated, condenses + falls as rain.
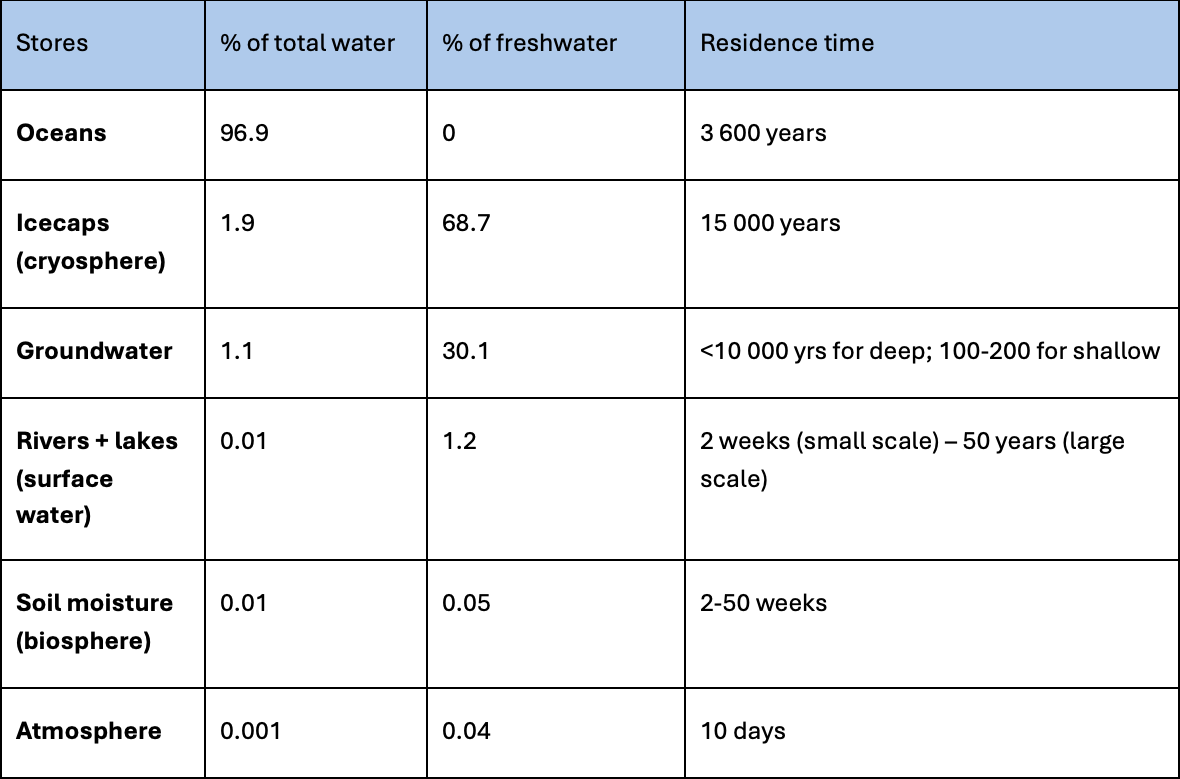
Global water budget
Why is water availability limited?
Global water budget: takes into account all water held in stores + flows of the global hydrological cycle.
3% of global water budget is fresh water (safe for human use). 69% of this is trapped in ice caps, leaving 1% to be easily accessible by humans.
2 non-renewable water stores
Fossil water: Ancient, deep groundwater made form pluvial (wetter) periods in the geological past. e.g. Sahara Desert
Cryosphere losses: Made up of areas where water is frozen into snow/ ice. Water is locked up in ice sheets + glaciers; non-renewable if another ice glacial period comes.
Drainage basin
An area of land around the river drained by the river and its tributaries. The boundary of a drainage basin is defined by the watershed (area of high land).
-subsystem within the hydrological cycle.
Inputs of drainage basins
Orographic (relief) rainfall: Warm wet air forced to rise over high land→air cools+condenses as it rises→clouds form+ precipitation occurs
Convection rainfall: Sun heats ground + warm air rises→air cools + condenses as it rises to form clouds→large cumulonimbus clouds are formed→heavy rain storms occur.
Frontal rainfall: An area of warm air meets area of cold air→warm air forced over cold air→ warm air is cooled + water vapour condenses→clouds form + precipitation occurs.
Flows of drainage basins
Interception: water is retained by plants/ soil. May be evaporated/ absorbed by vegetation.
Infiltration: water soaks into/absorbed by soil.
Direct runoff: Water flows across an impermeable ground’s surface.
Saturated overland flow: The flow of water over the surface of land when the ground is saturated with water.
Throughflow: The lateral(sidewards) transfer of water through soil towards rivers.
Percolation: Deeper transfer of water from soil to permeable rocks.
Groundwater flow: The slow transfer of percolated water through permeable or porous rock.
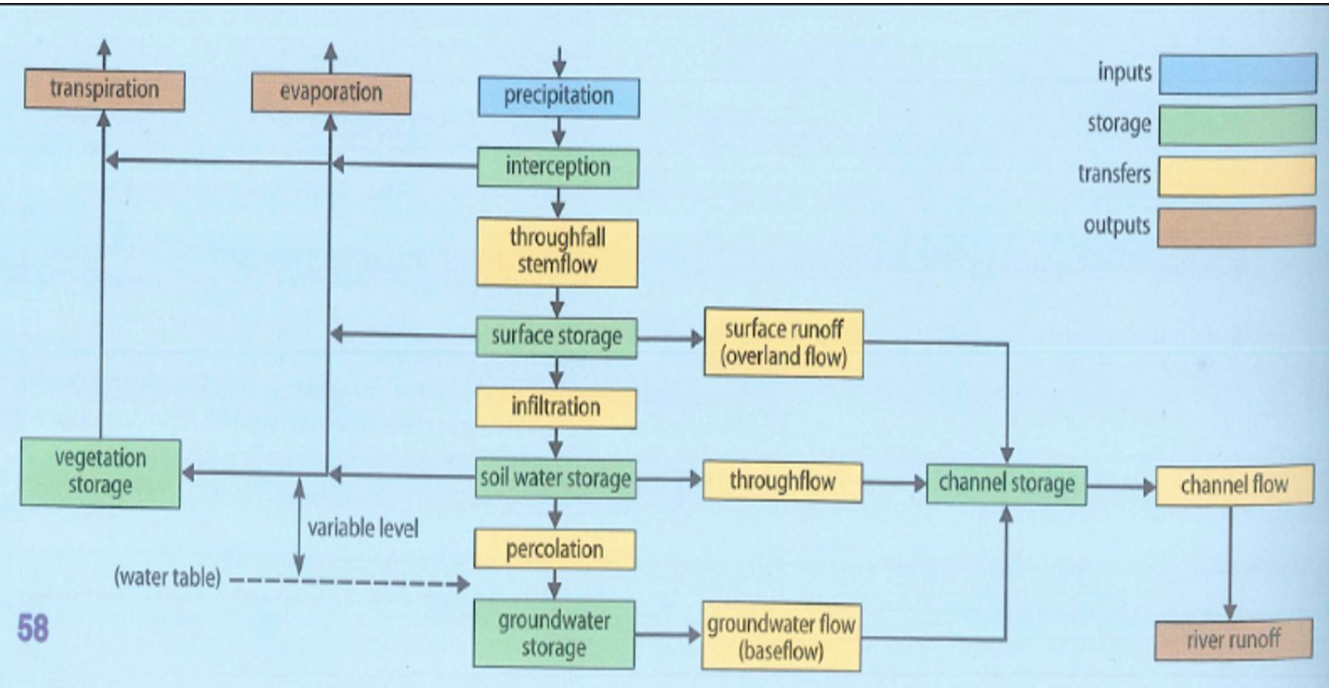
Outputs of drainage basin
Evaporation: Diffusion of liquid water into atmosphere as water vapour.
Transpiration: Water moved through vegetation + evaporates into water vapour.
Channel flow: Water flows into another larger drainage basin e.g. a lake, the sea
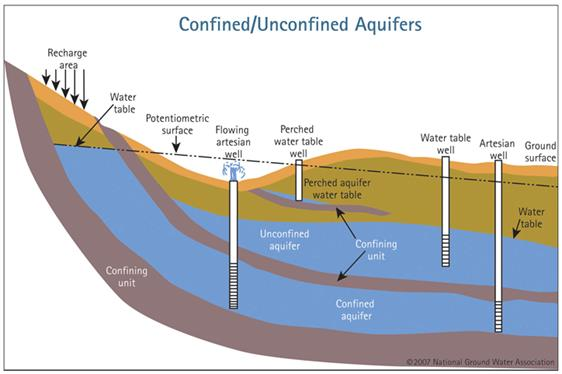
Stores of drainage basins
Aquifer: Rock formations or layers of unconsolidated deposits which have hold substantial volumes of water.
-are permeable + high porosity (many pores)
Confined: enclosed by impermeable rocks
Unconfined: exposed to water
Perched: above water table, sitting above impermeable rock
Aquitard: Rock formations which are impermeable + transmit water more slowly.
Physical factors affecting flows of the drainage basin
Climate: High rainfall→saturates soils→soil becomes less permeable→infiltration decreases+surface runoff increases.
Soils: More porous soil→bigger space for water to infiltrate + less surface runoff.
Vegetation: High vegetation cover→more interception+infiltration→less surface runoff
Geology: Permeable rock→water percolates through pores→less surface runoff
Relief: Higher slope angle→water slips off due to lower SA→less infiltration+more surface runoff.
How humans disrupt drainage basin cycle
Abstraction of water
Accelerating processes: deforestation + land use changes
Abstraction
Water abstracted from groundwater for domestic + industrial use.
Problems of fall in groundwater
Drinking water supplies ↓: wells + springs run dry, causing social problems + water insecurity
Lowers water table: Increases costs as longer pumps are needed to extract groundwater from deeper underground.
Reduced river flow: may cause droughts downstream, river volume decreases which has a negative impact on aquatic ecosystems.
Problems of deforestation e.g. on Amazon basin
More erosion of soil: soil more exposed to precipitation→may affect its properties such as volume of water it can store (less mineral content)→less infiltration + more runoff.
Less interception: Less vegetation→less interception→more flooding.
20% vegetation deforested in past 50 years, making flooding 5 times more common in last century.
Less evaporation+transpiration: as there is less vegetation to carry this out. More droughts, vegetation need moisture to thrive.
Contributes to global warming: more GHG→higher temp + less humidity→less cloud formation + precipitation→more evaporation.
Extreme droughts becoming more frequent- once every 13 years in the Amazon.
Problems of land use changes
Agriculture
Intensive farming- ploughing (application of fertiliser) increases infiltration by loosening and aerating the soil. Impact of machines can compact soil, increasing overland flow.
Urbanisation
Impermeable surfaces: tarmac, tiles, speed surface runoff by reducing percolation + infiltration.
Drainage systems: deliver rainfall more quickly to streams + rivers, increasing chances of flooding.
Water budgets
Relationship between input (precipitation) and output (evapotranspiration) over the year.
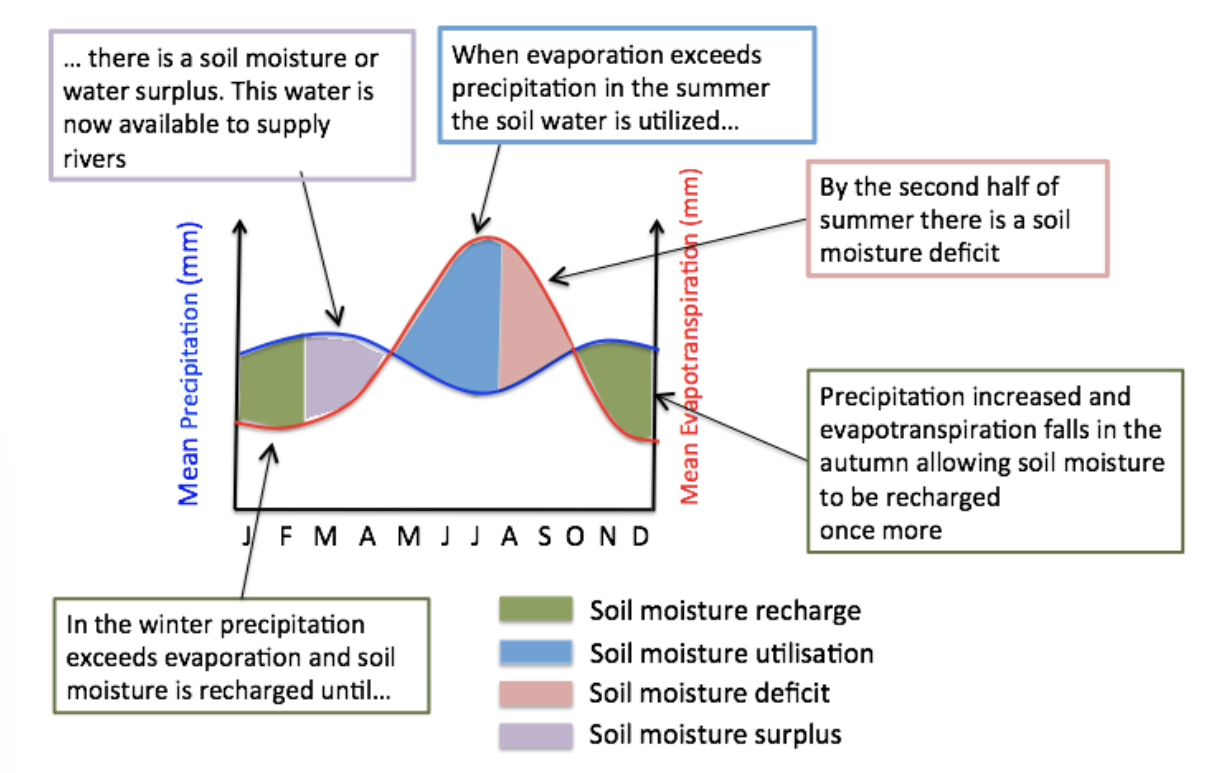
Impact of climate (zones) on water budget- named examples
Desert climates: low precipitation + high potential evapotranspiration all throughout year. e.g. Atacama Desert, Peru
Tropical rainforest climate: high precipitation October→May, then potential evapotranspiration overtakes during summer months. e.g. Bolivia
River regimes
Indicate the annual variation of discharge (volume of water flowing through) of a river throughout the year.
Factors affecting river regimes
Climate: Higher temp in summer- high rates of evaporation + also meltwater. e.g. Yukon river, Alaska. Intense rainfall- heavy rain becomes overland flow (doesn’t sink) + runs off quickly to river.
Geology: Permeable rocks allow groundwater to gradually release into the river through infiltration + percolation.
Soils: High porosity soil allows for water through infiltration to be released into the river gradually.
Contrasting river basins
Indus, India
Meltwater from Himalayas increases discharge in April creates initial peak discharge.
4 month monsoon brings discharge to its peak in July, then river levels drop from dry winter season.
Amazon, S. America
Daily rainfall from convection in Feb+March as sun is directly overhead (270mm mean)
4 month delay for rainfall in Feb to cause peak discharge in June before dropping again due to large basin size
Earth tilts away from sun, reducing rainfall. 5 month delay again until river reaches lowest level in Nov (19m)
Yukon, Alaska + Canada
Snowmelt + melting of permafrost + soils releasing water in May+June cause peak discharge (16 000m3)
Short summer ends in July when water refreezes during winter, arctic soils freeze, reducing river level as no throughflow + runoff occurs.
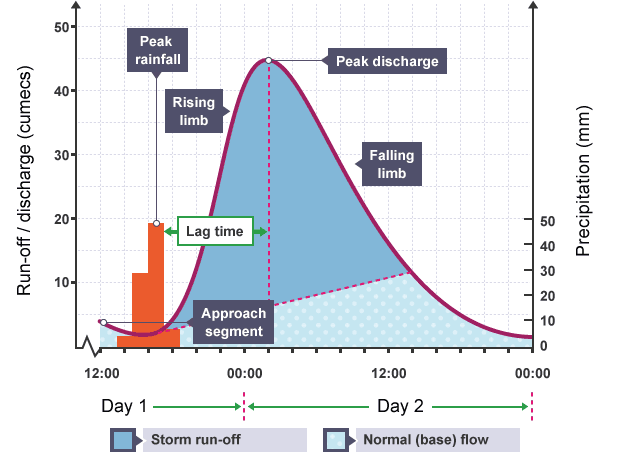
Storm hydrographs
Graph that shows how a river changes as a result of rainfall.
-shows rainfall + discharge
Flashy graph: steep limbs, high peak discharge + short lag time.
Subdued graph: flat limbs, low peak discharge, long lag time.
Physical factors affecting shape of storm graphs (flashy/ subdued)
Size: Larger catchment area of the river basin→higher peak discharge + longer lag time.
Shape: More circular the catchment area→ shorter lag time.
Drainage density: dense drainage network→transport water more efficiently→increased peak discharge.
Rock type: impermeable rocks e.g granite→increase surface runoff→ reduced lag time + increased peak discharge.
Soil: soil is saturated→increased surface runoff→increases peak discharge
Relief: Steeper catchment area of river basin→water reaches river quicker→long lag time + increased peak discharge.
Vegetation: More vegetation→higher infiltration→reduced peak discharge
Human factors affecting shape of storm hydrographs
Urbanisation: increased impermeable surfaces e.g. tarmac→more surface runoff→shorter lag time + greater peak discharge
e.g. River Irwell, Manchester- urbanisation caused floods in 2015 floods in Salford
Land use: soil compacted on agricultural land→more surface runoff→ shorter lag time + higher peak discharge.