LESSON 4: Scores and Standard Normal Distribution
1/35
There's no tags or description
Looks like no tags are added yet.
Name | Mastery | Learn | Test | Matching | Spaced |
|---|
No study sessions yet.
36 Terms
Normal Distribution
also known as the “bell curve”, is the most important and most widely used distribution in statistics
Normal Distribution
It is also called the “Gaussian curve” of Gaussian distribution after the mathematician Karl Friedrich Gauss
Standard Normal Distribution
A _ has a mean of zero and a standard deviation of 1
Features of Normal Distributions
Normal Distributions are symmetric around their mean.
The mean, median, and mode of a normal distribution are equal.
The area under the normal curve is equal to 1.0.
Normal Distributions are denser in the center and less dense in the tails.
Normal distributions are defined by two parameters, the mean ( μ) and the standard deviation (σ)
68% of the area of a normal distribution is within one standard deviation of the mean.
Approximately 95% of the area of a normal distribution is within two standard deviations of the mean.
True
True or False
Normal Distributions are symmetric around their mean.
True
True or False
The mean, median, and mode of a normal distribution are equal.
True
True or False
The area under the normal curve is equal to 1.0.
True
True or False
Normal Distributions are denser in the center and less dense in the tails.
True
True or False
Normal distributions are defined by two parameters, the mean ( μ) and the standard deviation (σ)
True
True or False
68% of the area of a normal distribution is within one standard deviation of the mean.
True
True or False
Approximately 95% of the area of a normal distribution is within two standard deviations of the mean.
Kurtosis
refers to the degree to which the distribution of data is flat or peaked
Mesokurtic
considered to be closest to normal
Leptokurtic
peaked distribution
Platykurtic
flat
z-SCORE
a standardized version of a raw score (x) that gives information about the relative location of that score within its distribution
True
True or False
Raw score means nothing and z-scores are golden
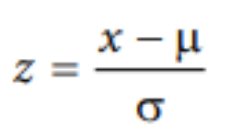
For Population (z-Score)

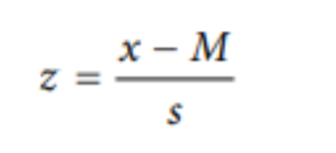
For Sample (z-Score)

Scale
how far apart the scores are (their spread) and where they are located (their central tendency)
Standard Score
raw score that has been converted from one scale to another scale
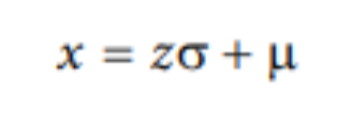
For Population (Setting The Scale of a Distribution)

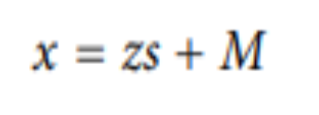
For Sample (Setting The Scale of a Distribution)

Normalized Standard Score Scale: Z-Score
Mean: 0
SD: 1
Normalized Standard Score Scale: T-Score
Mean: 50
SD: 10
Normalized Standard Score Scale: Stanine
Mean: 5
SD: 2
Normalized Standard Score Scale: STEN
Mean: 5.5
SD: 2
Normalized Standard Score Scale: IQ
Mean: 100
SD: 15
Standardization
a process of converting all of the scores in the distributions into z scores; a process where different variables are put on the same scale
Area Under the Curve
bounded by a single z score or pair of z scores
always equal to 1.0
Area in the Tails of the Distribution
the proportion of the area outside the deviation
True
True or False
All normal distributions are symmetrical.
2.
False
True or False
All normal distributions have a mean of 1.0
False
True or False
All normal distributions have a standard deviation of 1.0.
True
True or False
The total area under the curve of all normal distributions is equal to 1
What does a z score of 0.00 represent?
indicates that the data point is identical to the mean of the standard normal distribution.