Unit 3- Part B- Data collection, processing and analysis/interpretation
1/30
Earn XP
Description and Tags
This is from the Pearson edexcel Foundation diploma in applied science Book 1
Name | Mastery | Learn | Test | Matching | Spaced | Call with Kai |
|---|
No analytics yet
Send a link to your students to track their progress
31 Terms
What is the meaning of anomalous results?
Results that do not appear to fit the trend in the data
What is it important to do when collecting data?
Take measurements accurately and to the appropriate level of precision
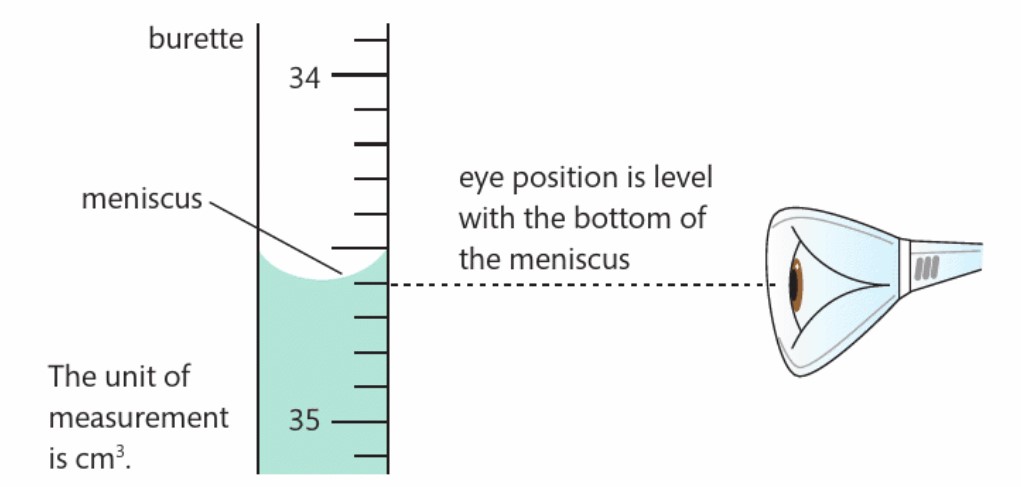
What must you do when reading a volume on a burette or measuring cylinder?
Take the reading at eye level and at the bottom of the meniscus every time, to eliminate human error and make sure your measurements are reliable
What should you do to make sure that the data you are collecting is reliable?
Take repeat readings.
What can taking repeated reading also help you identify?
If any results are anomalous
What can you do if you find a result is anomalous?
You can ignore it when plotting a graph of the result or calculating the mean
What is the meaning of quantitative data?
Data which involves using numbers
What is the meaning of mean?
The sum of all the results divided by the number of results
what is the meaning of qualitative data?
Observations made without using numbers
What is standard deviation?
A measure of how far data values are from the mean value
What is the formula for standard deviation?
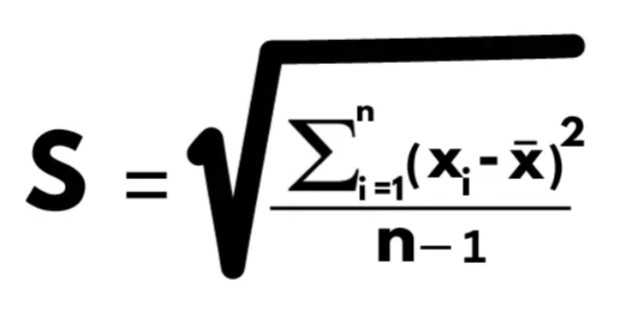

What does Σ stand for?
The letter sigma stands for the sum of

What does x̄ for?
The mean

What does n stand for?
The number of data values

What does Xi mean?
A particular value
What are the steps towards finding the standard deviation?
Find the mean
Subtract the mean from each of your data values to get the deviations
Square each deviation and add them all up
Divide this figure by one less than your sample number
The standard deviation is the square root of this number

What is the meaning of frequency?
How often a particular value occurs in a set of values
Why do we use statistical tests?
To test or support a hypothesis or to see if there is a relationship between two quantities or factors
What does significance level or confidence level (p) mean?
it is a figure used to reject or accept the null hypothesis
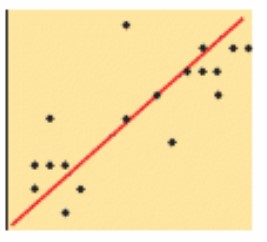
What is the meaning of positive correlation?
When x increases, y increases, the line of best fit has a positive slope
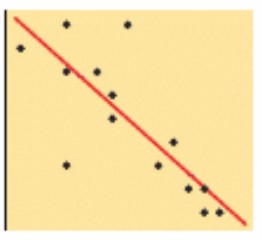
What is the meaning of negative correlation?
When x increases, y decreases ,the line of best fit has a negative slope
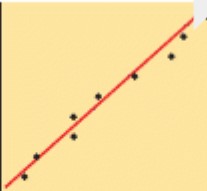
What is the meaning of the line of best fit?
A straight line or smooth curve drawn to pass through as many data points as possible
What is the meaning of a strong correlation?
When most of the data points are close to the line of best fit
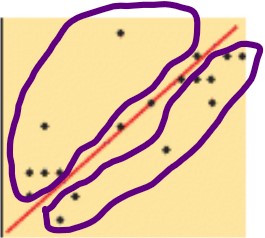
What is the meaning of a weak correlation?
When the data points are more widely scatters around the line of best fit
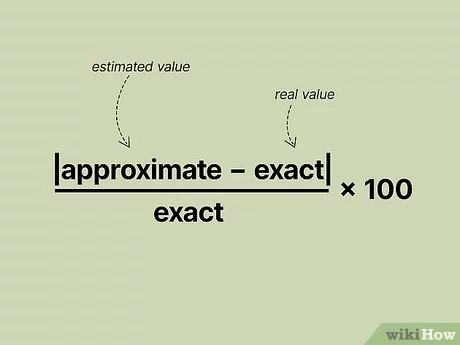
What is percentage error?
The maximum and minim degree of accuracy
How do you measure percentage errror?
What are the different ways of displaying results?
results table
Frequency table
Pie charts
bar charts
Histograms
Line graphs
What are the three types of variables?
Categoric
Discrete
Continous
What does a categoric variable mean?
Data with specific labels such as melting points of the alkali metals or percentages of gases in the air
What does a discrete variable mean?
Whole number data such as the number of prickles on a holly leaf
What does a continuous variable mean?
Data that can be any number for example, the change of temperature of a reaction mixture over time