Sinusoidal Functions (MCR3U - Functions)
1/22
There's no tags or description
Looks like no tags are added yet.
Name | Mastery | Learn | Test | Matching | Spaced | Call with Kai |
|---|
No analytics yet
Send a link to your students to track their progress
23 Terms
Domain
the set of x-value upon which a factor is defined
Central Axis
the horizontal line that lies exactly halfway between the maximum and minimum values of the graph of a periodic function
Phase shift
the amount by which a periodic function is horizontally translated
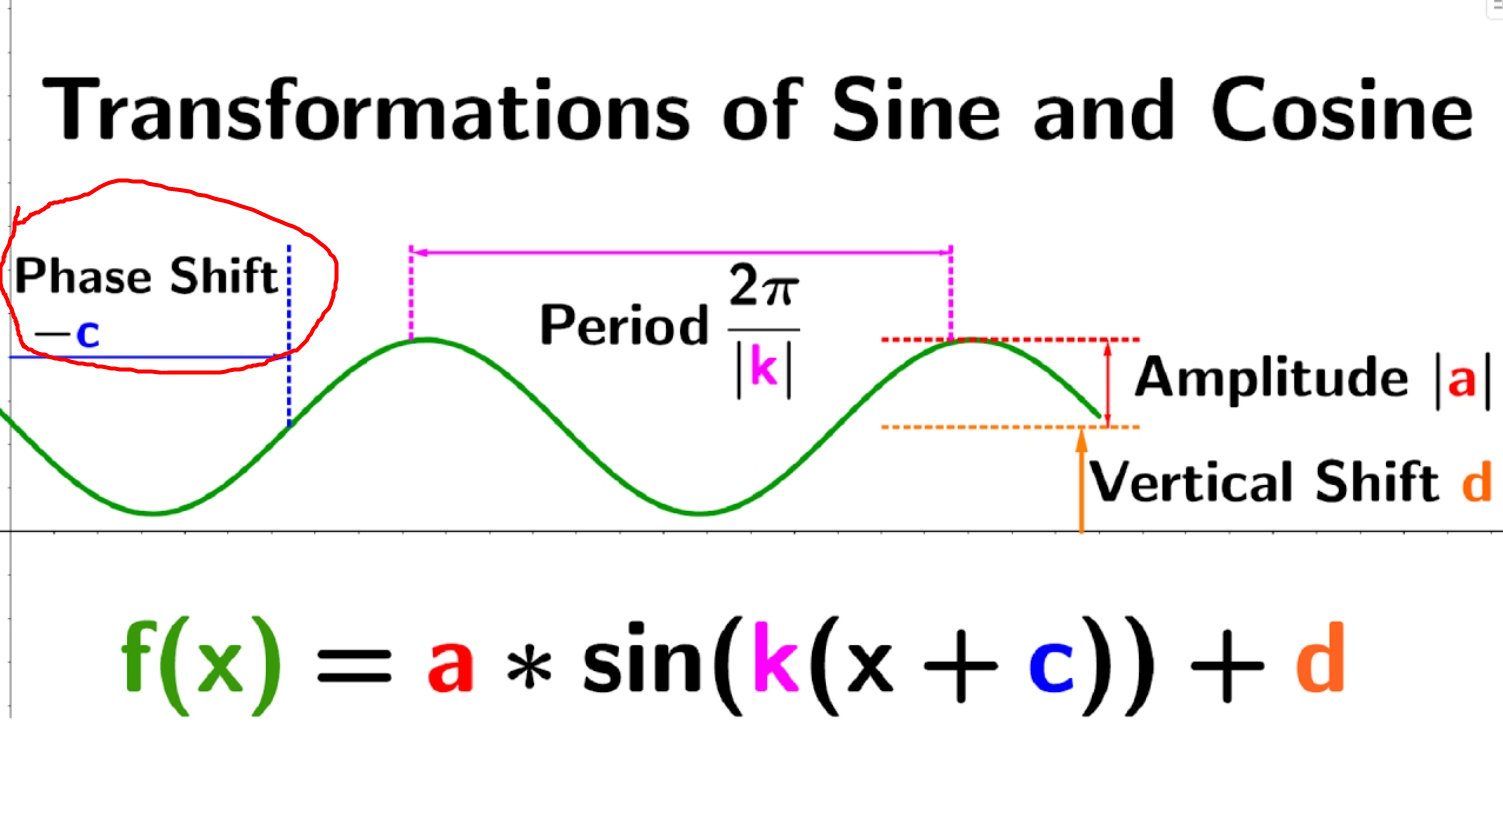
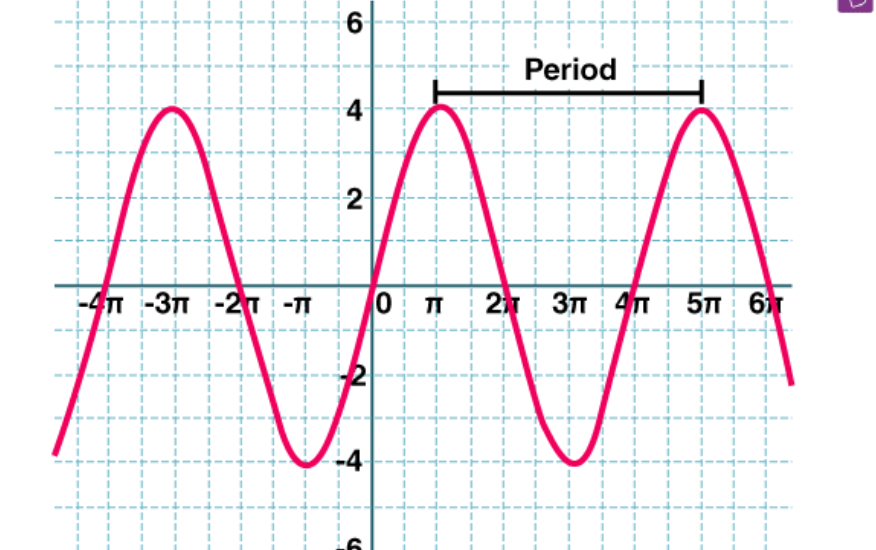
period
the length of one cycle; graphically, the amount along the horizontal axis it takes a periodic function to complete one cycle.
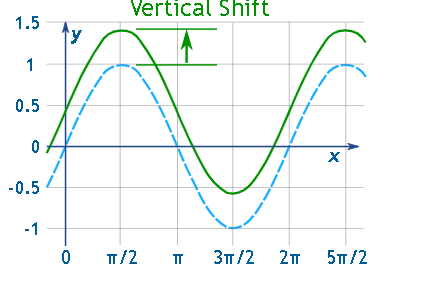
vertical displacement
the height of the central axis of a periodic function or the amount by which a periodic function is vertically translated
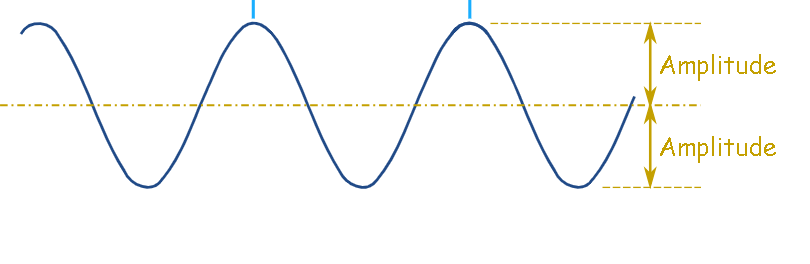
amplitude
half the distance between the maximum and the minimum values of a periodic function; the distance from the central axis to the minimum or maximum value
range
the set of y-values for which a function is defined
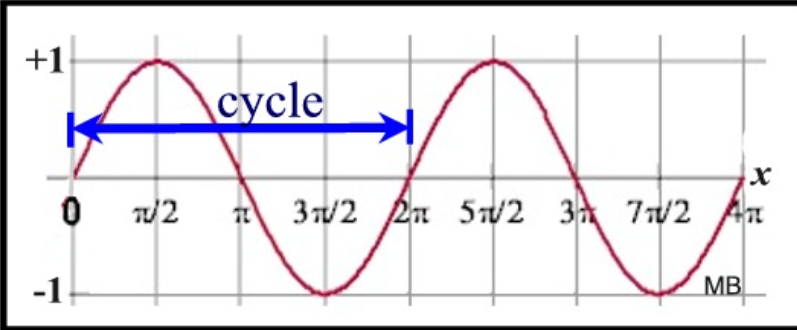
cycle
a single complete execution of a periodically repeated phenomenon
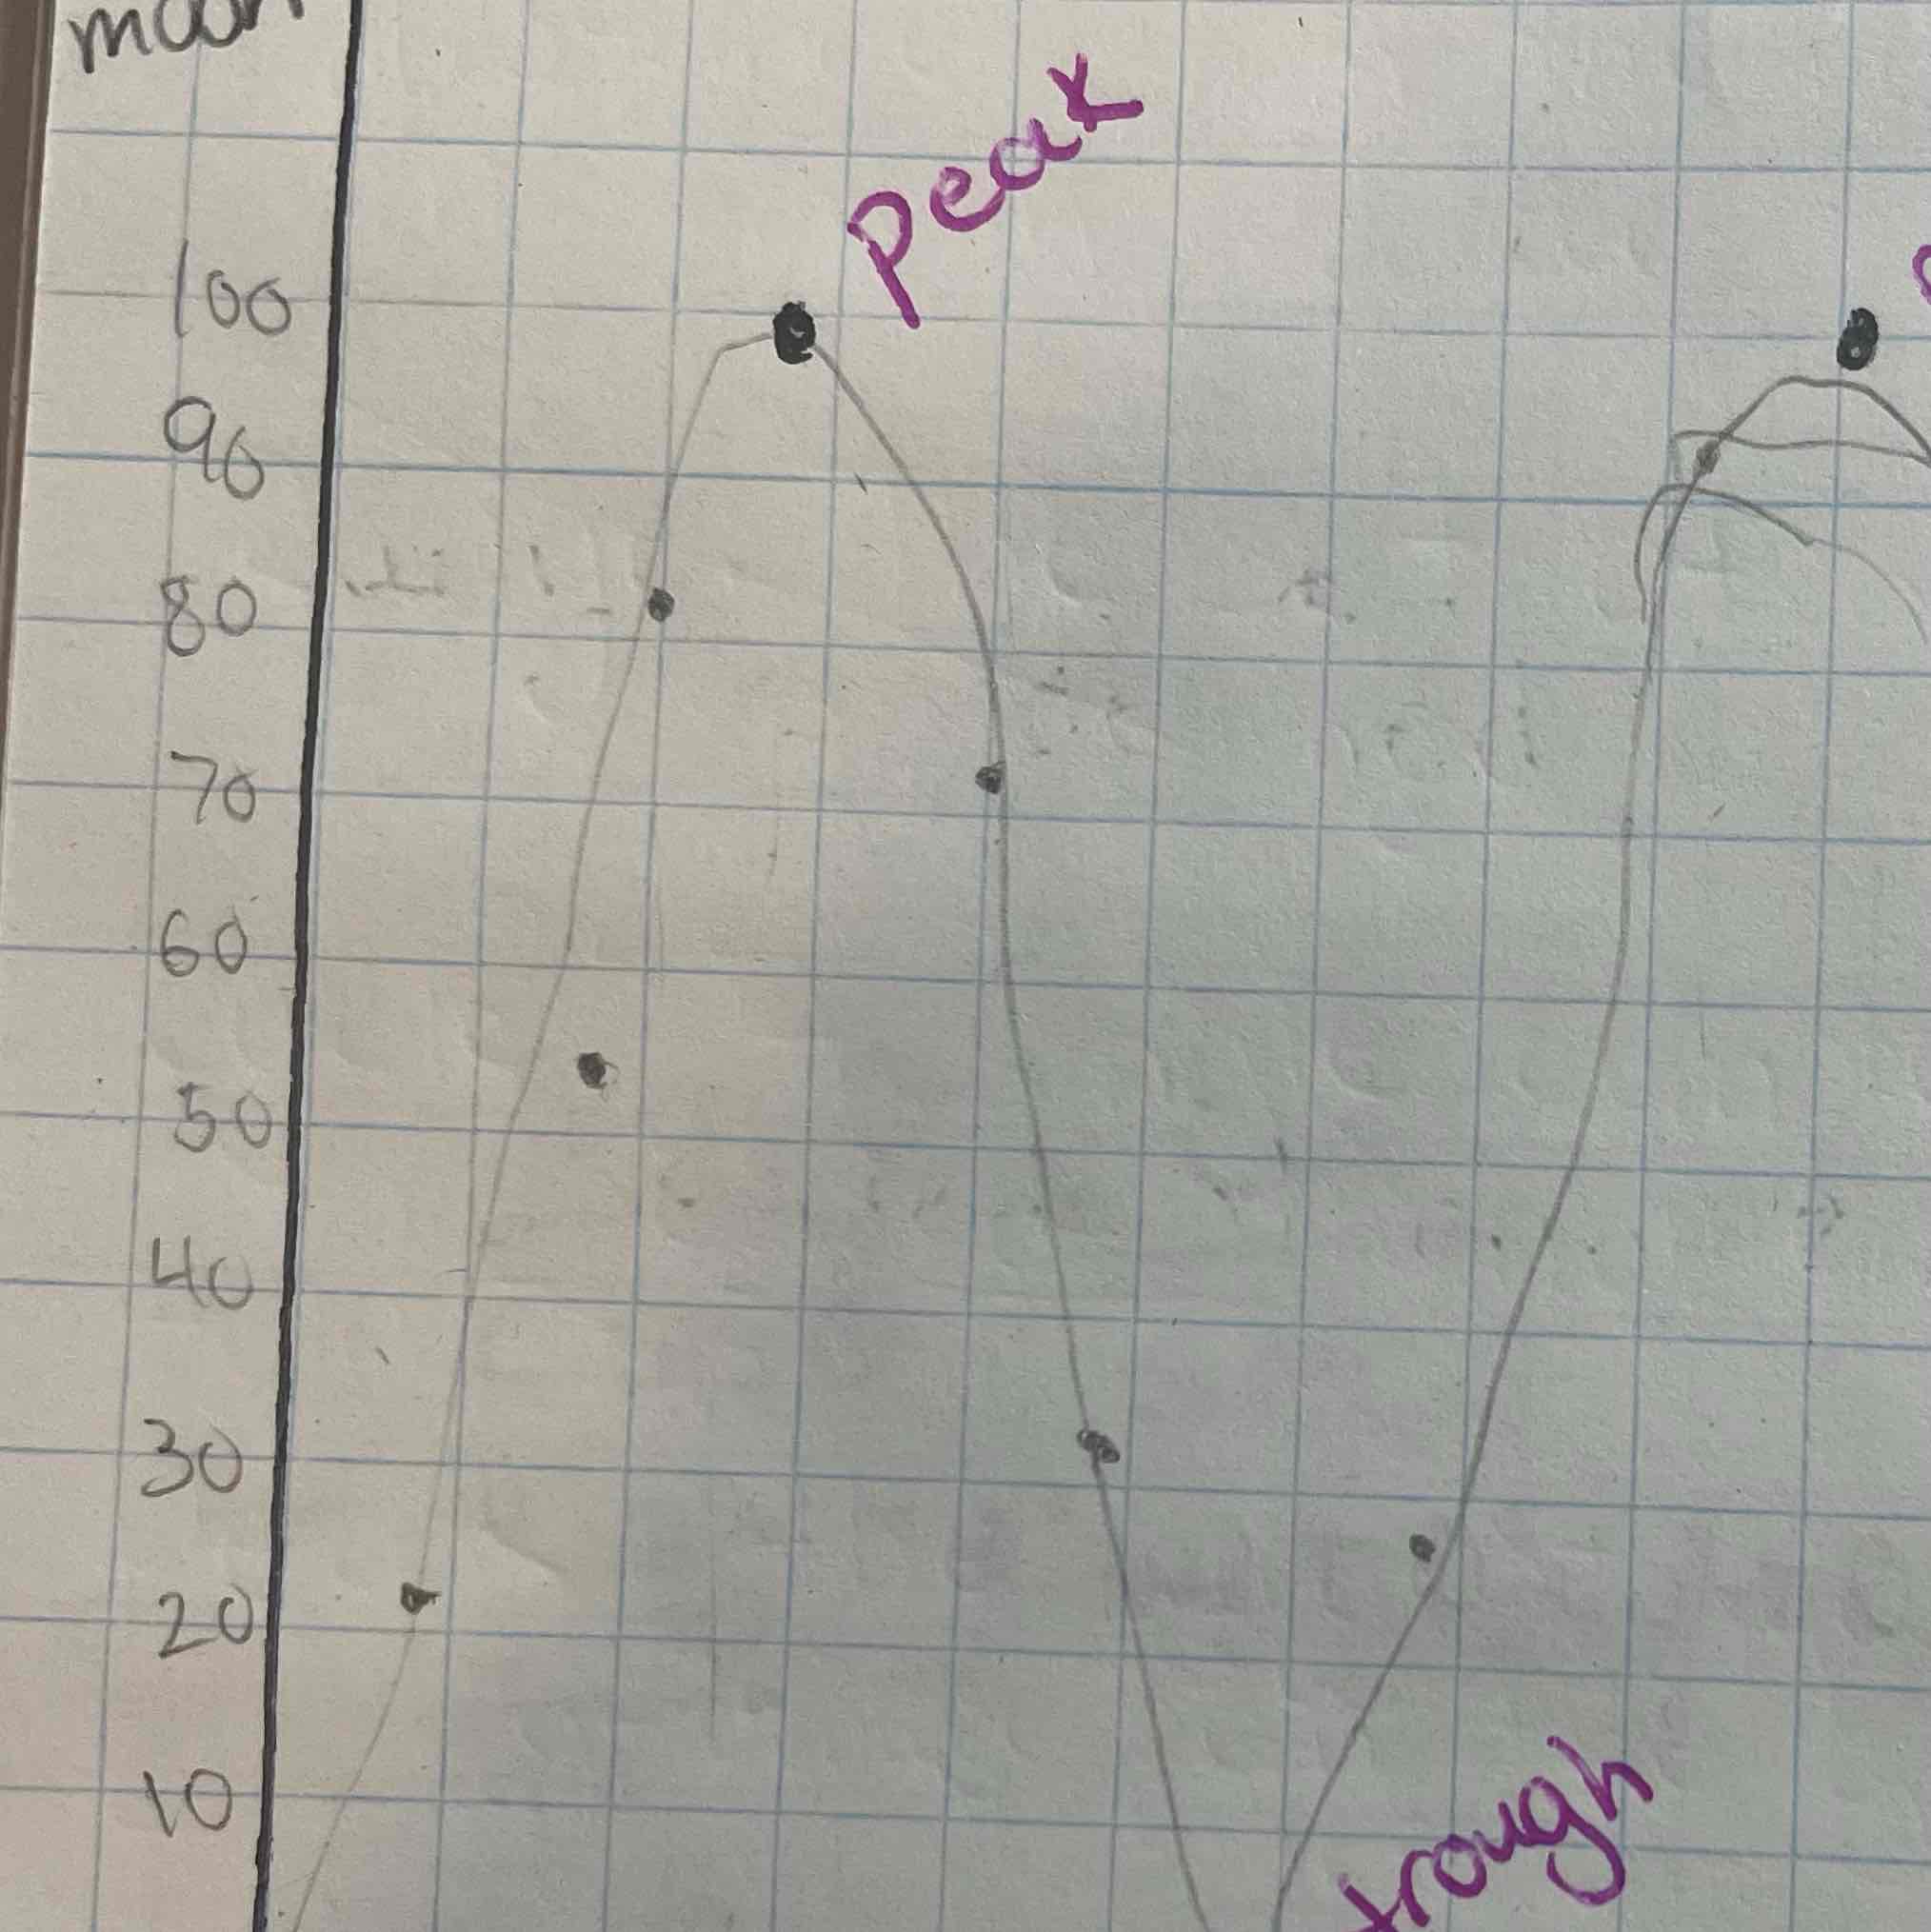
peak
the largest value of a function; the highest y value on the graph of a function
trough
the smaller values of the function; the lowest y-value on the graph of a function
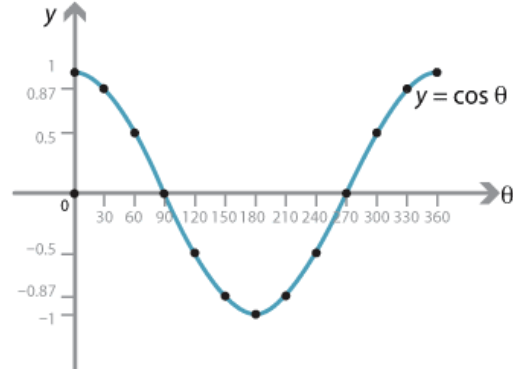
what are the main points of the cosine function?
What are the main points of the sin function?
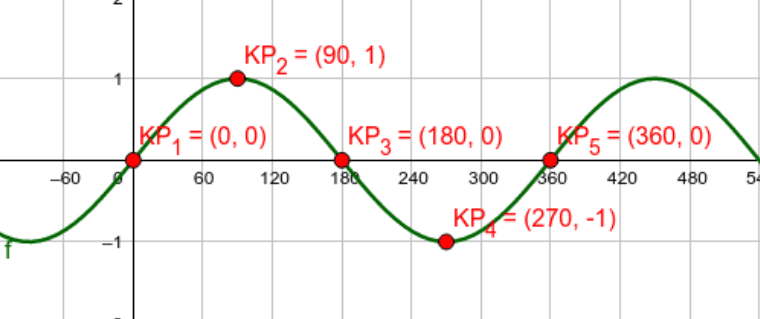

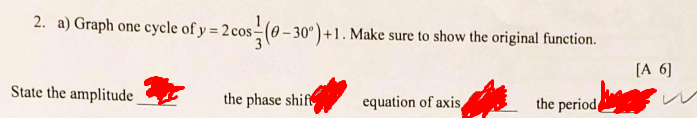
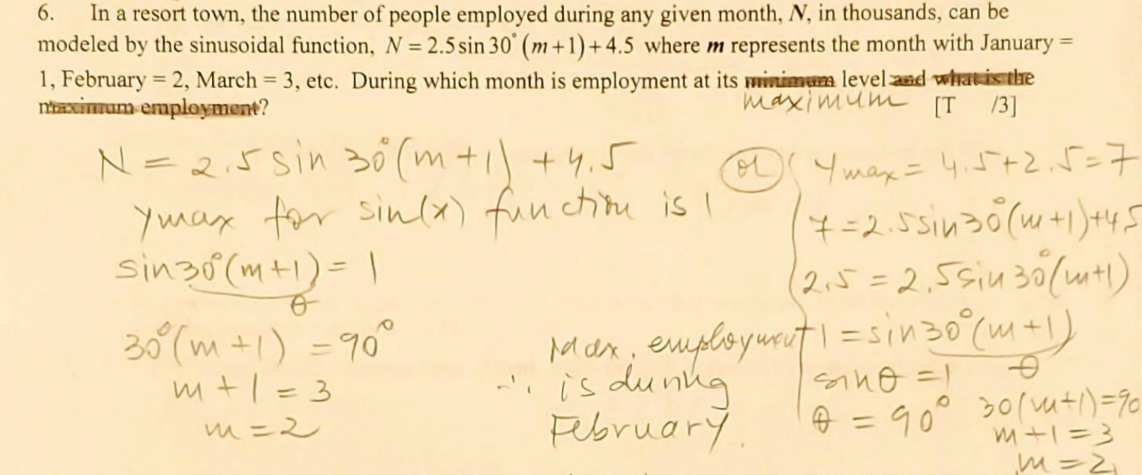
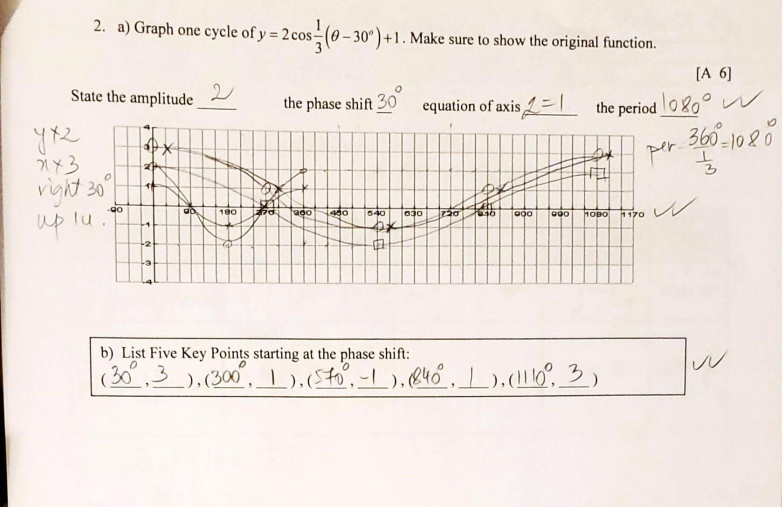
solve and list five main points
write sin and cos question
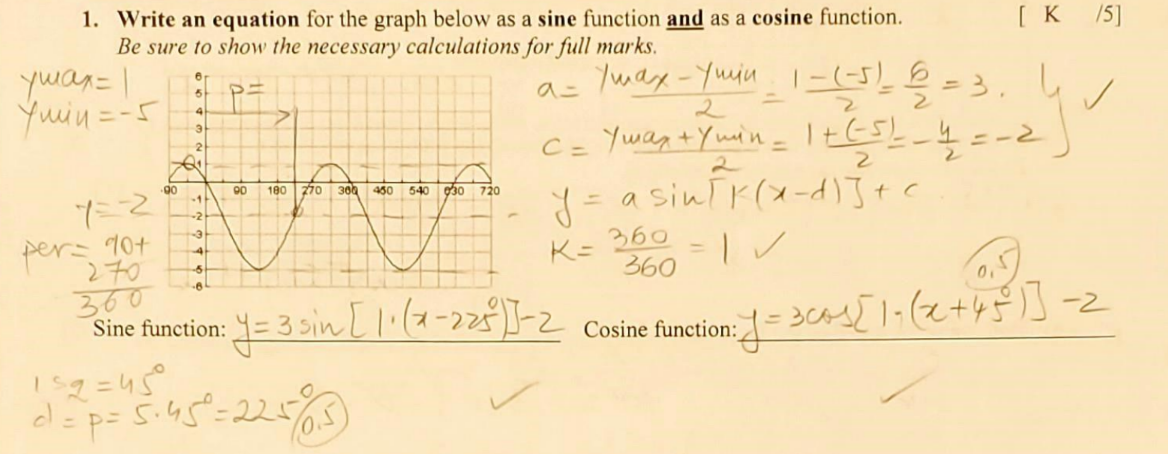
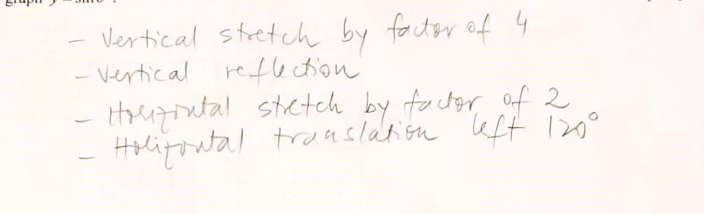
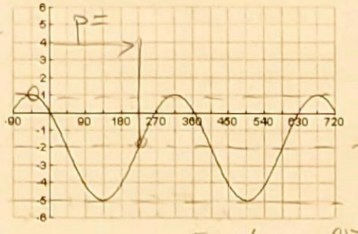
write equation of sin
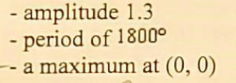
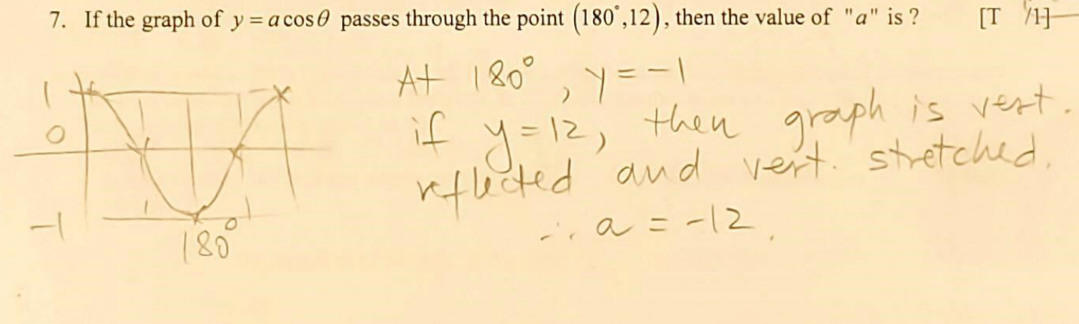
write equation of cos
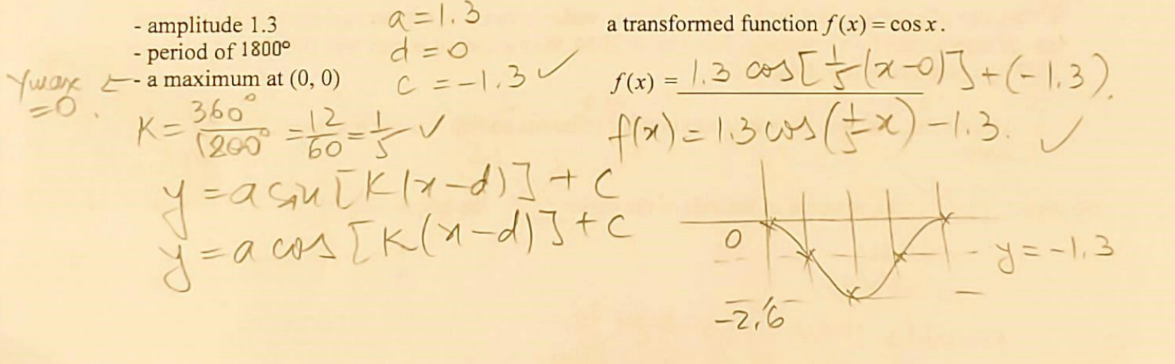
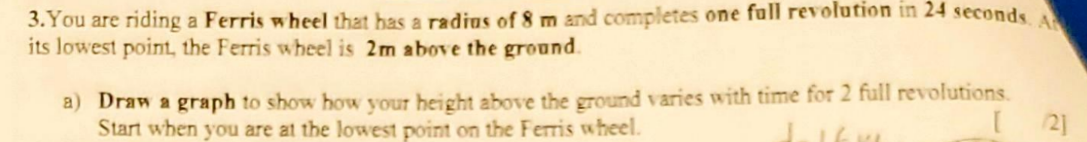
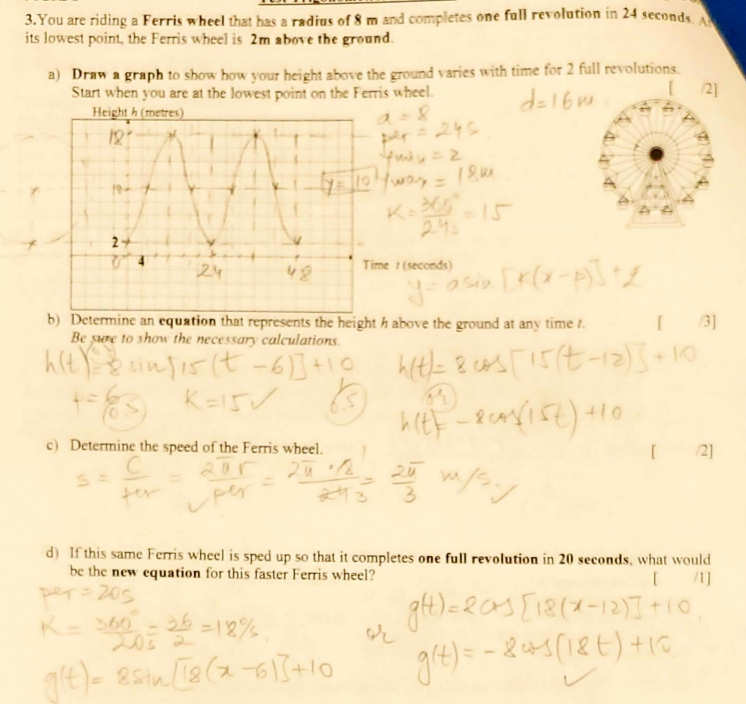
b) determine an equation that represents the height h above the ground at any time t.
c)determine the speed of the Ferris wheel
d) if this same ferris wheel is sped up so that it completes one full revolution in 20 seconds, what would be the new equation for this faster wheel

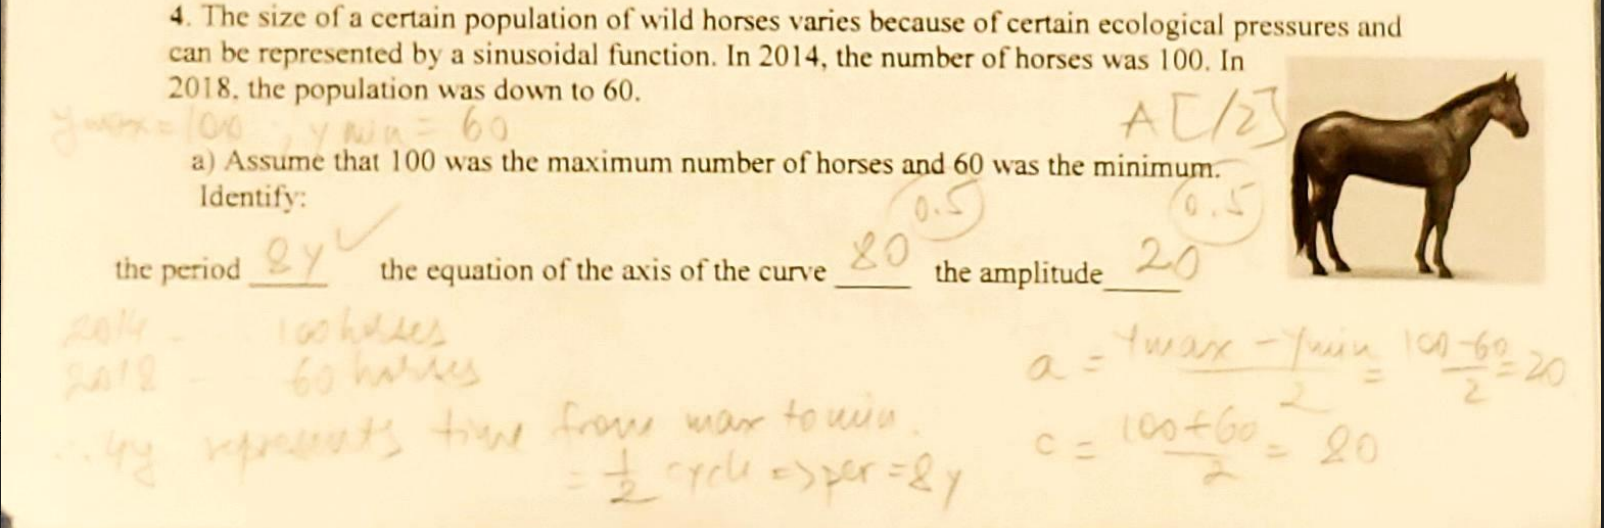
a) assume that 100 was the maximum number of horses and 60 was the minimum. Identify the period, equation of the axis, amplitude
b)draw a graph representing one cycle starting at 2014
c) at what years is the horses population at its minimum level? write the general statement
d) write an equation that models the horse population in terms of what year it is
e)predict the number of horses in the year 2044.