More general Y1 stats
 Call Kai
 Learn
Learn Practice Test
 Spaced Repetition
 Match
Match Flashcards
 Knowt Play
1/16

There's no tags or description
Looks like no tags are added yet.
17 Terms
If a grouped frequency table is given, and the variable type is continuous, what is the class width for the row 32-34 if the above row is 30-31 and the below row is 35-40?
the values have been rounded to the nearest integer
The upper bound is 34.5
The lower bound is 31.5
The class width is 3
When would be best to use the mode as a measure of central tendency?
When the data given is qualitative
When would be best to use the median as a measure of central tendency?
When there are extreme values in the data
When would be best to use the mean as a measure of central tendency?
When you want a true value for the measure of central tendency
How do you find the position of the lower quartile for discrete data?
n/4 : if this is an integer then go halfway between this position and the next (average / midpoint of those two values),
if this is a decimal, round up to the next integer/position and choose this
What are you assuming when using linear interpolation?
That data is distributed evenly within the classes (thus data is continuous)
What do percentiles do?
Split the data into 100 parts
True or false? You should use the rounding rule for discrete data quartile positions when finding a percentile of discrete data?
True
What is (x - x bar) ?
The difference between every value and the mean
How can you use your calculator to find summary stats like variance?
Use the statistics section, enter your list (and a list of corresponding frequencies if applicable)
Define:
Sample space
Probability distribution
Sample space : the set of all possible values of a random variable
Probability distribution : describes the probability of any outcome in the sample space
Define: Probability mass function
Probability mass function : a way of describing the probability distribution e.g. : P(X=x) = 1/6 x=1,2,3,4,5,6
Besides a probability mass function, how can probability distributions be shown?
With a table,
With a graph
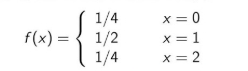
What is the best notation for a probability mass function?
What are the 4 requirements to describe a random variable using a Binomial distribution?
T : Two possible outcomes
I : Independent trials
n : A fixed number of trials
S : a fixed probability of success
Define : Random variable
Random variable : the value of the variable depends on the outcome of a random event
Define: Discrete uniform distribution
Discrete uniform distribution : when the probability of every element of the sample space is the same
e.g. rolling a fair dice