FREQUENCY DISTRIBUTION AND GRAPHS
1/13
There's no tags or description
Looks like no tags are added yet.
Name | Mastery | Learn | Test | Matching | Spaced |
|---|
No study sessions yet.
14 Terms
first nurse to use graphic representational statistics
Sanitary conditions in scutari
Florence Nightingale
organizing raw data in table form
Frequency Distribution:
Frequency Distribution 2 types
Categorical frequency distribution → NOMINAL (Characteristics)
Grouped frequency distribution → ORDINAL (ranking)
Whats in the CATEGORICAL data table (from left to right)
Class
Tally
Frequency
Percentage
Whats in the GROUPED frequency distribution table (from left to right)
Class Limit
Class boundaries
Tally
Frequency
Cumulative Frequency
Relative Frequency %
Cumulative Frequency %
FORMULA for Percentage
% = f/n x 100
f- frequency value
n- total of frequencies
FORMULA for Range
highest - lowest value
Round UP if merong decimal ( NOT ROUND OFF)
Sturge’s Formula (k is constant)
#Interval = Range / (K)
K = 1. 3.322 log N
N = total number of observations
I = size of interval
FORMULA for Class boundaries
Lower boundary = - 0.5
Upper boundary = + 0.5
Cumulative Frequency
Add from previous frequency values
Total must be = total number of observations
FORMULA for Relative Frequency %
F/ N x 100
F = frequency
N= total number of observations
FORMULA for Cumulative Frequency %
Cumulative Frequency %
Add from previous cumulative frequency
Total must be = 100%
UNGROUPED FREQUENCY DISTRIBUTION TABLE
CLASS LIMIT : no range ( can be used if numbers are not scattered and if small ang total)
Lowest data
In between
Highest data
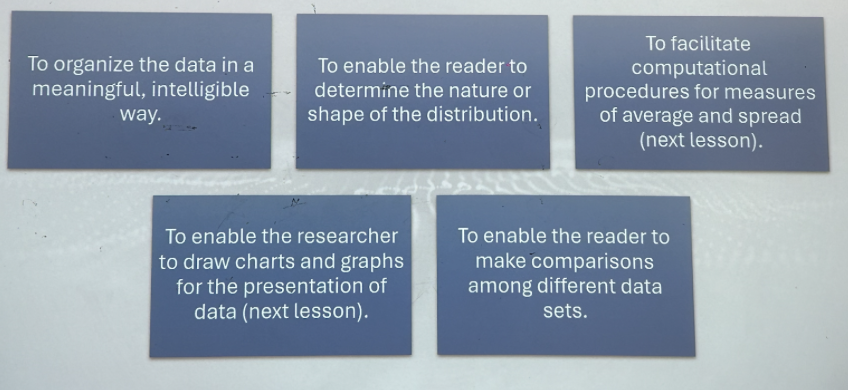
Reasons for Constructing FREQUENCY DISTRIBUTION TABLE [5]