LEC 7: CH8:𝜒 2 Goodness-of-Fit Test: Fitting Probability Models to Frequency Data
1/14
There's no tags or description
Looks like no tags are added yet.
Name | Mastery | Learn | Test | Matching | Spaced | Call with Kai |
|---|
No analytics yet
Send a link to your students to track their progress
15 Terms
Example of a probability model: the proportional model
A proportional model is a probability model in which the frequency of occurrences of events is proportional to number of opportunities
Hypotheses for X 2 test
H0 : Observed data come from an expected probability distribution (e.g., from our proportional model)
HA : Observed data do not come from the expected probability distribution
X² Goodness-of-fit test
Uses 𝜒 2 test statistic (Greek letter chi; “kye”)
• Compares observed frequencies against a frequencies expected under null hypothesis
Test statistic for x² test
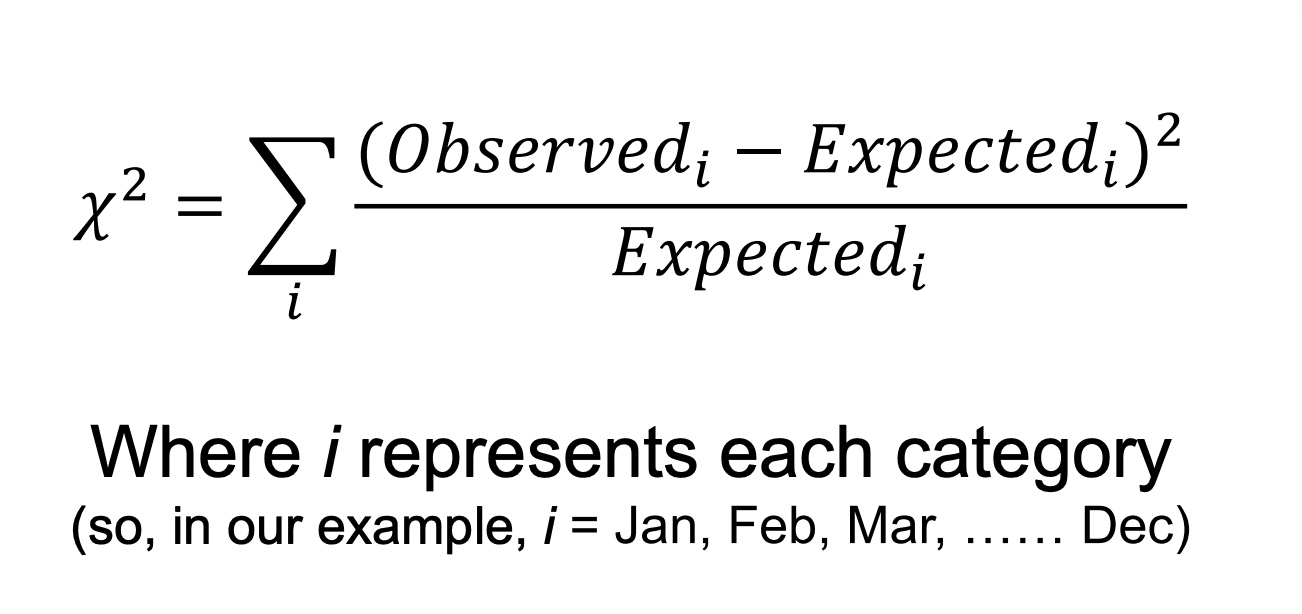
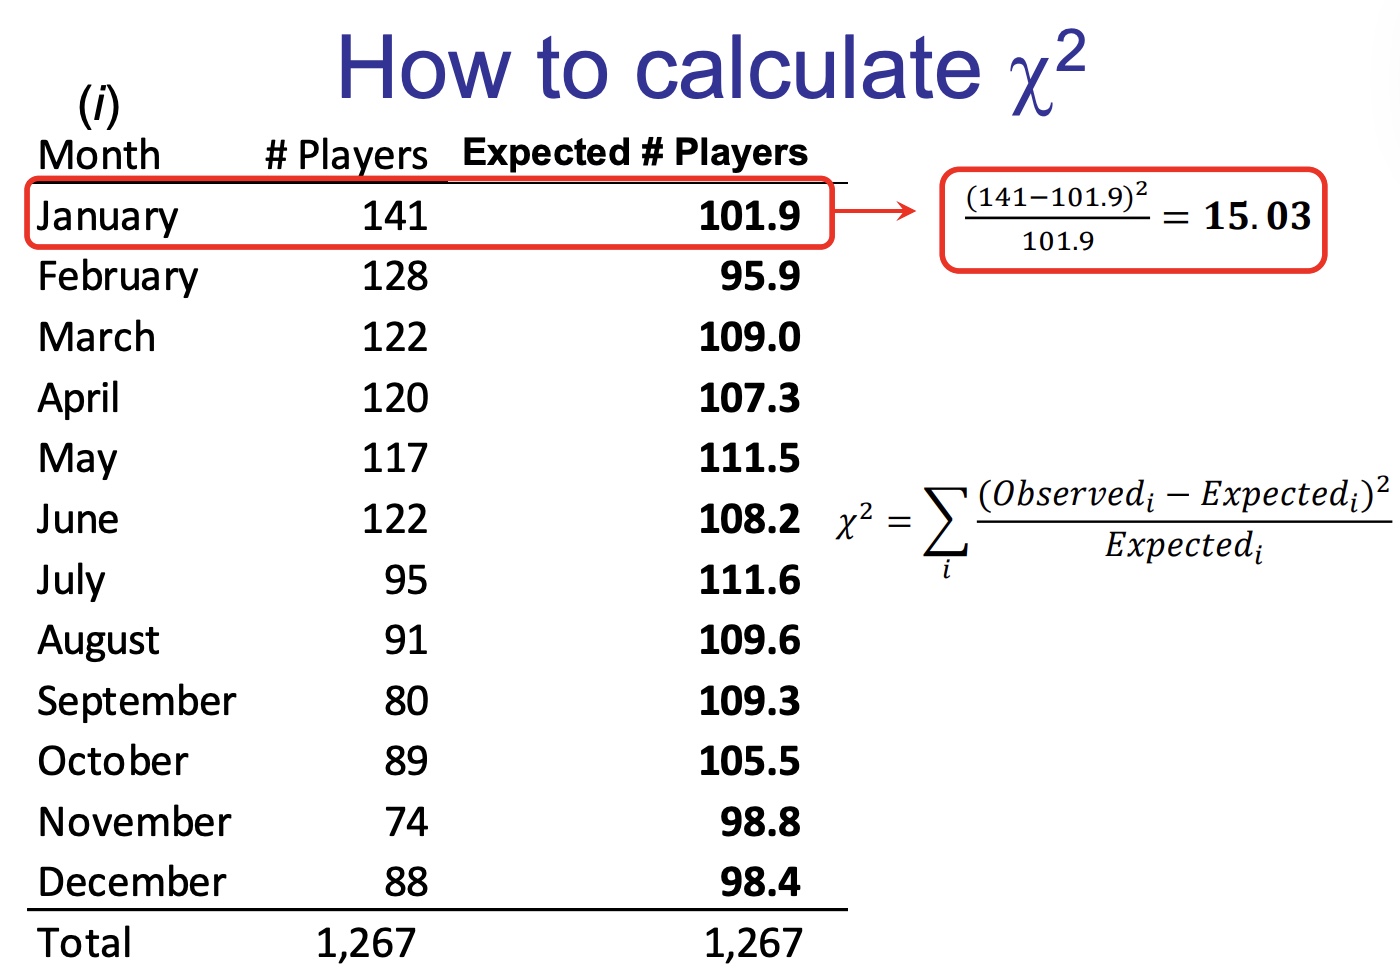
How to calculate x2
in my own words:
the number of players are the observed, the expected states it clearly. subtract the observed with the expected and divide it by the expected. once you get the values individually for each month, add all of the values to get x² (in this case its 53)
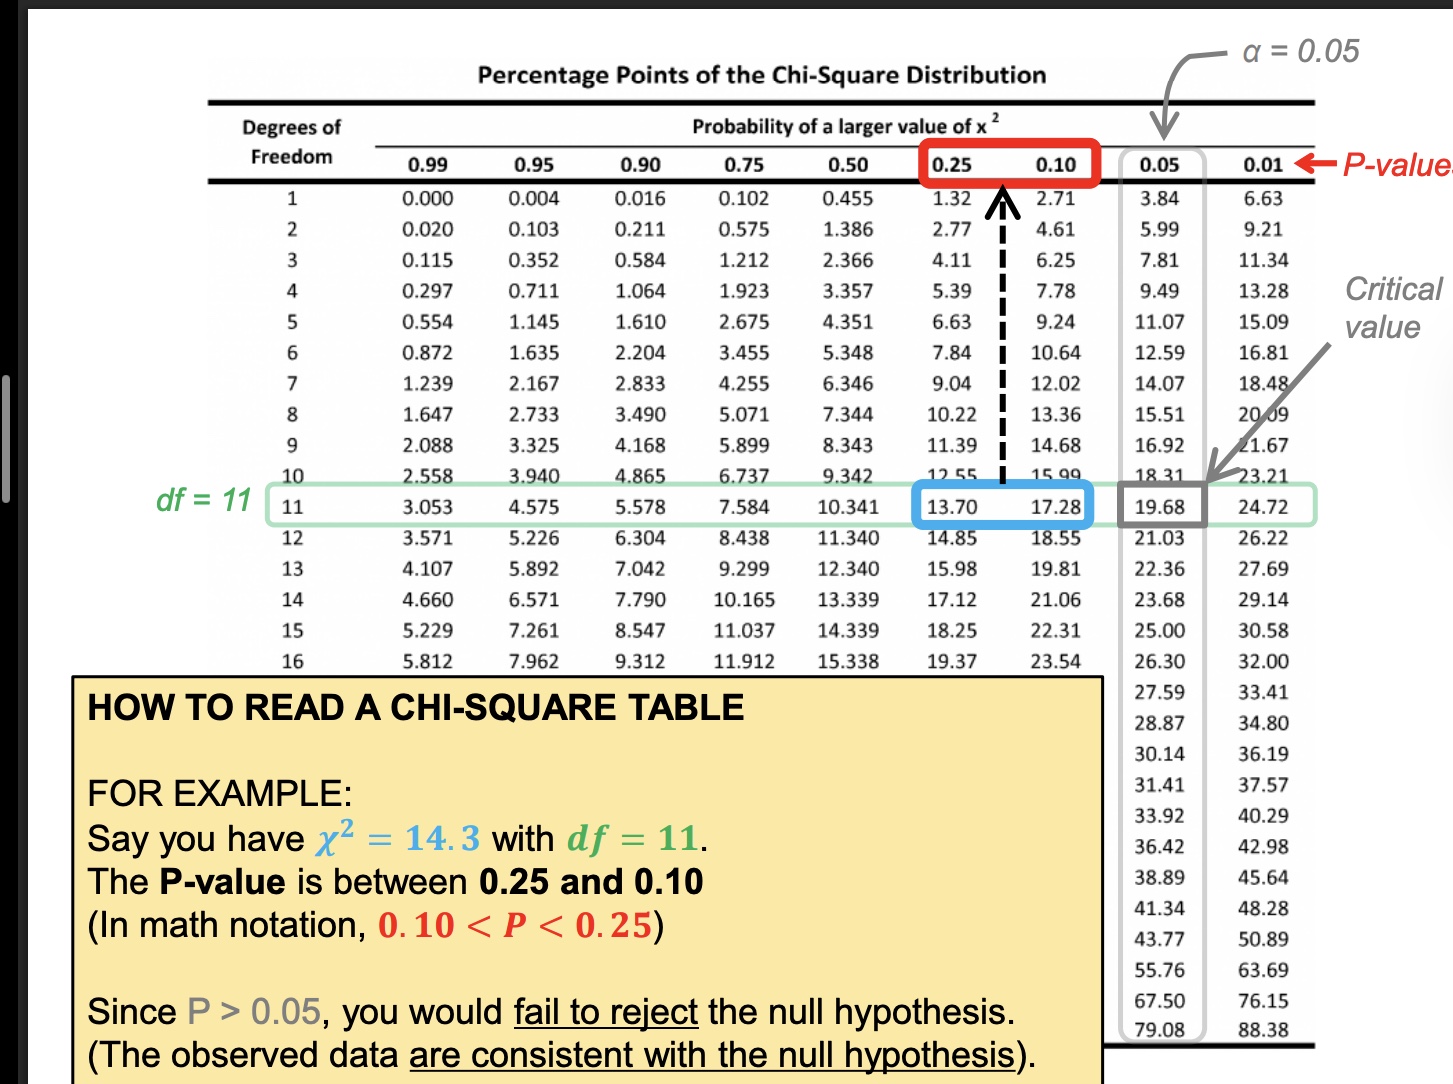
Getting a P-value form 2
the 11 is degrees of freedom
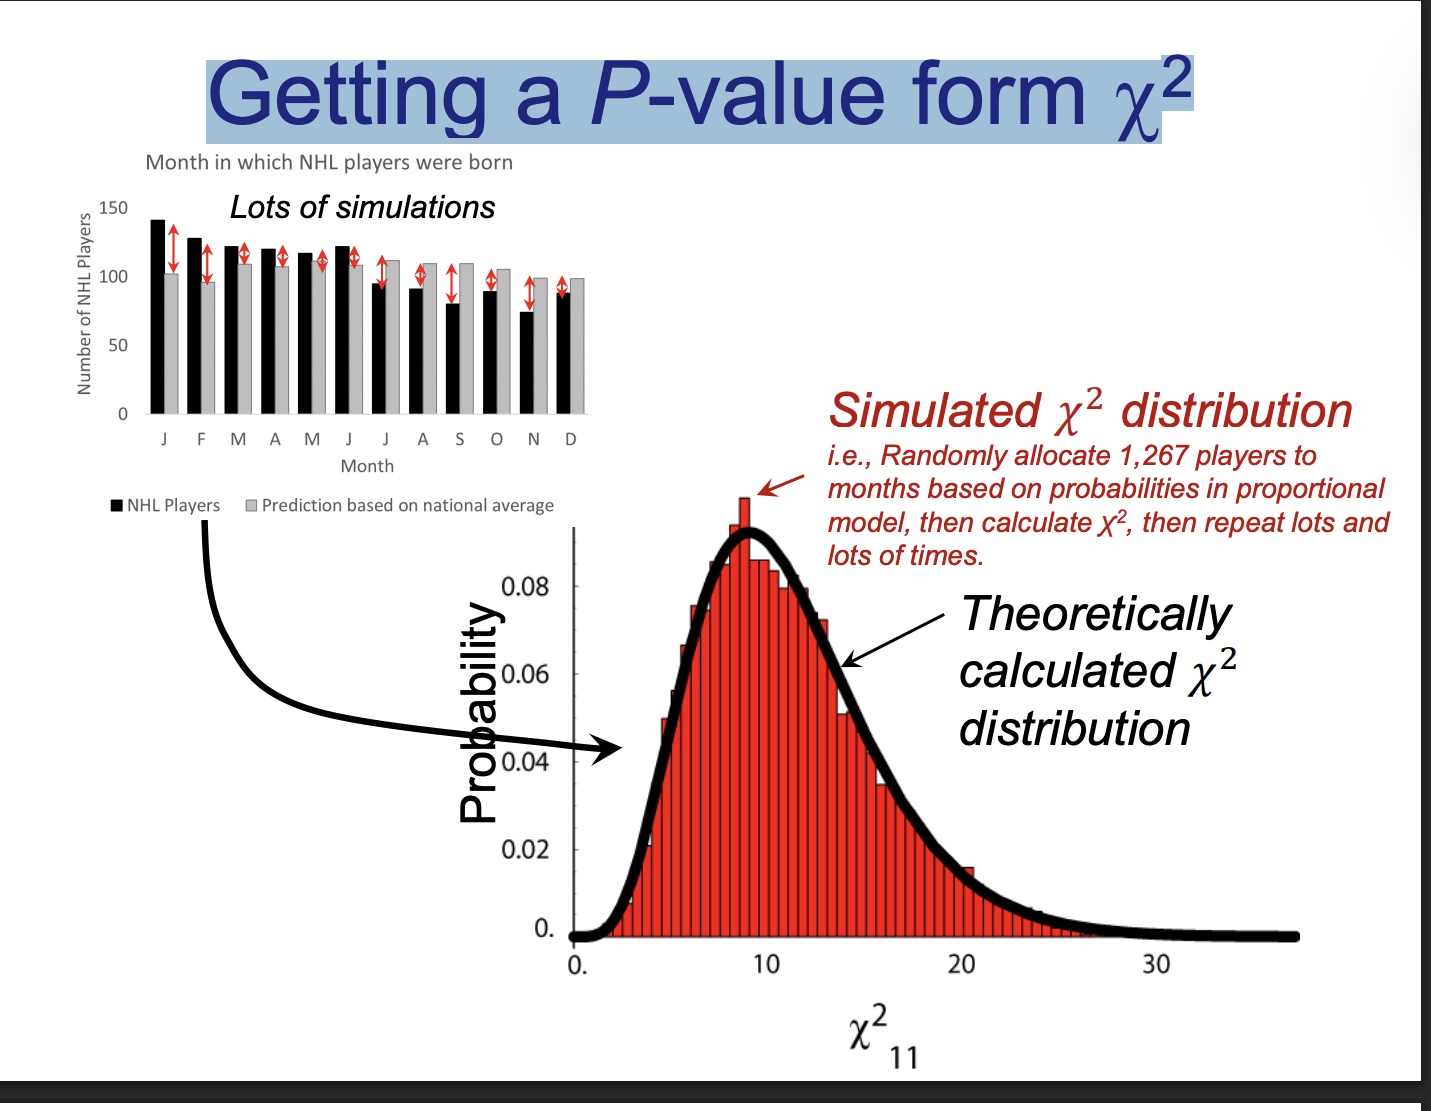
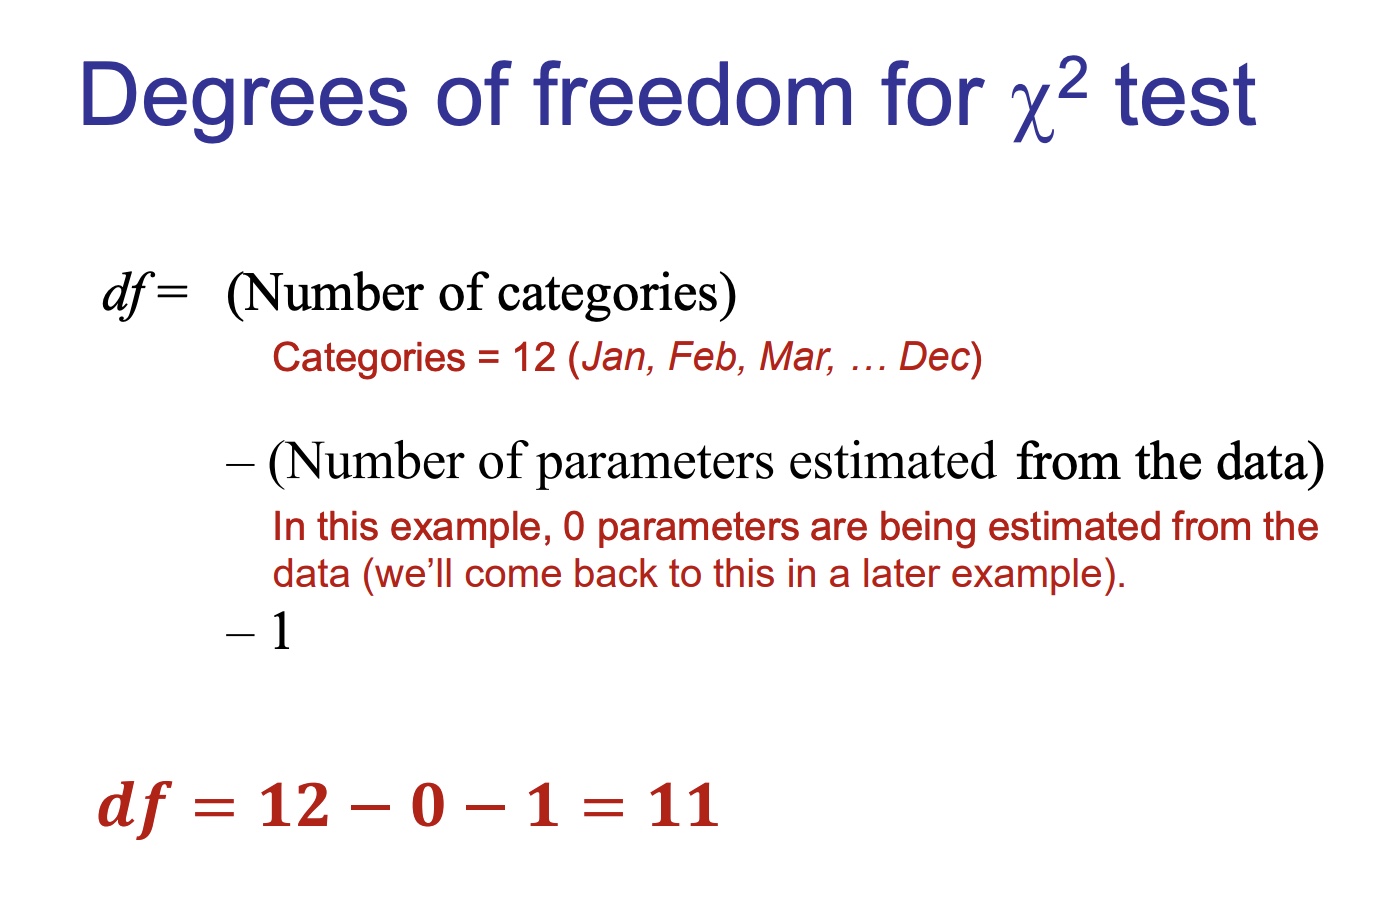
Degrees of freedom for x 2 test
df = (Number of categories) – (Number of parameters estimated from the data) – 1
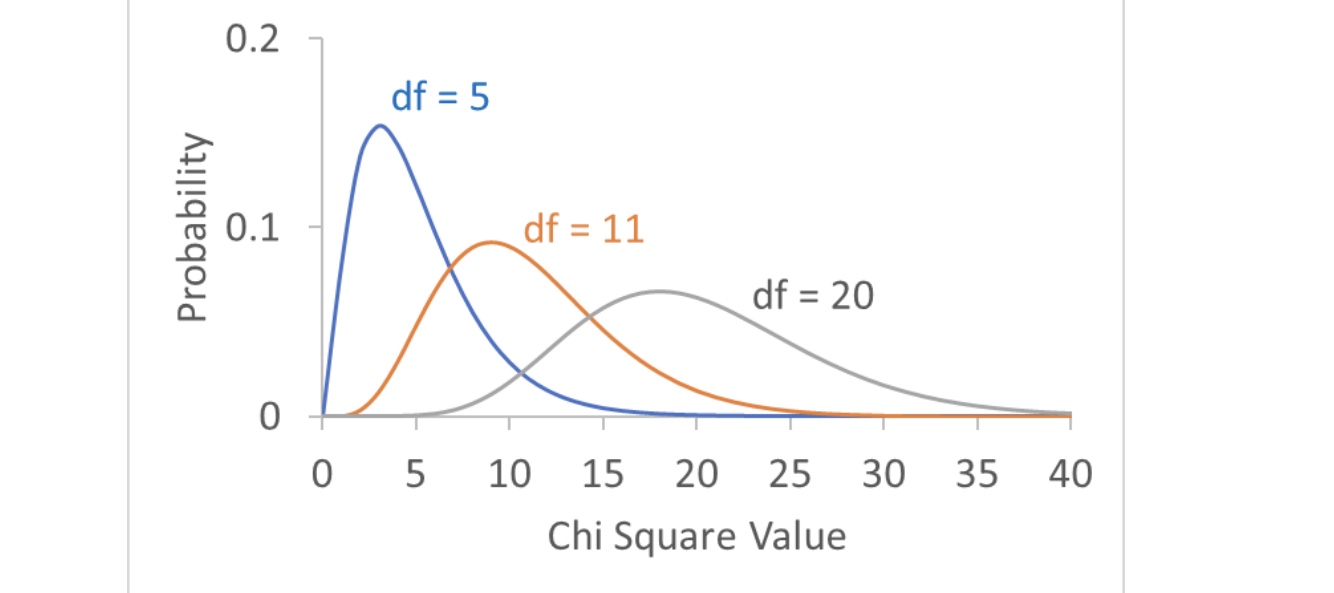
Degrees of Freedom
specieis which of a family distrubition to use
Critical value
The value of the test statistic where P = alpha
how to read a chi sq table
Assumptions of x^ 2 test
No more than 20% of categories have Expected < 5
• No category with Expected
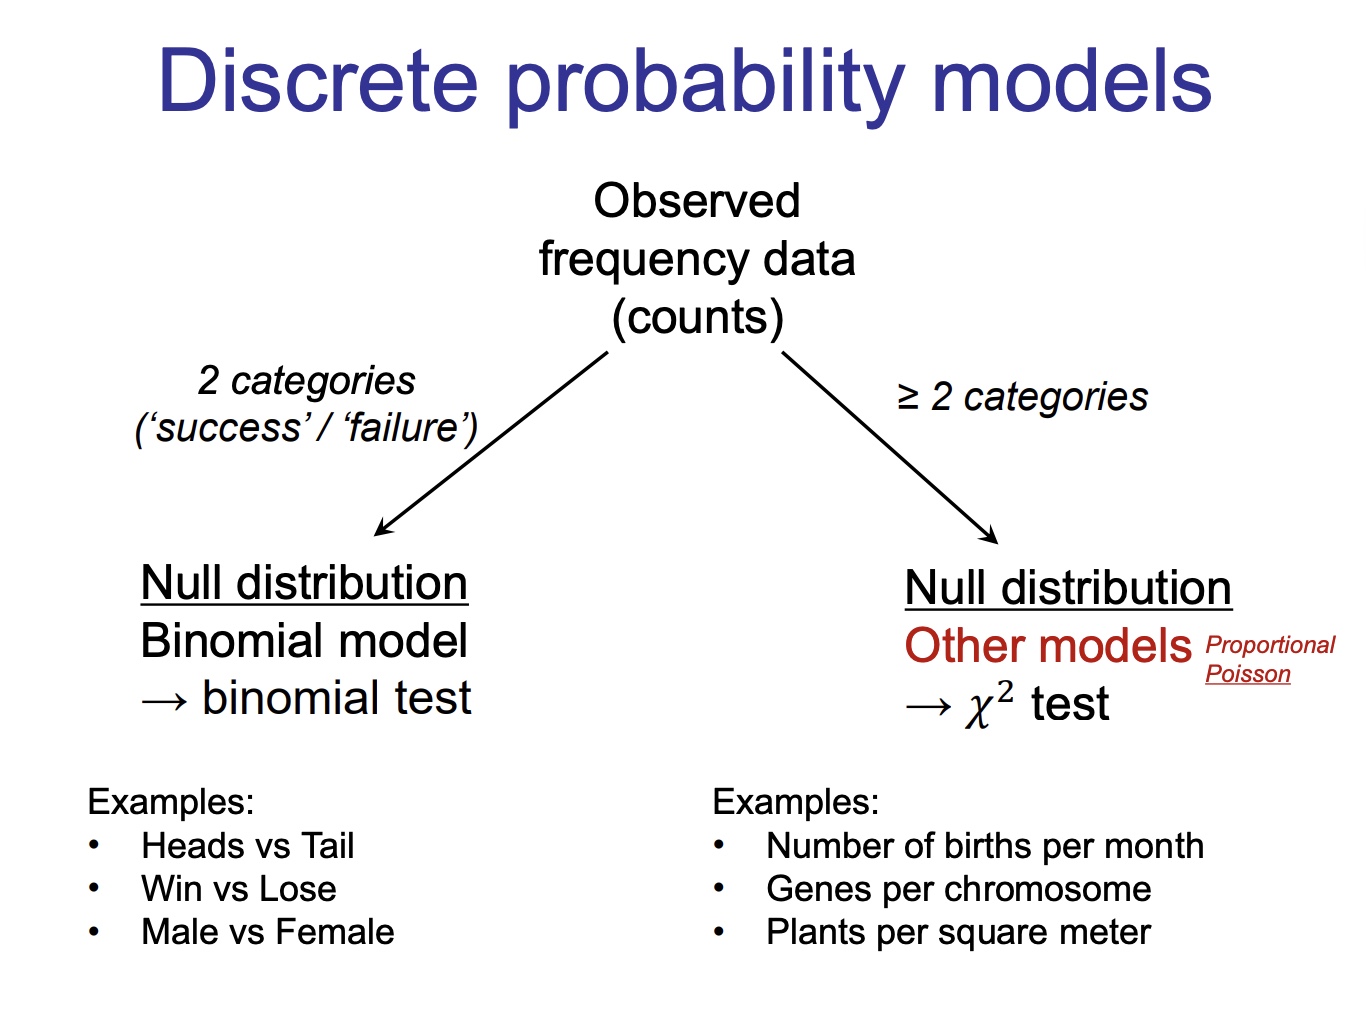
Discrete probability models
this is just telling you which test to do based on the categories
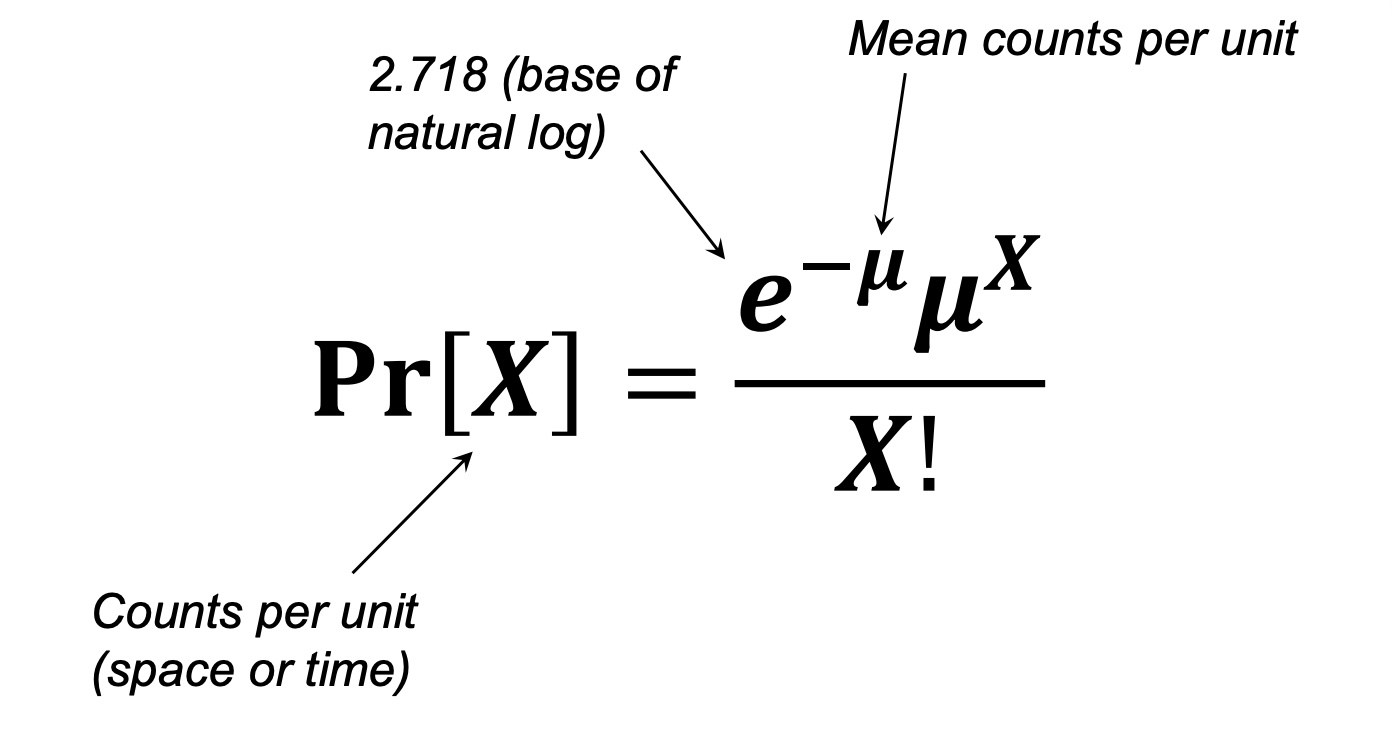
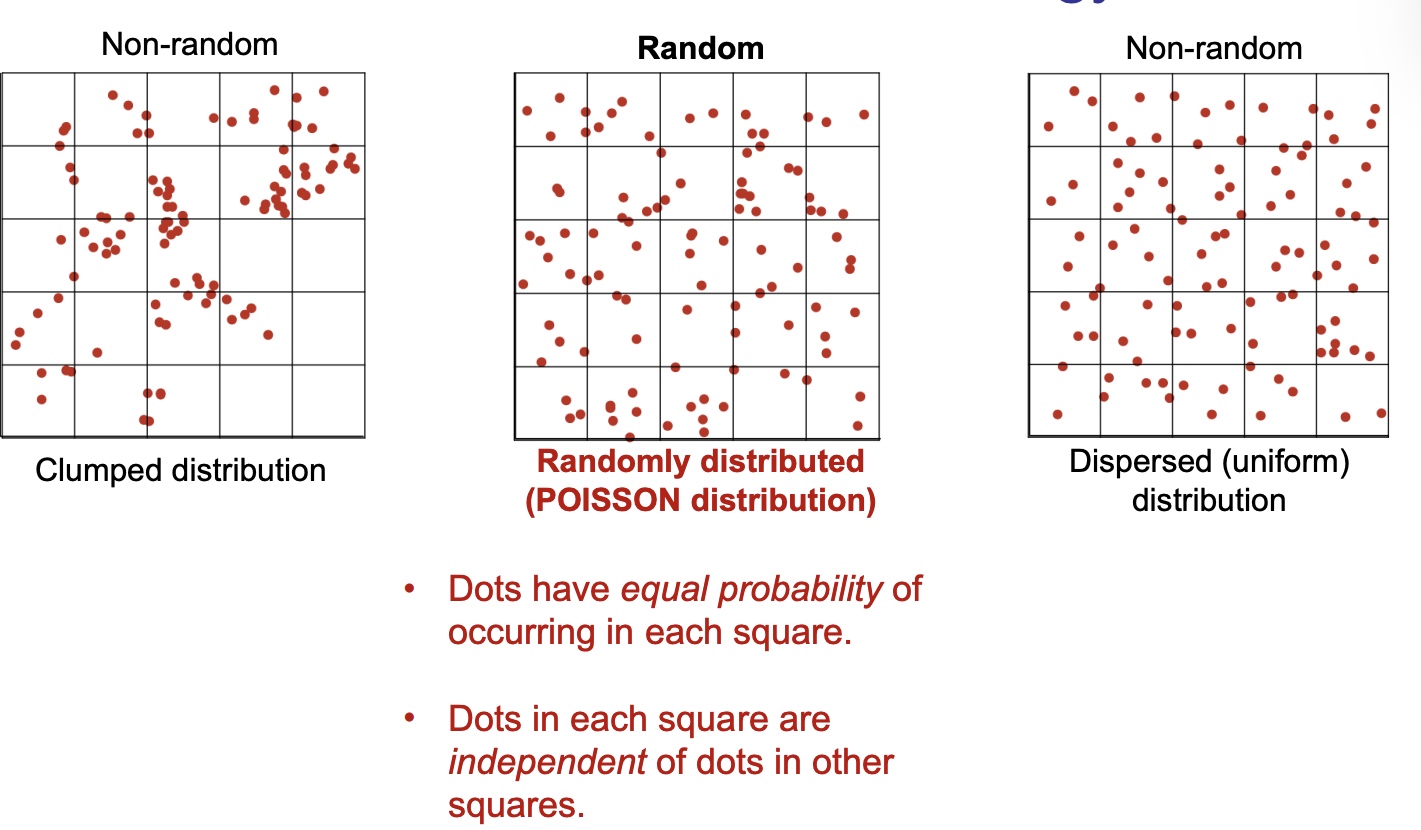
Fitting null models: The Poisson distribution
describes the probability certain number of events occur in a block of time or space, when those events happen indepdendtly of each other and occur with = probability at every point in time or space
Example of the Poisson distribution in biology
How can we calculate the Poisson distribution?