Ligand binding
1/11
There's no tags or description
Looks like no tags are added yet.
Name | Mastery | Learn | Test | Matching | Spaced | Call with Kai | Chat |
|---|
No analytics yet
Send a link to your students to track their progress
12 Terms
What are the different types of ligand binding?
Single binding site
Multiple identical independent binding sites
Multiple non-identical independent binding sites
Multiple dependent binding sites (cooperativity)
What are the methods for detecting ligand binding?
Structural & high-resolution methods:
X-ray Crystallography
NMR
Physical & Thermodynamic methods:
ITC
Radioactivity
X-ray crystallography
Gold standard for seeing physical map of the hydrogen bonds and VdW forces that hold the ligand.
Advantage: Atomic resolution (can reach <1Å), very accurate bond lengths/angles, widely applicable
Disadvantage: Requires crystal (hard to get for flexible proteins, membrane proteins, large complexes)
Nuclear magnetic resonance (NMR)
Uses 2D fingerprint where each dot is an amino acid. When a ligand binds, specific dots shift, telling us which residues are in the binding pocket. By adding more ligand and wathching the dots move, the Kd (ligand binding affinity) can be calculated.
Isothermal titration calorimetry (ITC)
Measures heat released or absorbed during binding. Directly measures ΔH, Kd, stoichiometry (n) and ΔG, ΔS from a single experiment.
No requirement of radioactive material
Requires high protein concentration
Radioactivity
Uses a radioactive ligand and measures radioactivity (coupled with Equilibrium dialysis)
Simple & sensitive
Involves hazardous substance
What are experimental setups for ligand binding?
Equilibrium dialysis:
Semi-permeable membrane separates chambers with protein and ligand; ligand is small enough to move freely
At equilibrium, free ligand concentration is equal on both sides
Free ligand = concentration in chamber without protein (unbound)
Bound ligand = total in protein chamber − free ligand
R = bound ligand / total protein concentration
Fluorescence spectroscopy:
Competitive labelling: fluorescent probe is already bound to the protein, and once ligand binds, it kicks out the probe and a fluorescent signal change is measured
Hyperbolic curve can be plotted (fluorescence vs [L])
Plot inverse of (double reciprocal) curve to linearise where:
Y-intercept: 1/n, where “n” is no. of binding sites
Slope = Kd (dissociation constant), which is the ligand concentration at half-saturation of protein (half-bound)
![<p><strong><u>Equilibrium dialysis:</u></strong></p><ul><li><p>Semi-permeable membrane separates chambers with protein and ligand; ligand is small enough to move freely</p></li><li><p>At equilibrium, free ligand concentration is equal on both sides</p></li><li><p><strong>Free ligand = </strong>concentration in chamber without protein (unbound)</p></li><li><p><strong>Bound ligand = </strong>total in protein chamber − free ligand</p></li><li><p><strong>R = </strong>bound ligand / total protein concentration</p></li></ul><p><strong><u>Fluorescence spectroscopy:</u></strong> </p><ul><li><p>Competitive labelling: fluorescent probe is already bound to the protein, and once ligand binds, it kicks out the probe and a fluorescent signal change is measured</p></li><li><p>Hyperbolic curve can be plotted (fluorescence vs <span>[L])</span></p></li><li><p><span>Plot inverse of (double reciprocal) curve to linearise where:</span></p><ul><li><p>Y-intercept: 1/n, where “n” is no. of binding sites</p></li><li><p>Slope = K<sub>d</sub> (dissociation constant), which is the ligand concentration at half-saturation of protein (half-bound)</p></li></ul></li></ul><p></p>](https://assets.knowt.com/user-attachments/43625e88-b71e-4b01-8615-47eb6b4b060d.png)
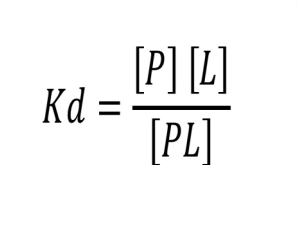
Important equation
[Ptotal] = total protein concentration, i.e., both bound and not bound
[PL] = Bound ligand (protein-ligand complex)
[P] = Free protein (not bound to ligand)
[L] = Free ligand (not bound to protein)
Kd = dissociation constant (measures the binding affinity)
Represents concentration of ligand at which exactly half of the binding sites are occupied
![<ul><li><p>[P<sub>total</sub>] = total protein concentration, i.e., both bound and not bound</p></li><li><p>[PL] = Bound ligand (protein-ligand complex)</p></li><li><p>[P] = Free protein (not bound to ligand)</p></li><li><p>[L] = Free ligand (not bound to protein)</p></li><li><p>Kd = dissociation constant (measures the binding affinity)</p><ul><li><p>Represents concentration of ligand at which exactly half of the binding sites are occupied</p></li></ul></li></ul><p></p>](https://assets.knowt.com/user-attachments/3ad15afa-3258-4546-91dd-ba9ccd0b4965.png)
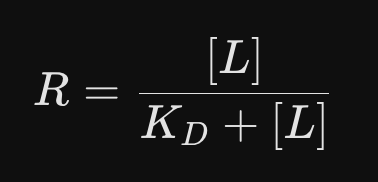
A protein has a Kd =0.1 mM. What ligand concentration is required for 90% saturation?
R = saturation fraction
90% Saturation → R = 0.9
Rearrange equation and solve
[L] = 0.9 mM
Ligand binding question with table
Some form of ligand amount will be given, so can calculate the right axes using:
Ltotal = Lbound + Lfree
Make a scatchard plot where:
X-axis: bound ligand, like Lbound or [PL]
Y-axis: bound ligand over free ligand, so Lbound/Lfree or [PL]/[L]
Use intercepts and slope of the linear regression to find parameters:
Y-intercept = Lbound(Max)/Kd
X-intercept = Lbound(Max)
Kd = -1/slope
Ka = 1/Kd
Plug values in this equation to find other parameter:
No. of binding sites (n) = Lbound(Max)/[Ptotal]
What do the shape of the curve tell us about the binding sites?
Linear Scatchard: Independent equal binding sites
Hyperbolic curve: independent multiple binding sites
Sigmoidal curve: cooperative multiple binding sites
What does a Hill plot tell us?
Cooperativity! Where the slope = Hill coefficient n.
n>1 → positive cooperativity
the binding of a ligand increases the affinity of the protein for subsequent ligands
Example: Haemoglobin
n<1 → negative
the binding of a ligand decreases the affinity of the protein for additional ligands
n=1 → independent
Affinity of the protein for a ligand remains exactly the same, regardless of how many ligands are already attached
Example: Myoglobin