AP HUG FINAL
1/170
There's no tags or description
Looks like no tags are added yet.
Name | Mastery | Learn | Test | Matching | Spaced | Call with Kai |
|---|
No analytics yet
Send a link to your students to track their progress
171 Terms
every map projection has what
Distortion
What can be distorted in maps
Shape, area, direction, distance
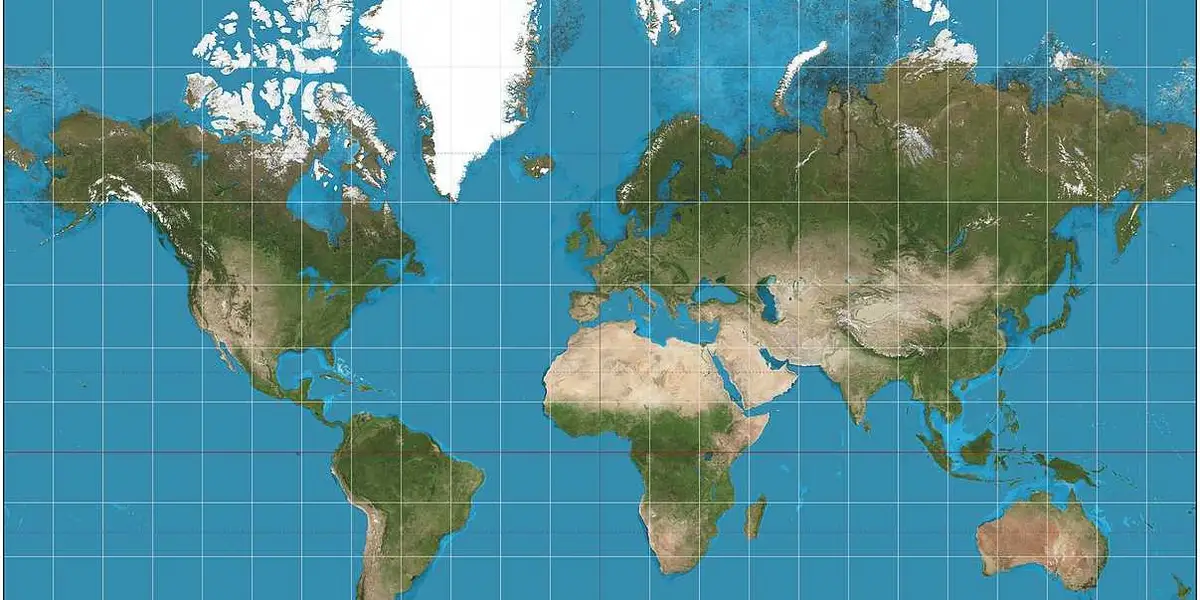
Mercator map projection
Shows accurate direction, used for naval exposition
But distorts in size and location land mass (ex. Green land is shown larger in Africa)
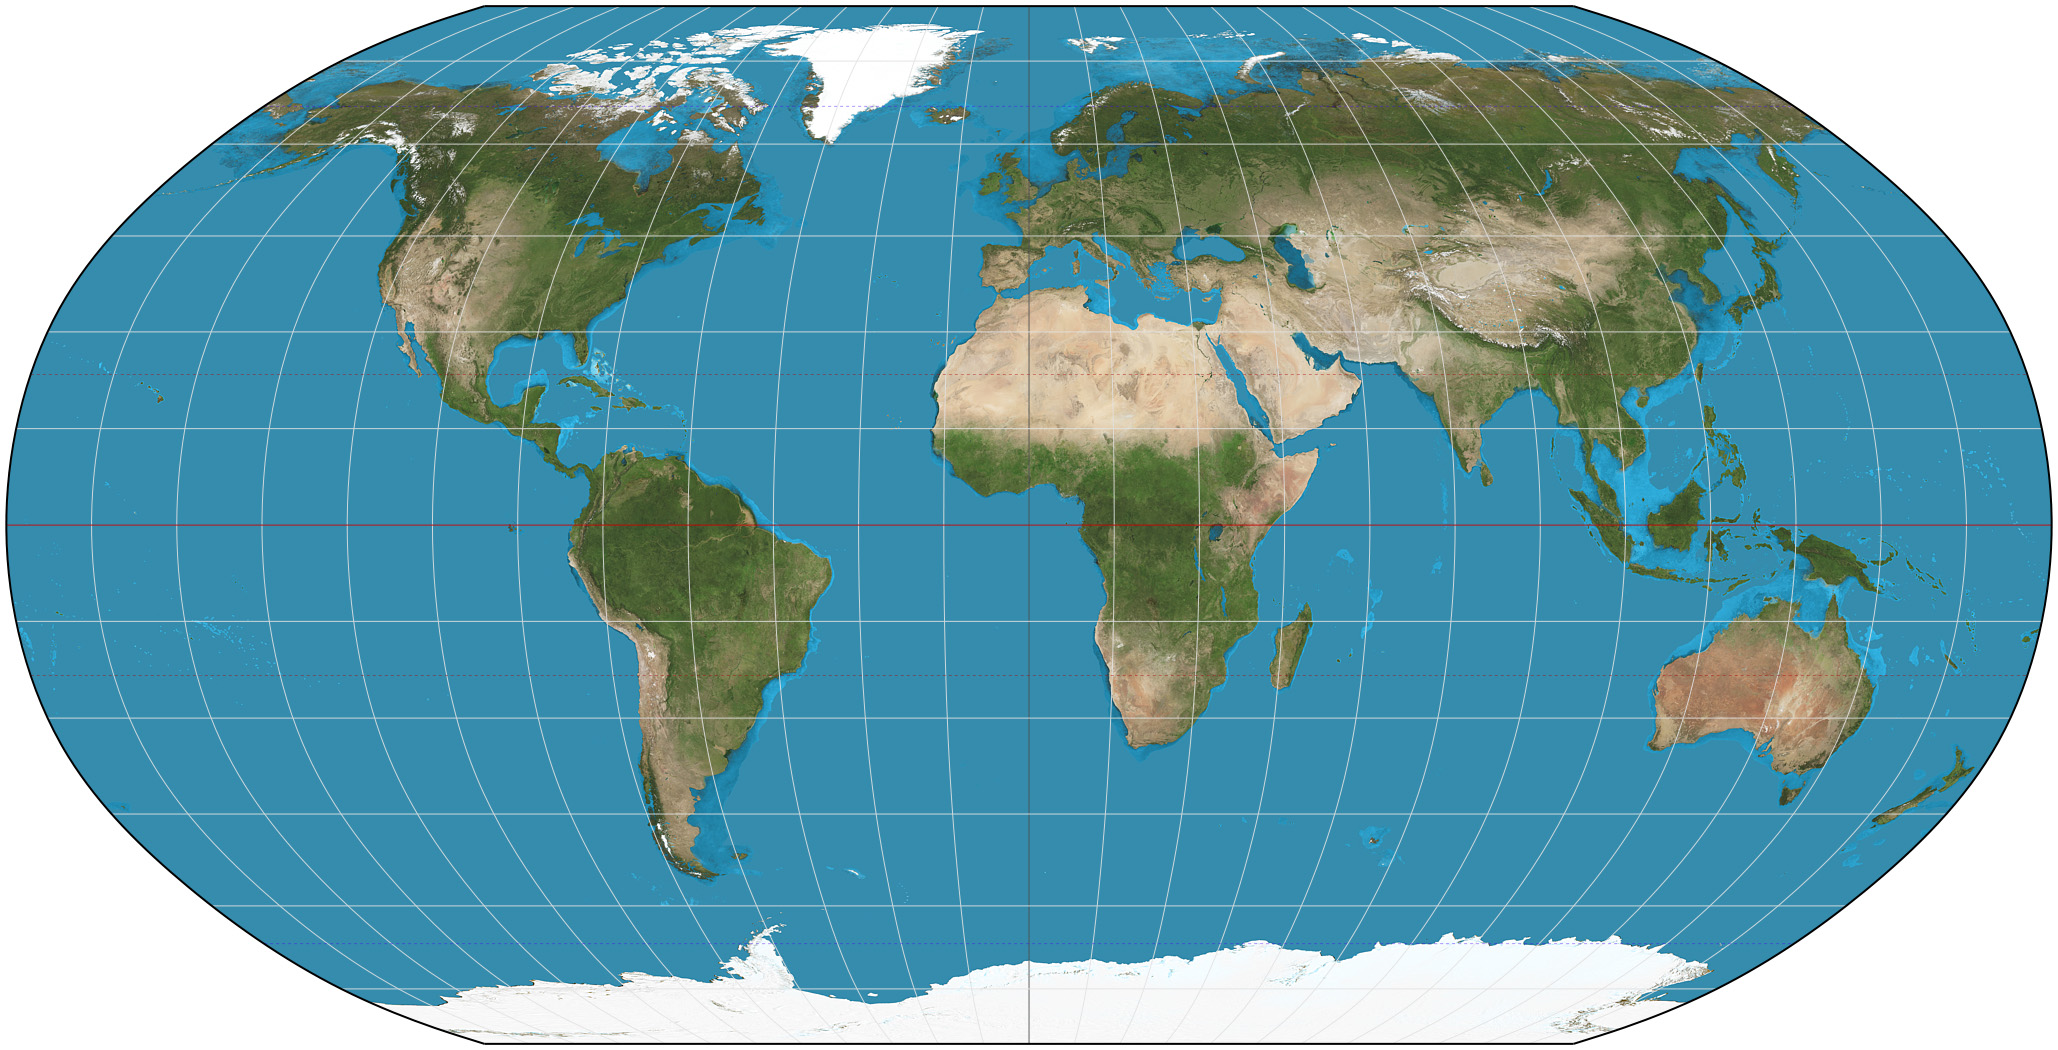
Goode homolosine projection
Shows true size and shape
But distorts in distances near the edges
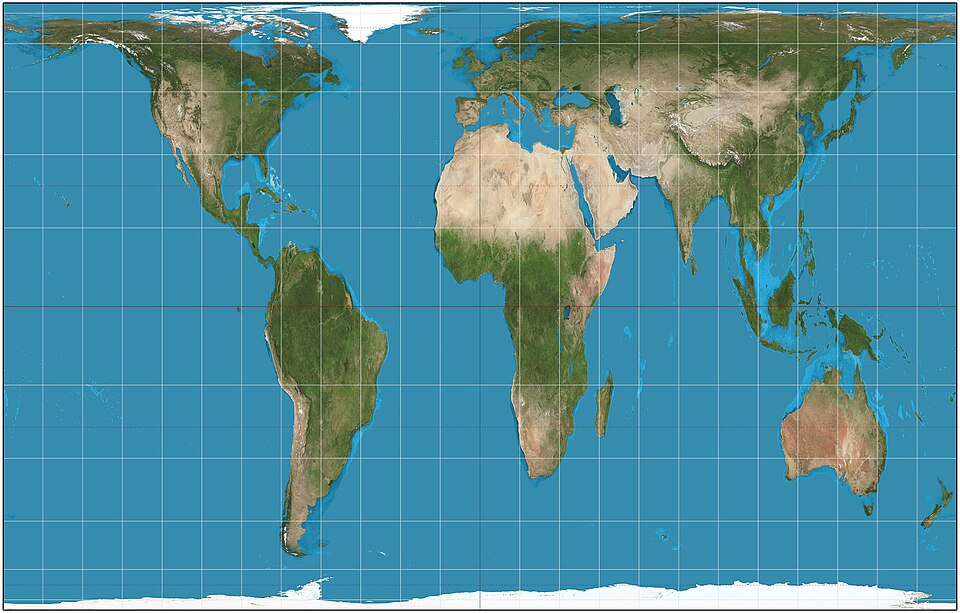
Robinson projection
Preserves size and shape,
Distorted near the poles
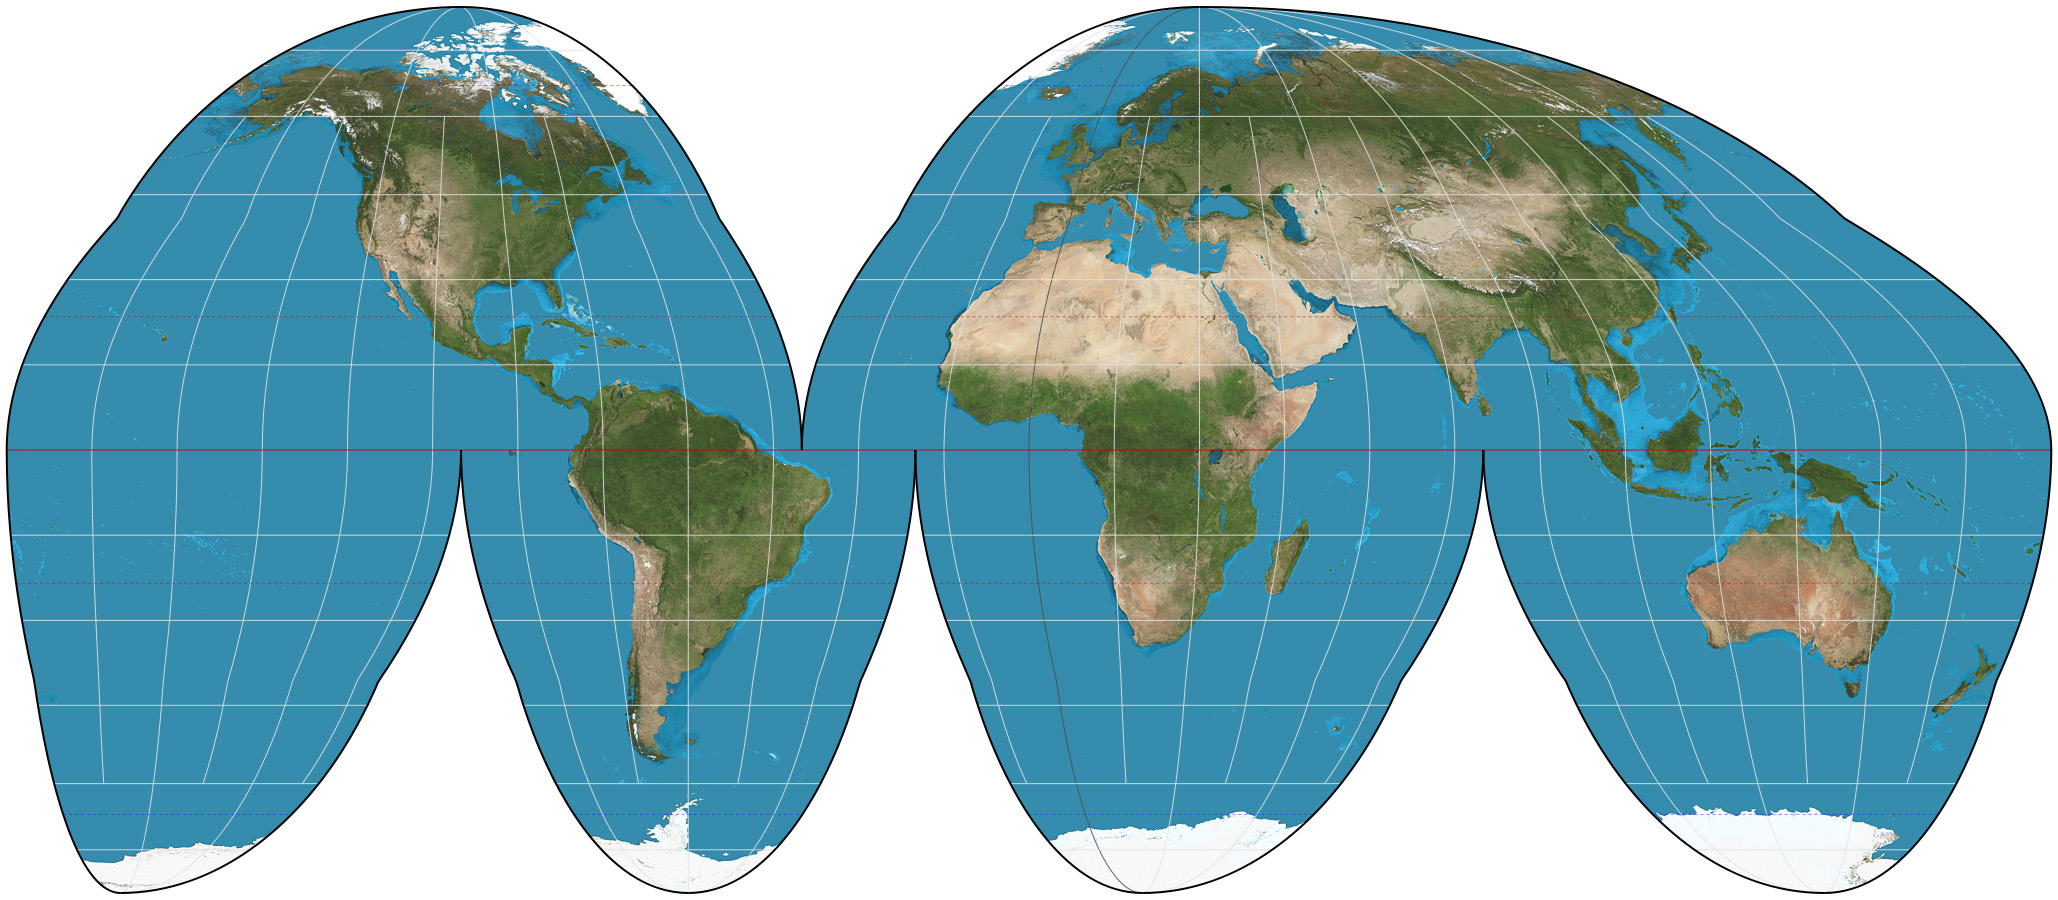
Gall Peter’s projection
More accurate in size
Distorts shape and direction
Reference maps
Informational maps that’s shows boundaries, names and geography features
Used for direction, Display property lines, political boundaries and transportation routes
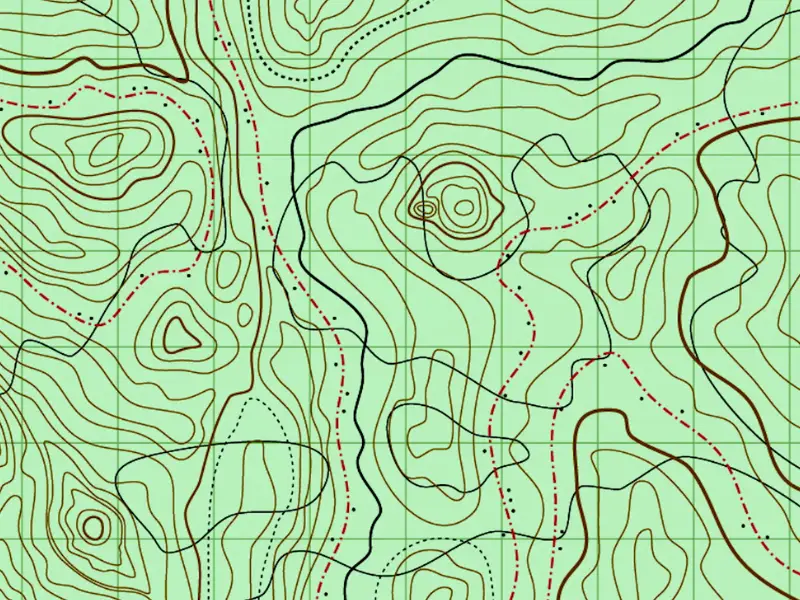
Topographical map
A kind of reference map, shows contour lines to display the terrain and elevation changes in a area
The closer the lines, the steeper the train is.
The more space there is the less Elevation is changing
Absolute direction
The exact direction a person is heading
Ex. If you were traveling south the compass would be at 180 degrees
Relative direction
Direction given in relation to another’s objects current location
Absolute distance
The exact distance between two places or objects
Measured in quantitative terms like miles or kilometers
Relative distance
The approximate measurement between two places
Ex. Driving to Orlando from nyc would take about 23 hrs
Thematic maps
A map that displays spatial pattern of places and uses quantitative data to display specific topics
Chloropleth maps
Display data by using different colors of shades to show different quantities
Dot density
Places point on a map where the data is occurring, shows the spatial distribution of data
Spatial analysis
The process of analyzing pattern and relationship within an area
Ex: distribution of natural resources or the movements of people and goods
Graduated symbol map
Uses symbols to show the location and the amount of data
Isoline maps
Uses lines to connect different areas that have similar data
Ex: weather map shows areas with similar temperatures
Cartogram map
Shows data by representing the greatest value as the largest area
Flow line maps
Shows movement of goods or ideas or people between different places
Remote sensing
A process of collecting information about the Earth surface from satellites orbiting the Earth
GIS
A computer system that can collect analyze and display geographic data
creates layered which gives geographers insight into the spatial associations and patterns of satellites
GPS
A network of satellites are used to determine the location of something on the earth surface
People use this to navigate between different places or find specific spots
Landscape/photo analysis
helps geographers better understand changes to an area and can show the impact humans may have had the environment done by studying images, captured by Geo spatial technology, looking at photographs or observing video recordings to see wildlife vegetation the geography and other physical elements
Qualitative data
This data is subjective they will differ, depending on who is collecting it and how it is being collected
type of data is often collected through observations
example of this gate that would be the approval rating of your schools lunch that the information will differ every time you conduct
Quantitative data
Objective, this information may be collected by a country census ,
Ex. The population pyramid to better understand how many people are in each age group
Local scale
not seeing much of the surface but I’m able to see lots of details of an area
Good for understanding exactly where data points are occurring
National scale
lose some of the detail however, I am now able to see different spatial relationships occurring within a countries borders
Small scale map
A map that shows a large proportion of the earth surface, but has less details in the data
Govs used this to see the needs and plan for the future on a global levels
Large scale map
Lots of details but see less of the surface
Ex. County map
super national organization
An alliance, which consists of multiple countries, traditionally, three or more, that were together to achieve common goals or specific issues that impacts the states. Example United Nations, NATO. EU
Absolute location
Is an exact location on the Earth surface it uses longitude and latitude
think about your phone and GPS the name of the location may change over time, but those coordinates will always remain the same
Relative location
Relation a place has to the surrounding area
for example if I was to describe my location using the different buildings around me or geographic features of the area
Sense of place
This is an emotional response that helps form a person’s perception of a place
Time space compression
The reduction of time it takes for something or someone to get from one place to another. This counters of distance decay.
Distance decay
The effect of distance on the cultural or spatial interactions, the larger the distance, the less interaction
This has decrease bc technology made it easier for people to connect regardless of the distance
Environmental determinism
The environment that’s the possibilities for humans society
dictates the success of a society certain environment
Environmental possiblism
Which is the idea that the environment put a limit on a society but people have the ability to adjust the physical environment and create their own success
Scale of analysis
how data is organized
Scale
How much of the earths surface is being viewed
Functional/nodal region
Geographic area organized around a center-point
Ex. Airport
Vernacular/perceptual region
Geographic area with perceived common characteristics, no perfect definition
Formal/ uniform regions
Geographic area of common characteristics
Arithmetic density
Population/amount of land
Physiological density
Population/arable land
Agricultural density
Farmers/arable land
CBR
Total number of live births in a year for every 1000 people alive
CDR
Total number of deaths in a year for every 1000 people alive
NIR
The percentage by which a population grows in a year
TFR
Average number of children a Woman would have
Dependency rate
The number working people in the country who support people in a country who cannot work
Sex ratio
Ratios of men to women
Doubling time
The amount it takes for population to Double size
Stage 1
High stationary
The demographic transition model is categorized by low growth.
CBR: high CDR: High NIR: stable
Sharp triangle shape
Stage 2
Early expanding
When we move into stage two is when the Industrial Revolution or the medical revolution occurs
CBR: high CDR: falls rapidly NIR: rapid increase
Triangle
Stage 3
Late expanding
CBR: falling CDR:falls more slowly NIR: increase slows down
Rectangles triangle
Stage 4
Low stationary
Women finally get more opportunities in society, economic, and social
CDR: low CDR: low NIR: falling then stable
Rounded monty mole
Stage 5
Declining
our death actually rise above our birth, and we start to see our population decline
Epidemiological model
Causes of death in each stage
Pro natalist
Policies that will motivate citizens to have more kids and increase the population growth
Antinatalism
Motivates people to have less kids
Malthusian
The population would continue to grow exponentially, and our food production would only grow arithmetically, and eventually we would hit a point where we exceed our caring capacity
NeoMalthusians
says We need to look at all of the world resources, and they believe that eventually will hit a time where our population will exceed the Earth carrying capacity and then again will hit that catastrophe
Transhumance migration
Seasonal movement of Livestock
Intraregional migration
A permanent move within one region of a Country
chain migration
A process in which legal immigrants sponsor a family member for an immigration
Step migration
migration that occurs in stages
Guest worker
A migrant is given temporarily legal status to work
Transnational migration
Migration that happens over international borders
Cultural relativism
when we view a culture through their perspective we do not hold the culture to our cultural standards
Ethnocentrism
Judge based on our own social norms and cultural standards
Cultural landscape
comprises the different land used patterns of society. It’s made up of agricultural practices, different religious and linguistic characteristics, different architectural styles, or other way culture has expressed itself in the physical features of the landscape or settlement.
Relocation diffusion
Hearth starts to shrink we’re not seeing new people take on the cultural trait instead we have movement from one place to another.
Expansion diffusion
The amount of people participating in a cultural trait is growing.
Hierarchal diffusion
Diffusion happpens through a system, top down
Contagious diffusion
that spreads it all directions allowing for everyone to have access to the cultural trait without any barriers
Stimulus diffusion
which is when a cultural trait diffuse and adapt to the different cultural traits of the area that it’s diffusing to
Acculturation
People retain the original culture are also adopting aspects of a new culture
Assimilation
People lose their original culture traits when they join a culture
Syncretism
two cultures was coming in contact with each other and the result is a new culture
Multiculturalism
when various ethnic and cultural groups coexist in a society
Universalizing religions
Christianity, Islam, Buddhism, Sikhism
Ethnic religions
Judaism, Hinduism
Nation
made up of a group of people of a shared history, a shared cultural identity, and a history of self determination
State
an entity that has a permanent population, sovereign government and is recognized by other states
Nation state
Made up of one nation, is a homogenous state
is the opposite of a multinational state
Multinational state
State made up of multiple nations and agreed to live in peace
Multistate nation
Nation that exists in multiple states
The Korean nation in North Korea and also South Korea
Stateless nation
Nation with no state
Ex, the Kurds
Autonomous regions
areas within a country that have been granted a degree of self-governance. They have some control over their own laws and policies, but they're still under the authority of the central government.
Self determination
Their right to be able to govern themselves without any influence from external powers or other states
Shatter belt regions
regions that are caught between two external fighting powers
Neocolonialism
The form of controlling a country without actually controlling their economic or political influence
to influence a country and control them without directly occupied or sending troops in
Relic boundaries
Boundaries that no longer exists, still impact cultural landscape
Ex. Berlin Wall
Antecedent boundaries
Boundaries that existed before human settle ment
Subsequent boundaries
Boundaries based on ethnic groups and cultures
Consequent boundaries
Boundaries that are she’s to divide different cultural groups
Superimposed boundaries
boundaries created by a foreign state
Ex. is the majority of the African countries. If we look at the scramble for Africa, we can see that Europeans created most of those boundaries
Geometric boundaries
Boundaries that are straight lines and goes with the paralllels of latitude
Law of the sea
The Law of the Sea is a body of international law that governs the rights and duties of states regarding the use of the world's oceans.
Maritime zones are areas of the ocean over which a coastal state has varying degrees of authority. These zones extend from the coastline and include the territorial sea(12), contiguous zone(24), exclusive economic zone (EEZ 200), and the continental shelf. Each zone grants different rights and responsibilities to the coastal state.