Psychology 202 Chapter 2 Exam 1
 Call Kai
 Learn
Learn Practice Test
 Spaced Repetition
 Match
Match Flashcards
 Knowt Play
1/25

There's no tags or description
Looks like no tags are added yet.
Name | Mastery | Learn | Test | Matching | Spaced | Call with Kai | Chat |
|---|
No analytics yet
Send a link to your students to track their progress
26 Terms
Frequency Table
a tool used in statistics to organize and show how often each value or category occurs in a data set. It is the specific chart or grid used to display data
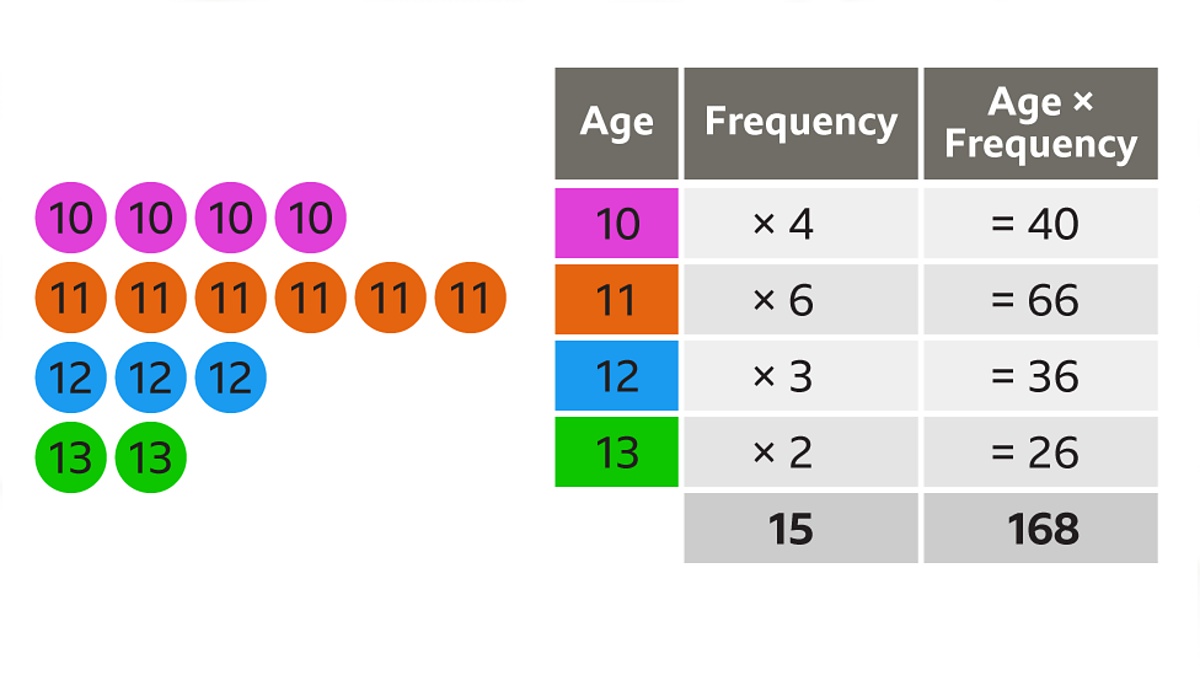
Frequency distribution
a tool that organizes raw data into a table or graph to show how often each value or group of values occurs

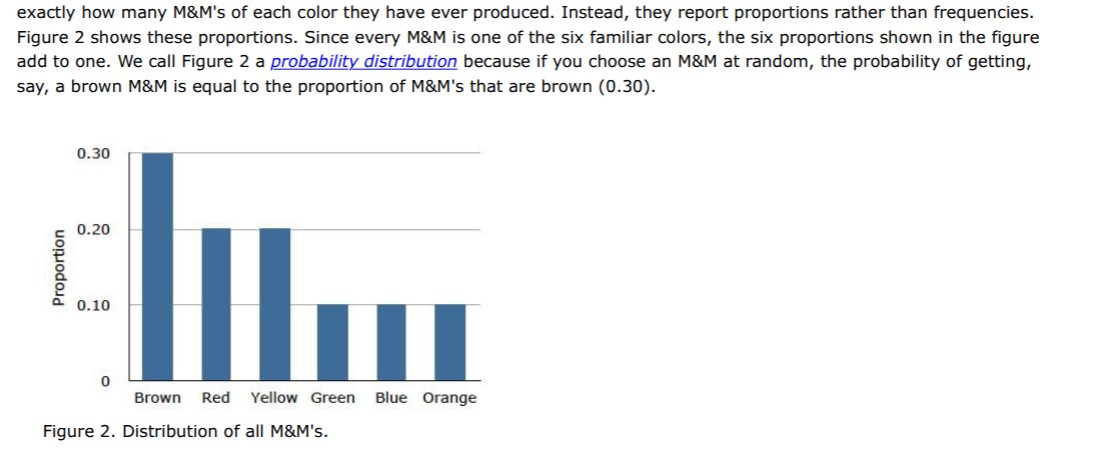
Probability Distribution
a list or a map that shows all the possible outcomes of an event and how likely each outcome is to happen
Discrete Variable
a variable that can take on a finite number of values, often counted in whole numbers, such as the number of children in a family.
a piece of data that can only take specific, separate values and cannot be divided into decimals or fraction
Can be nominal or ordinal
Continuous Variables
a number that can take any value within a range, including decimals and fractions
Infinite numbers of possible values
Can be interval or ratio
Grouped frequency distribution
a way to organize a large list of numbers into small, easy-to-read intervals or groups, showing how often values fall into each group
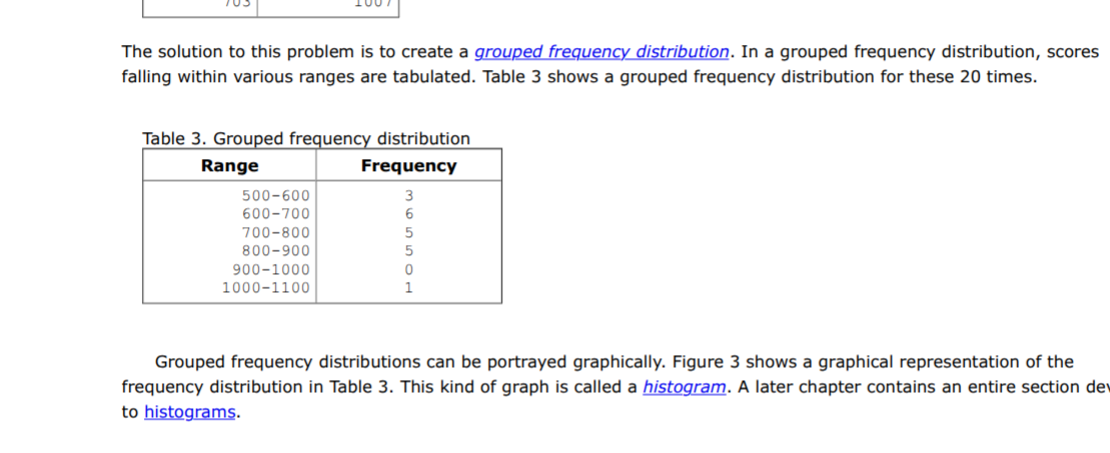
Historgram
a type of graph that uses connected vertical bars to show how often numerical data values fall within specific ranges

Probability density
a list or a graph that shows all the possible outcomes of an event and how likely each outcome is to happen
Normal distribution
a data pattern shaped like a symmetric bell curve, where most values cluster around a central average and taper off equally on both sides

Positive skewed
a distribution where most values are concentrated on the left side, with a long tail extending to the right.
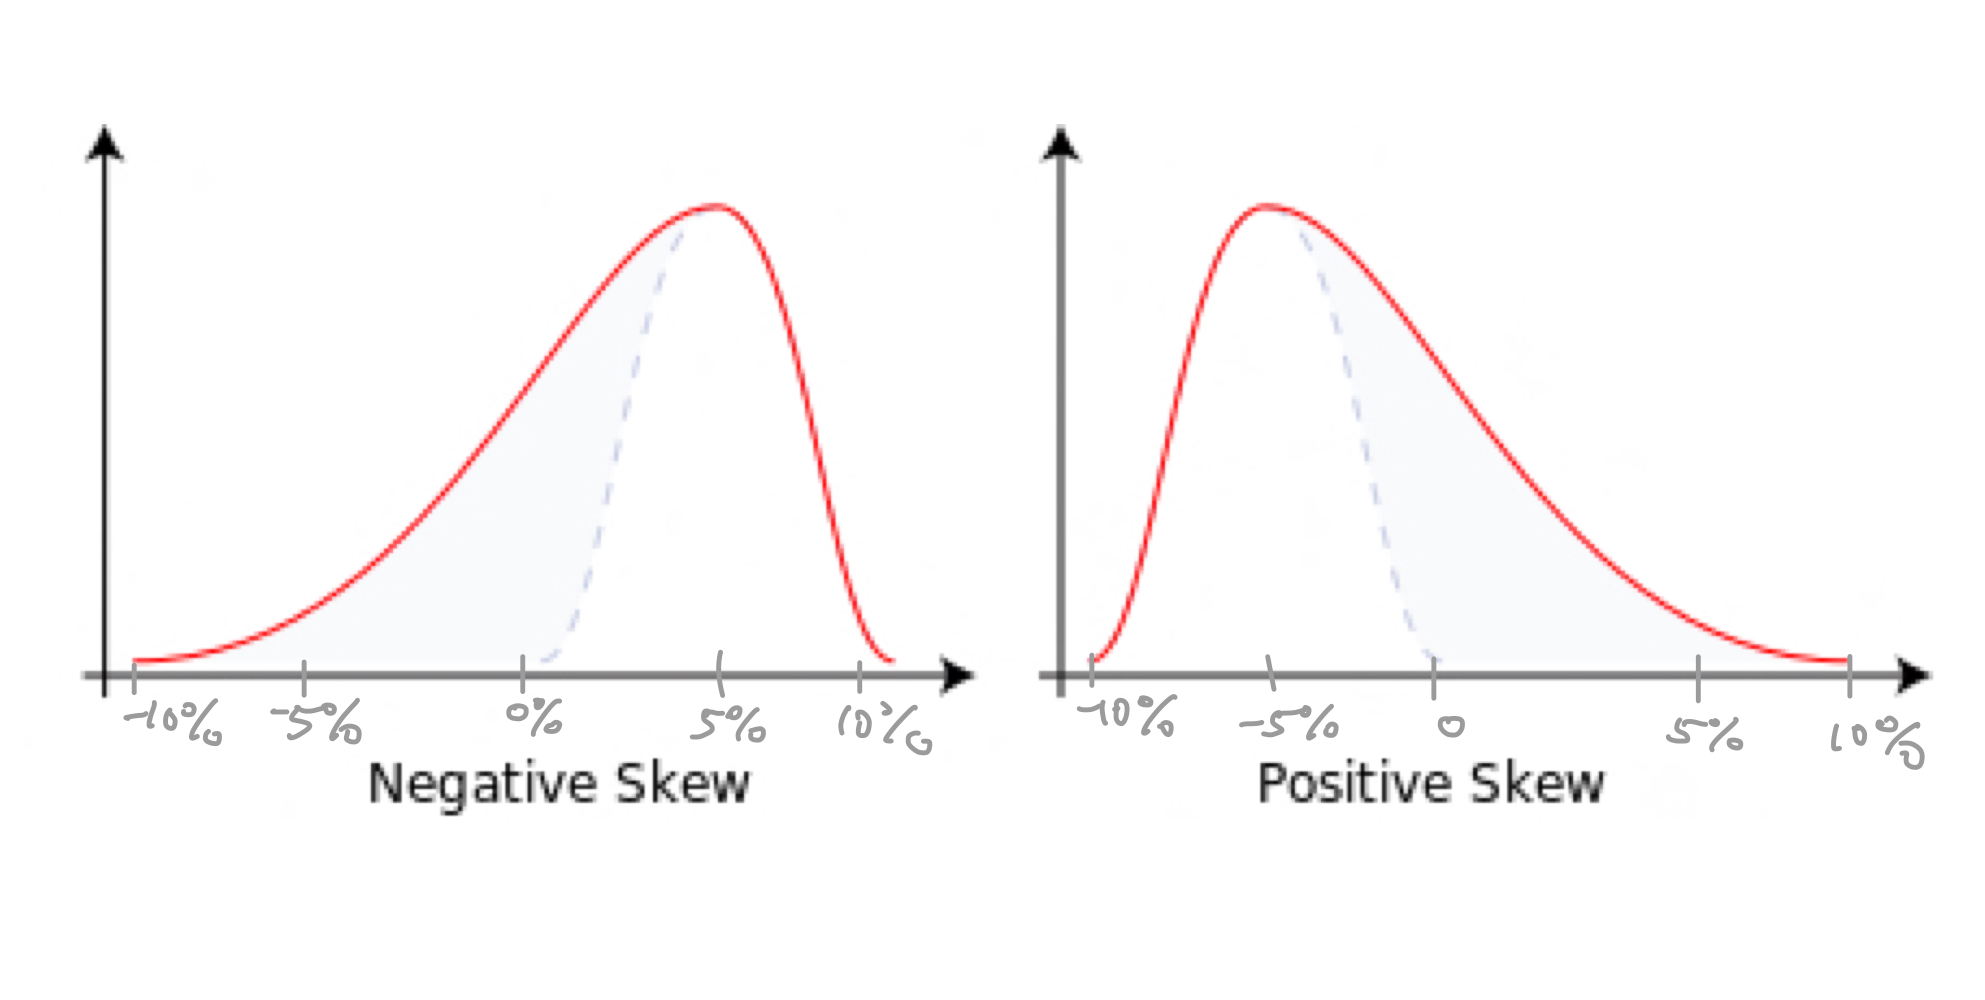
Negative Skew
a distribution where most values are concentrated on the right side, with a long tail extending to the left.

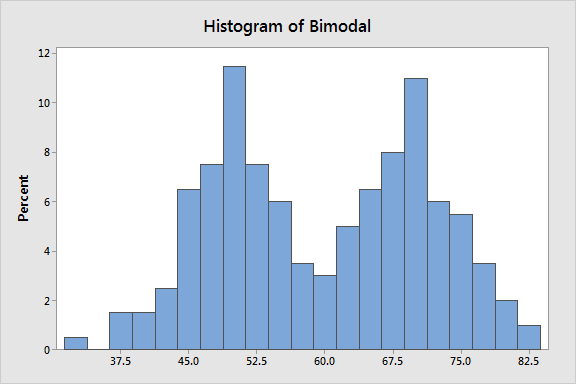
Bimodal distribution
a probability distribution or data set with two distinct peaks (modes) where data values cluster most frequently
Leptokurtic
is a distribution that has a higher peak than a normal distribution, indicating a greater concentration of values near the mean and heavier tails.

Platykurtic
is a distribution that has a lower peak than a normal distribution, indicating a flatter shape with lighter tails and a broader spread of values.

Statistics
a set of mathematical procedures for organizing, summarizing, & interpreting info
Explores why one group is the same or different than another
Variable
Any characteristic or condition that can take on different values
Letter grades such as A, B, C, and D have different percentages or scores within a specific range and can change based on student performance.
Data
Measurements or observations obtained in a research study

Population
The complete set of all individuals of interest in a study

Sample
A subset of the population

Calculate Mean Formula
ΣX/N
ΣX: Sum of all values in the dataset
N: The total number of values in the dataset
Mean: Remove below or add above (increase)
Remove above or add below (decrease)
Same as mean = no change
Calculate the Median
Write them in ascending order
Cross of min and max
Repeat until 1 or 2 numbers are left
If 1 that is median if 2 take an average and that’s is median
removing any number changes median
1, 2, 4, 6, 8, 10 = removing ANY number changes median
1, 2, 4, 4, 6, 6 removing 6 or 4 = no change
How to calculate Mode
Most frequently occurring score
Not affected unless score(s) removed as mode
That is only true when a few scores create mode
Outliers
Some measures are highly impacted
Mean, range, and standard deviation (ss and Variance)
Other measures are less sensitive
Median Mode, IQR (inter-quartile range)
How to calculate Variability
SS (Sum of squared deviations): Σ(X-M)²
Inside () is the deviation
Variance: SS/n-1(N)
Mean squared deviation
Standard deviation: sqrt/variance
Mean devation
Range: Max minus Min
IQR: 75% - 25%
How is Variability influenced by adding or removing a score
IQR (inter-quartile range)
Change depends on whether score is above or below median
Added above or removed below = shift up
Remove above or add below = shift down
Standard deviation (variance & SS)
Add above or removed below = Increase
Add below or remove above = decrease
Range: Not Affected unless…
Add: Affected if number is above Max or below Min
Remove: Affected if number is Max or Min