EC 201 Exam 1 Key Concepts and Principles - Ackermann Spring 2025 Online
1/101
There's no tags or description
Looks like no tags are added yet.
Name | Mastery | Learn | Test | Matching | Spaced |
|---|
No study sessions yet.
102 Terms
Economics (CH1)
The study of how people use their limited resources, "business of life"
4 core principles of decision-making (CH1)
Cost-benefit, opportunity cost, marginal, interdependence
Cost-benefit principle (CH1)
Evaluate the full set of costs and benefits for any choice, if benefits are equal to or greater than the costs
Willingness to pay (CH1)
Amount YOU would pay for something
Microeconomics (CH1)
Individual households and markets
Macroeconomics (CH1)
Entire economy of society
Opportunity cost principle (CH1)
Cost of one decision is what you would've had or given up to make your decision, "or what?"
Opportunity cost equation (CH1)
Original (best) decision - second best decision
Sunk costs (CH1)
Past costs that can't be reversed
Marginal principle (CH1)
Break "how many" decisions into smaller ones, "one more"
Cost-benefit principle + marginal principle (CH1)
Marginal benefit = benefit of one more; Marginal costs = cost of one more
Rational rule (marginal principle) (CH1)
Proceed to add one more if marginal benefit is equal to or greater than marginal costs
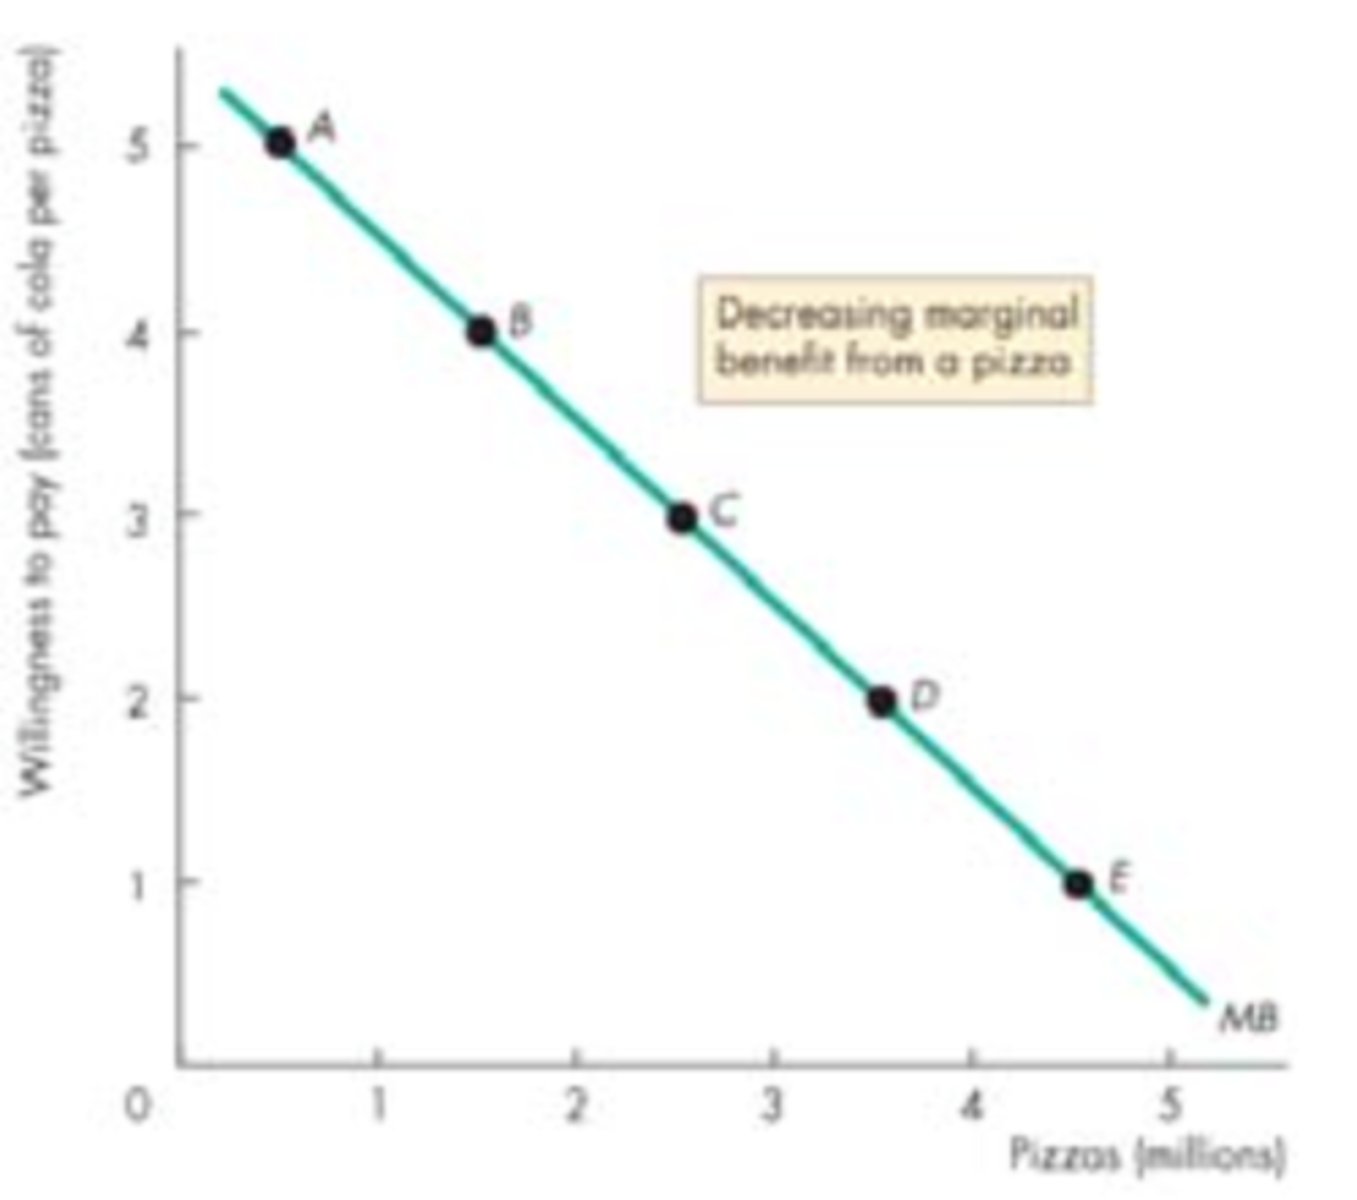
Marginal benefit equation (CH1)
Change of benefit / change in quantity
Decreasing/diminishing marginal benefit (CH1)
Ex: the more bites of food you take, the less enjoyable it gets
Marginal cost equation (CH1)
Change in cost / change in quantity
Increasing marginal costs (CH1)
Costs more as decisions/quantity increases
Optimization (CH1)
Graphed marginals to find the PERFECT option
Why models? (CH1)
Simplify something complicated
Interdependence principle (CH1)
How decisions interact with other decisions and factors
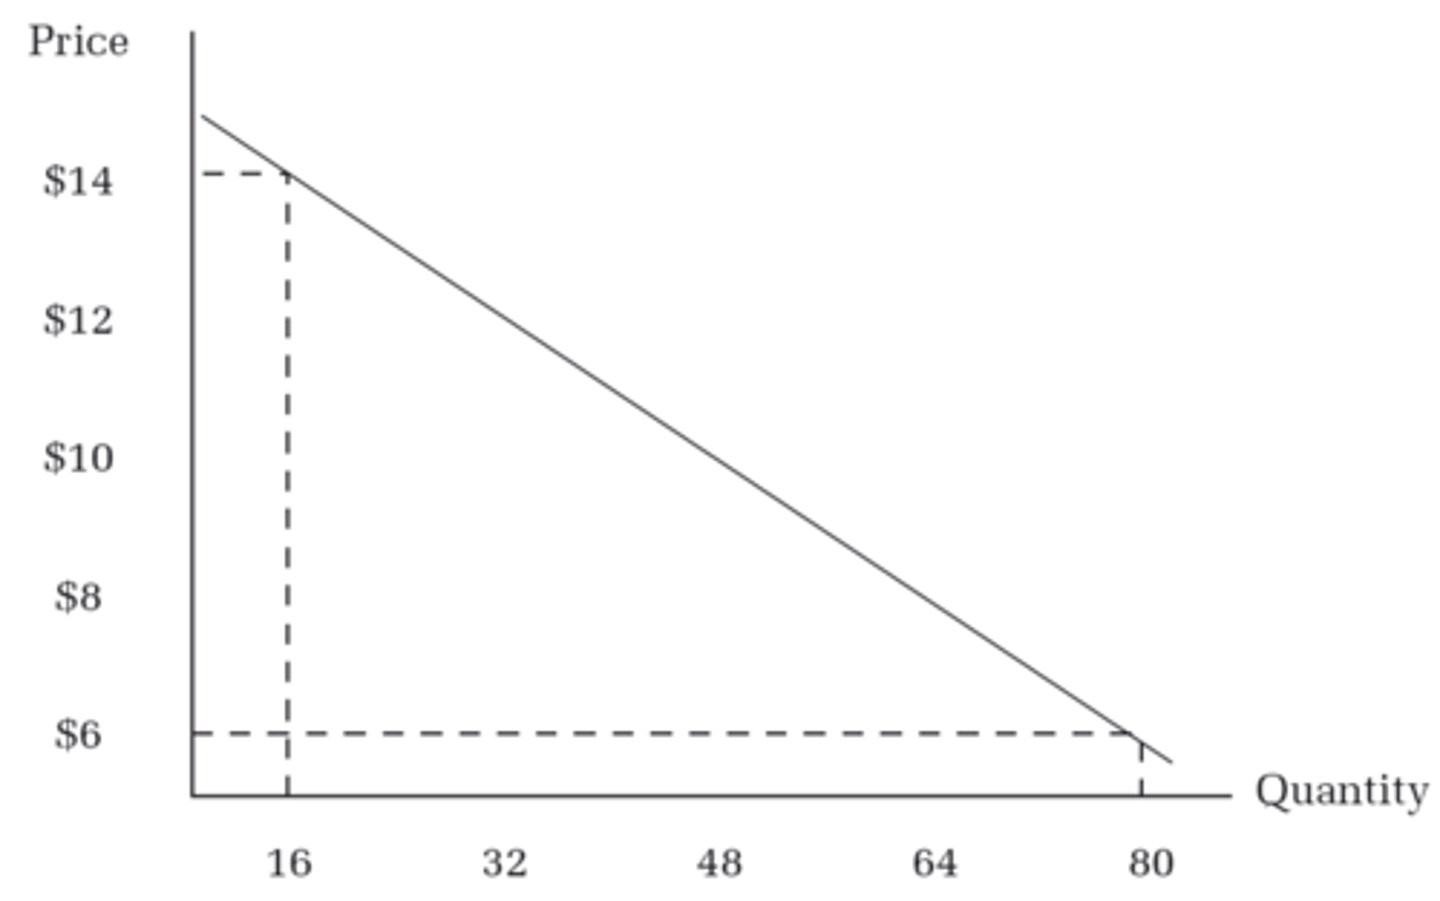
Demand (CH2)
Relationship price of a good and quantity of a good
Law of demand (CH2)
As quantity demanded rises, price lowers.
Demand curve direction (CH2)
Demand slopes Downward.
Market demand (CH2)
Demand of ALL consumers in the market.
Scaling factor (CH2)
Size of market at price / size of survey.
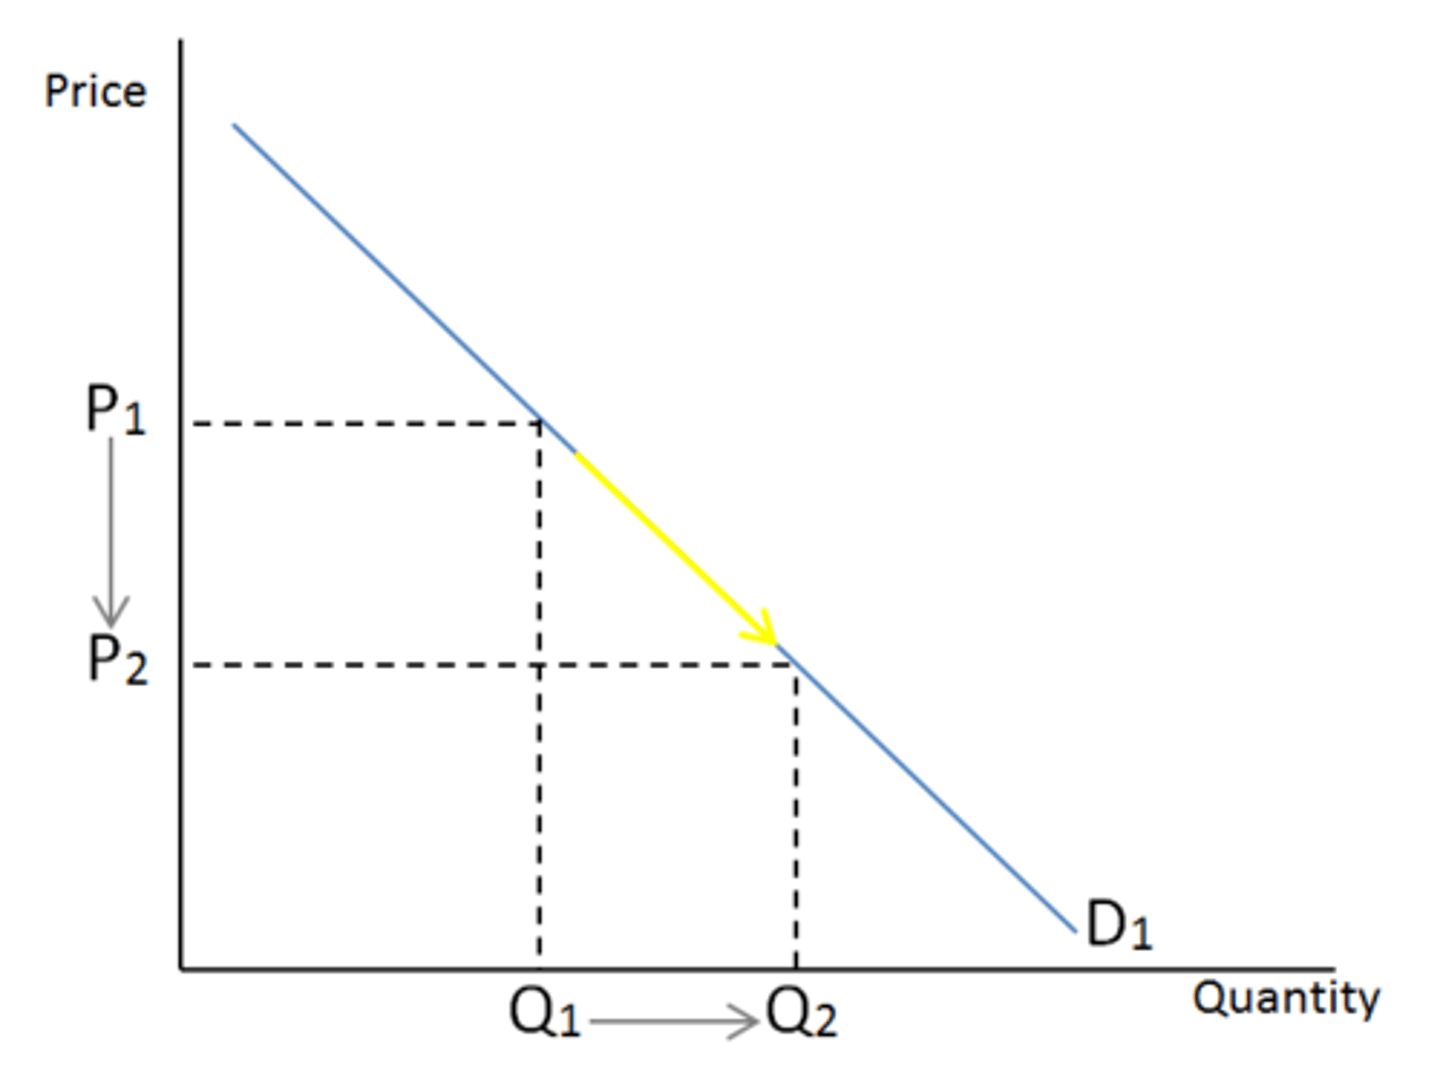
Movement along demand curve cause (CH2)
When price changes, quantity demanded changes (change in quantity demanded).
Change in demand curve movement cause (CH2)
Moves if anything other than price changes (change in demand).
Graph movement for change in quantity demanded (CH2)
Increase = point moves down and right; Decrease = point moves up and left.
Graph movement for change in demand (CH2)
Increase = out; Decrease = in.

Normal good (CH2)
Positive relationship between income and demand for good; income increases so demand increases (Luxury, bougie goods).

Inferior good (CH2)
Negative relationship between income and demand for good; income increases so demand decreases (Less bougie goods).

Taste and preferences (CH2)
Personal opinion and liking.
Substitutes (CH2)
Replacements of a good; increase in demand of one good decreases the other's demand.
Complements (CH2)
Pairings of a good; increase in demand of one good increases the other's demand.
Expectations (CH2)
Anticipating price changes, ex: black friday.
Network effect (CH2)
When everyone has it so you want it.
Congestion effect (CH2)
When too many people have it so you don't want it.
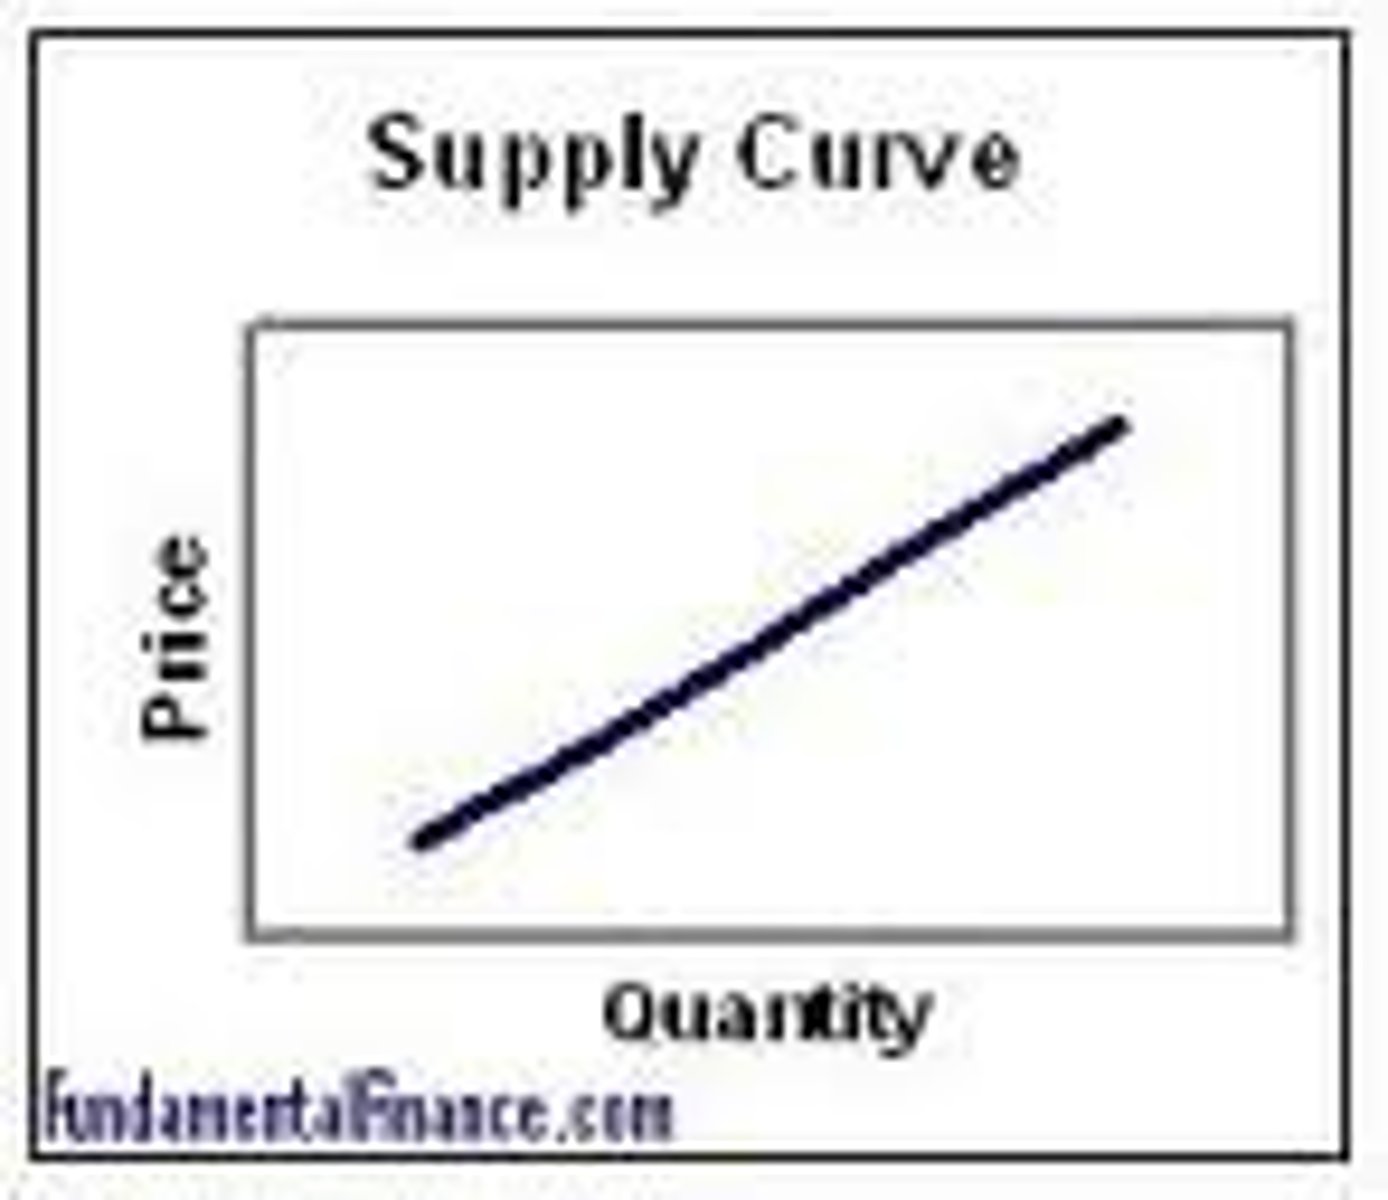
Law of supply (CH3)
As the price of a good increases, quantity supplied will increase.
Supply curve direction (CH3)
Supply slopes up.
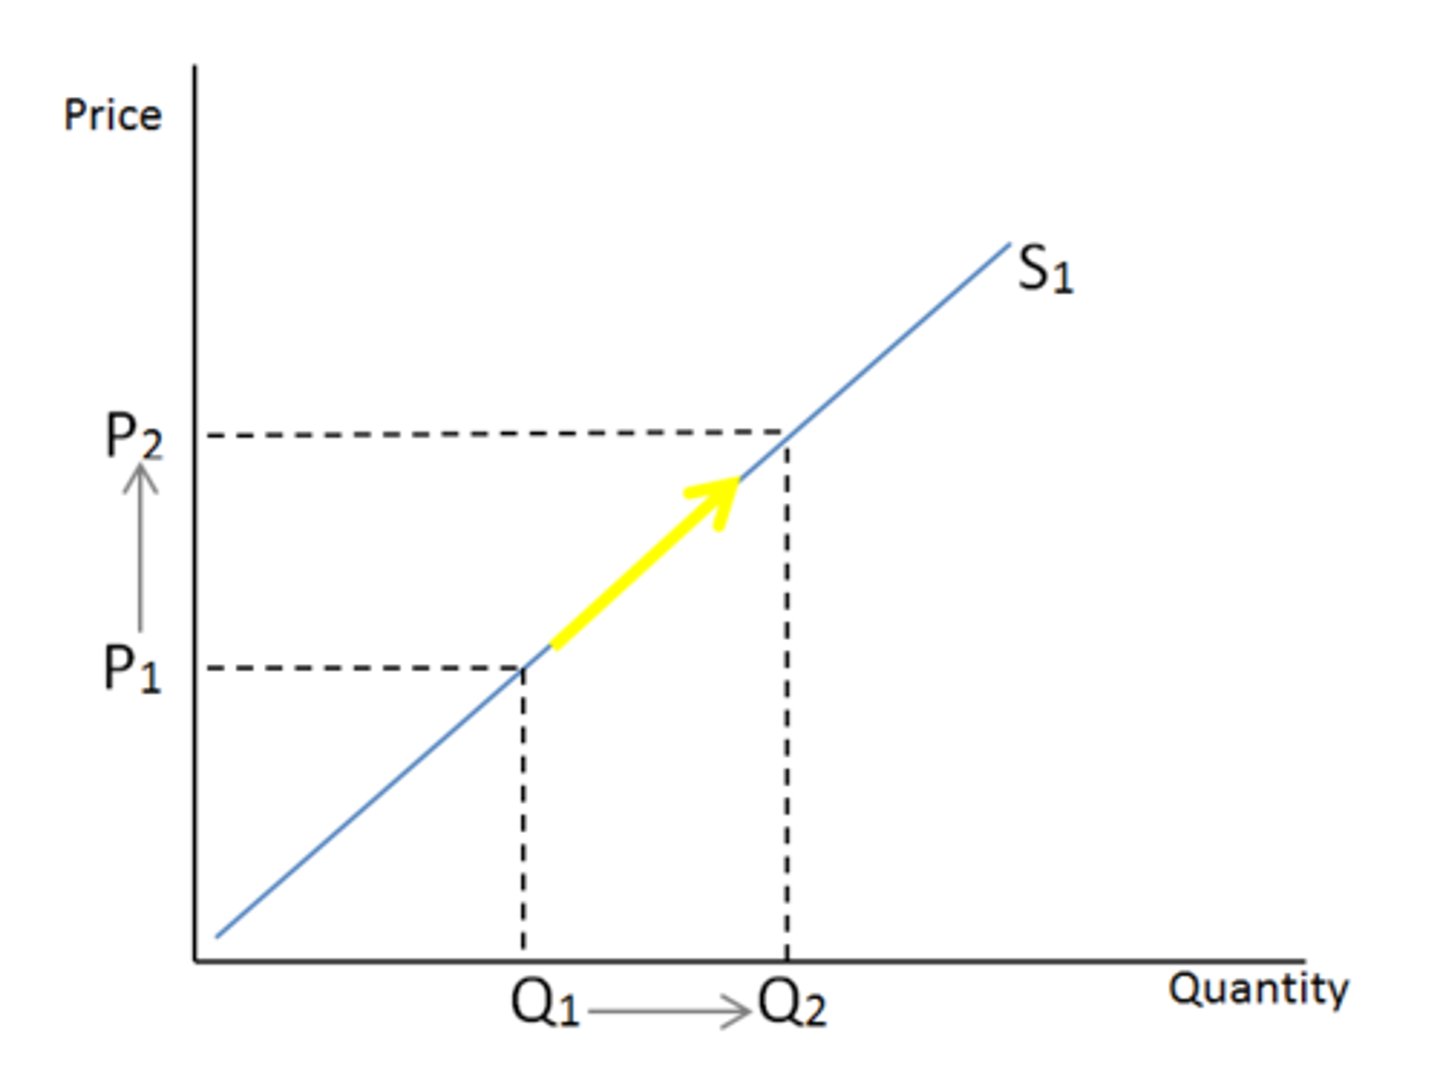
Movement along supply curve cause (CH3)
When price changes, quantity supplied changes (change in quantity supplied).
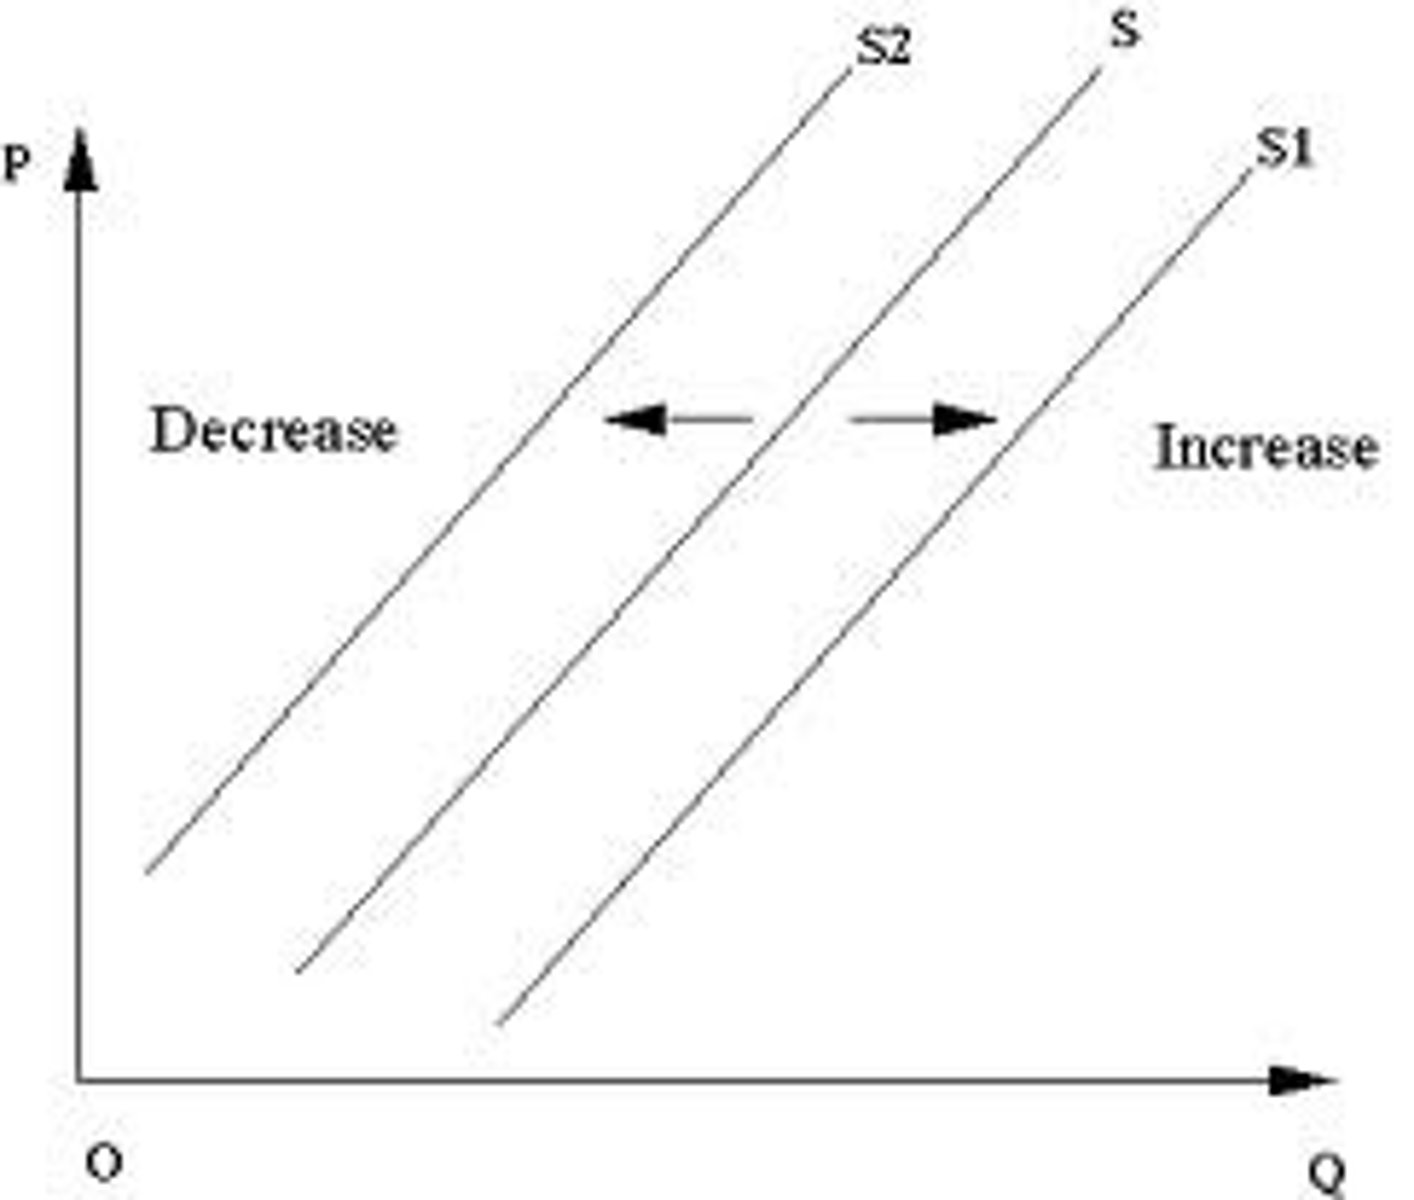
Change in supply curve movement cause (CH3)
Moves if anything other than price changes (change in supply).
Graph movement for change in quantity supplied (CH3)
Increase = point moves down and right; Decrease = point moves up and left.
Graph movement for change in supply (CH3)
Increase = out; Decrease = in.
Factors that shift supply curve (CH3)
Cost of inputs, productivity and technology, substitutes in production, complements in production, # of sellers, expectations.
Market supply (CH3)
Sum of supply curve of all suppliers.
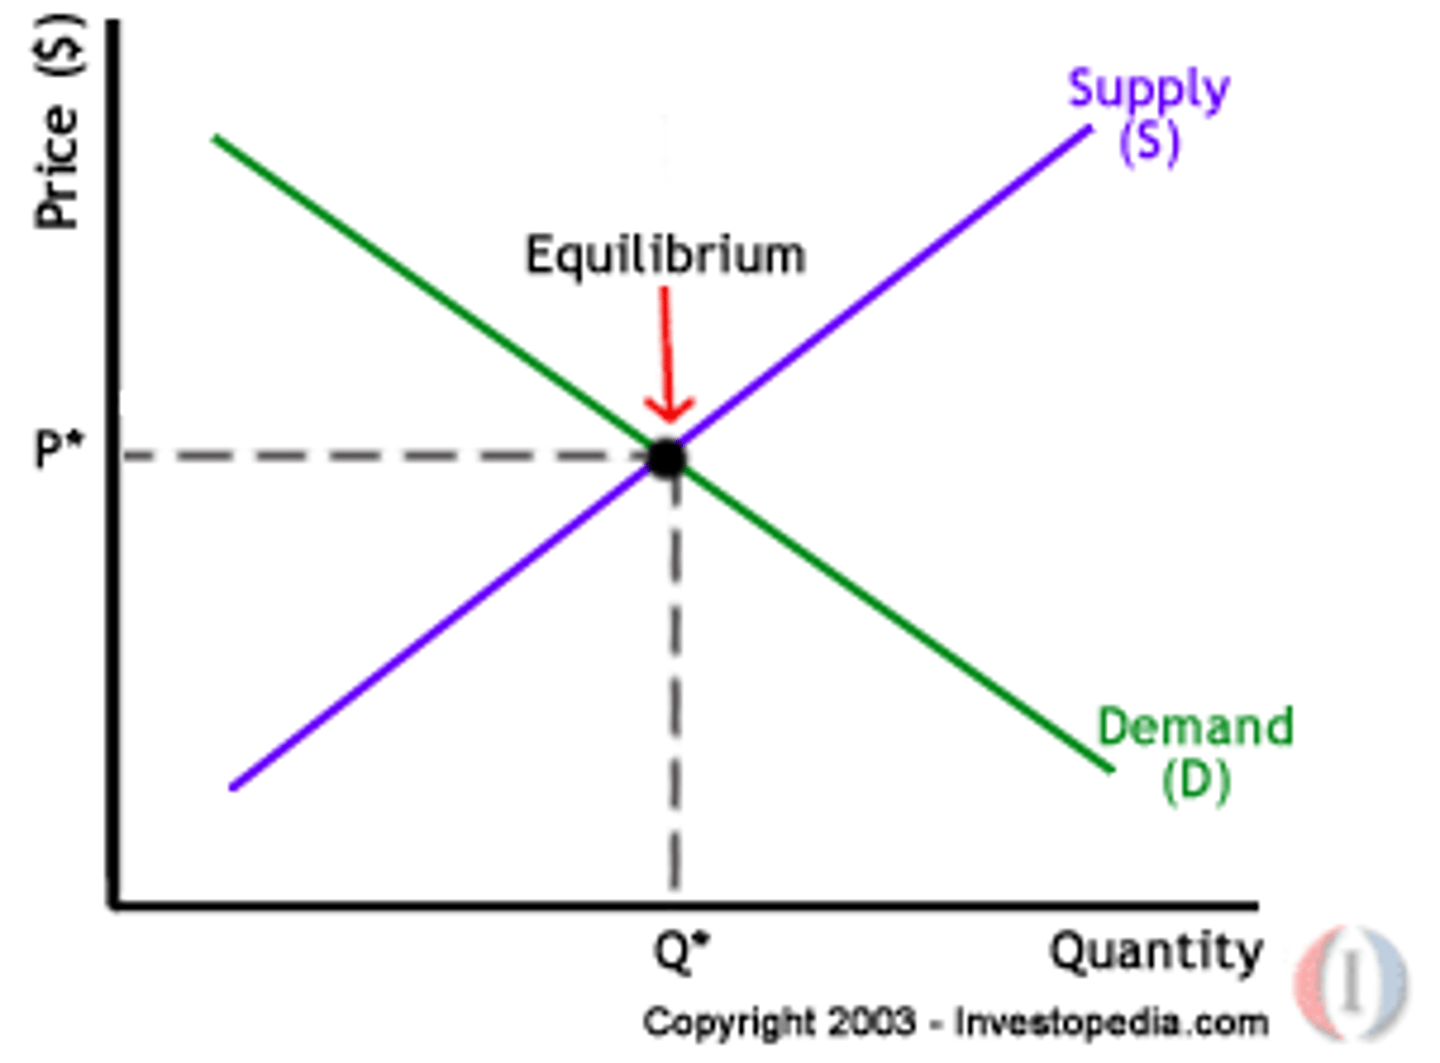
Equilibrium (CH4)
Nobody can do anything different to make themselves better off, supply and demand together.
Market (CH4)
Any setting that brings potential buyers and sellers together.
Incentive (CH4)
Opportunity to make yourself better off.
Surplus (CH4)
Above equilibrium point.
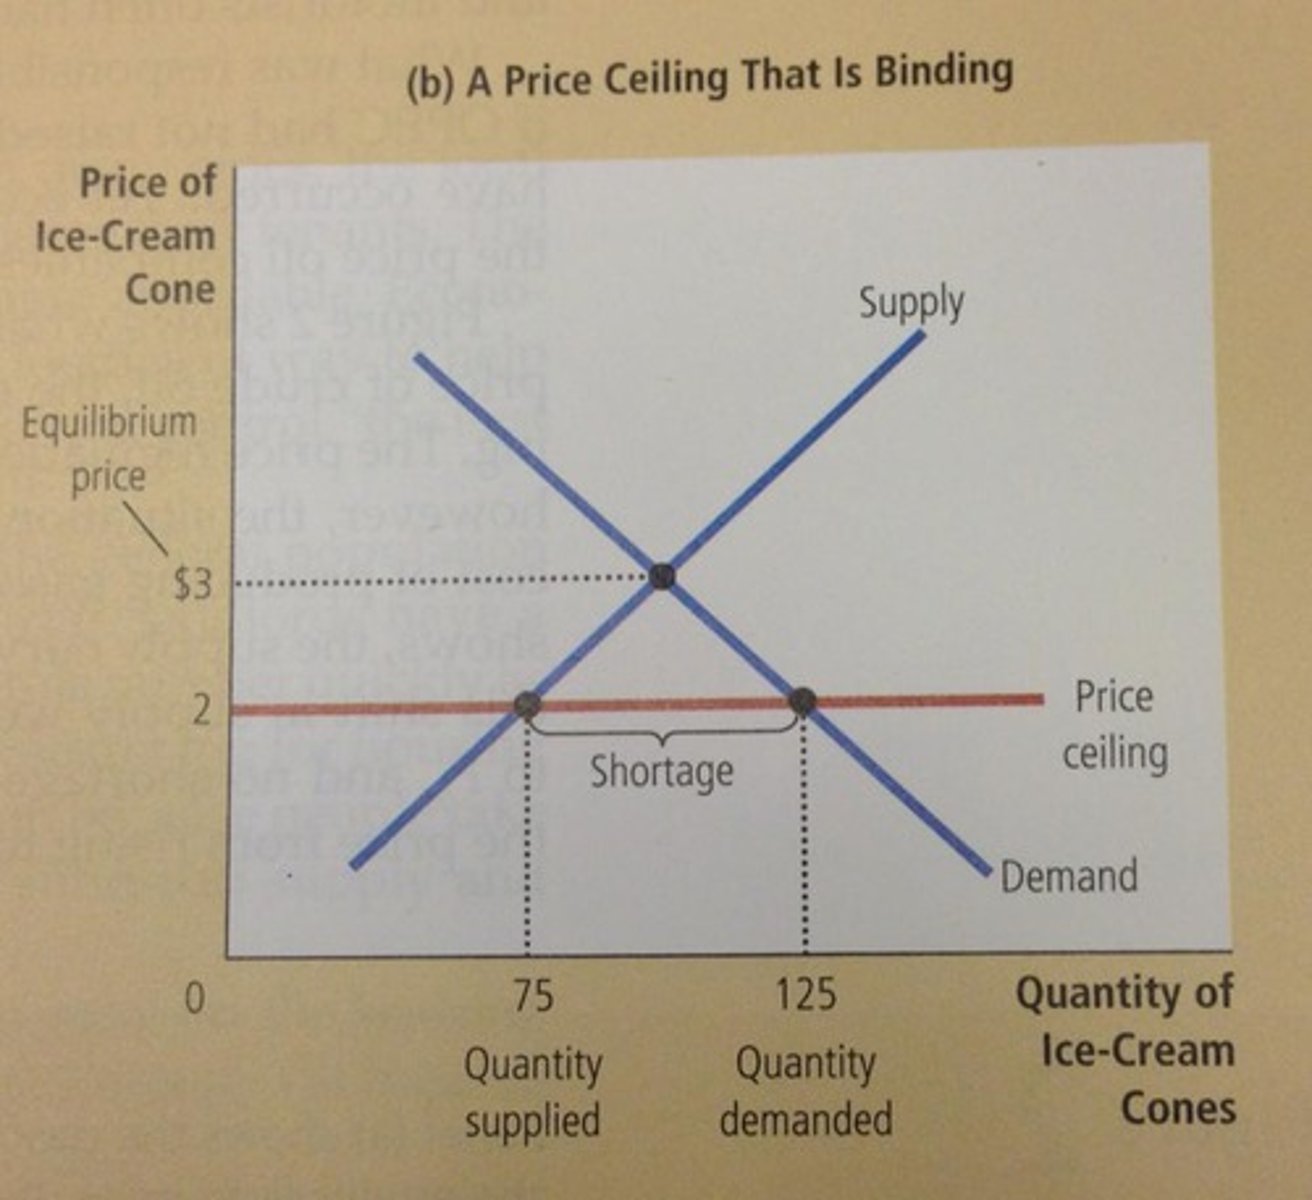
Shortage (CH4)
Below equilibrium point.
Steps to solve and interpret equilibrium problems (CH4)
What changes? Supply or demand? Find direction of shift; Draw supply and demand graphs, pre-change and post-change; Find pre-change and post-change problems; Interpret how did price and quantity change.
Price elasticity of demand (CH5)
Seeing how flexible it is to change the price of one good and how that change will affect the quantity demanded (cause and effect)
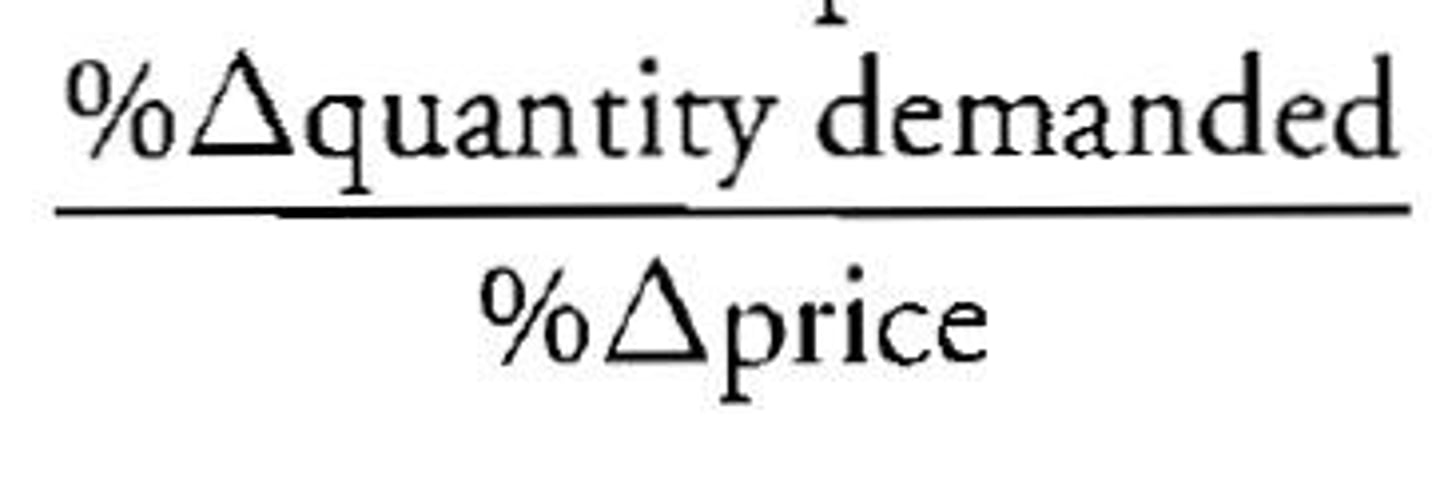
Price elasticity of demand equation (CH5)
Percentage of change in quantity demanded / percentage of change in price
Percentage of change in quantity demanded (CH5)
(new quantity - old quantity) / old quantity
Percentage of change in price (CH5)
(new price - old price) / old price
Elasticity of demand sign (+ or -) (CH5)
Always negative because of law of demand (picture demand curve)
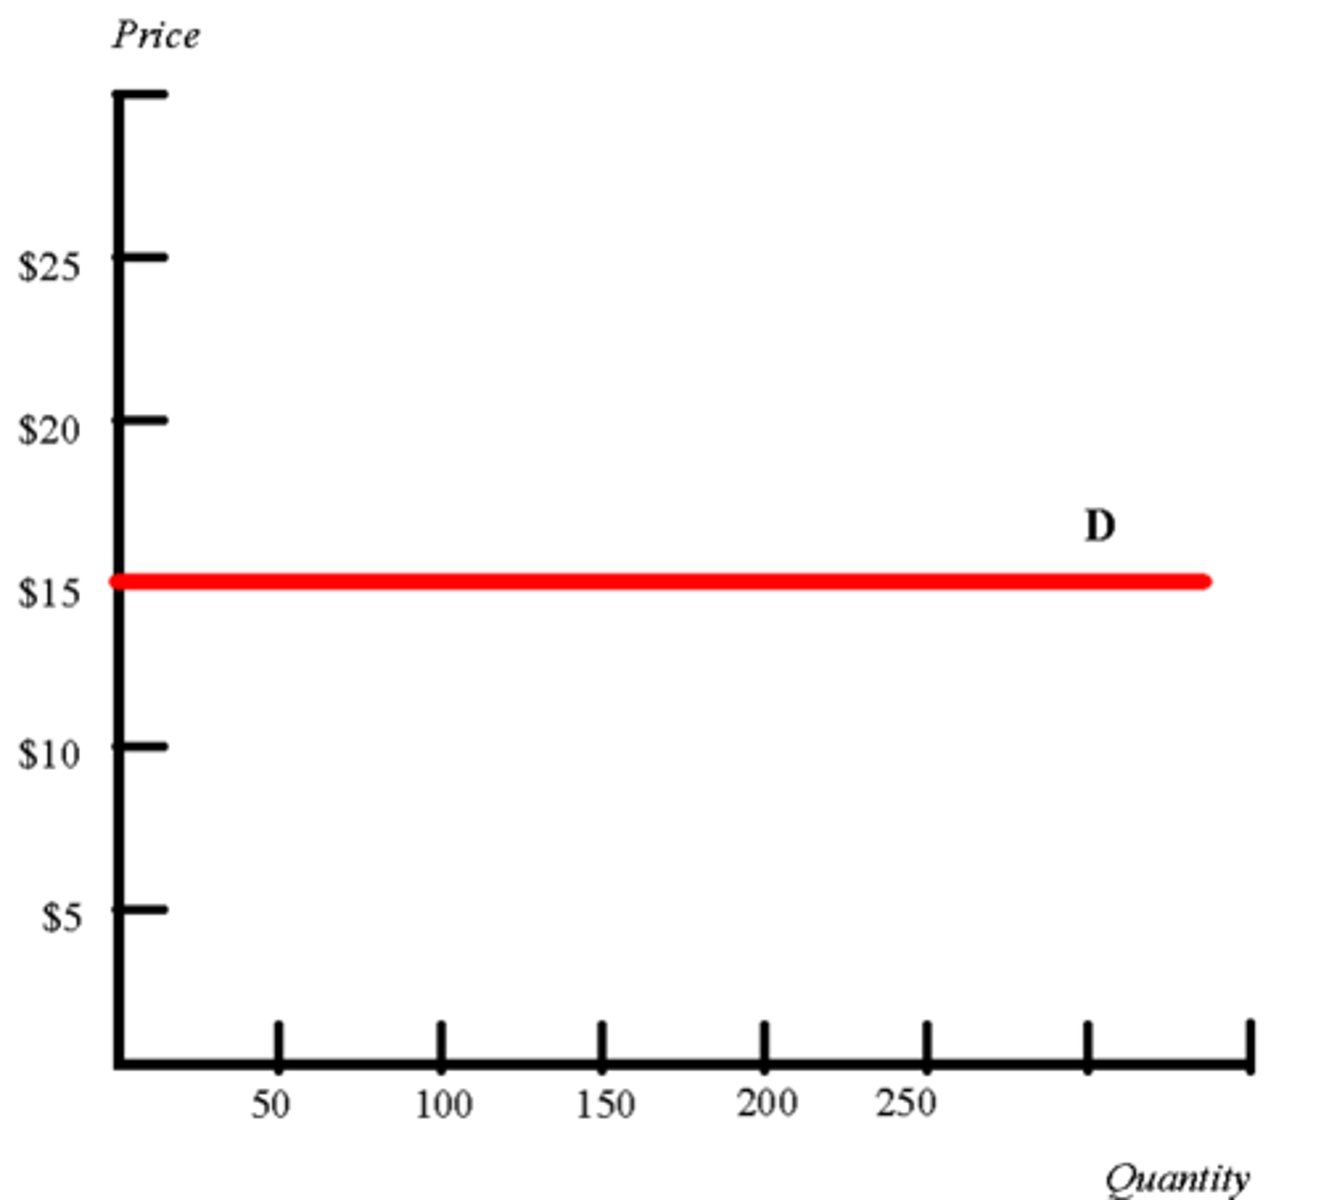
Elastic (CH5)
Easy to change and replace, stretchy and can move easily
Inelastic (CH5)
Hard to change and replace, rigid and unable to change
Elastic ED (elasticity of demand) (CH5)
If | ED | > 1, a small change in price causes a big change in quantity demanded
Inelastic ED (elasticity of demand) (CH5)
If | ED | < 1, a big change in price causes a small change in quantity demanded
Unit elastic ED (elasticity of demand) (CH5)
| ED | = 1
Elastic situation for companies (CH5)
If a percentage increase in price is less than a percentage decrease in sales, lower the price to raise revenues. Vice versa
Inelastic situation for companies (CH5)
If a percentage increase in price is more than a percentage decrease in sales, raise the price to raise revenues. Vice versa
Unit elastic situation for companies (CH5)
At unit elasticity, revenue is maximized.
Substitutes in elasticity (CH5)
The more substitutes a good has, the more elastic it is
Time in elasticity (CH5)
The more time to plan a purchase, the more elastic the good is
Consumer search in elasticity (CH5)
Goods where consumers are more willing to look for a cheaper option are more elastic
Cross price elasticity of demand equation (CH5)
Percentage of change in quantity demanded of good X / percentage in change of price of good Y
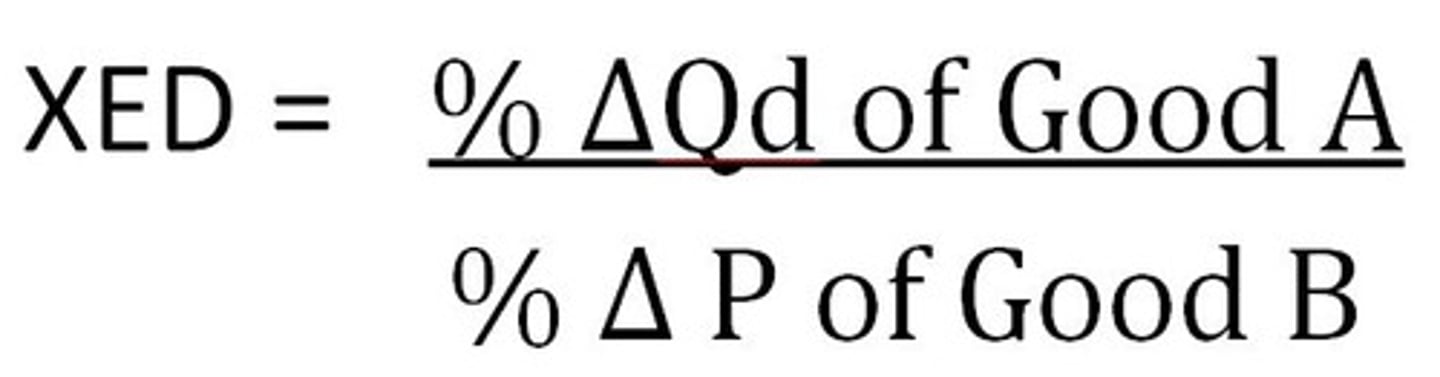
Cross price of elasticity (CPE) sign (+ or -) (CH5)
If two goods are substitutes, CPE is (+). If two goods are complements, CPE is (-).
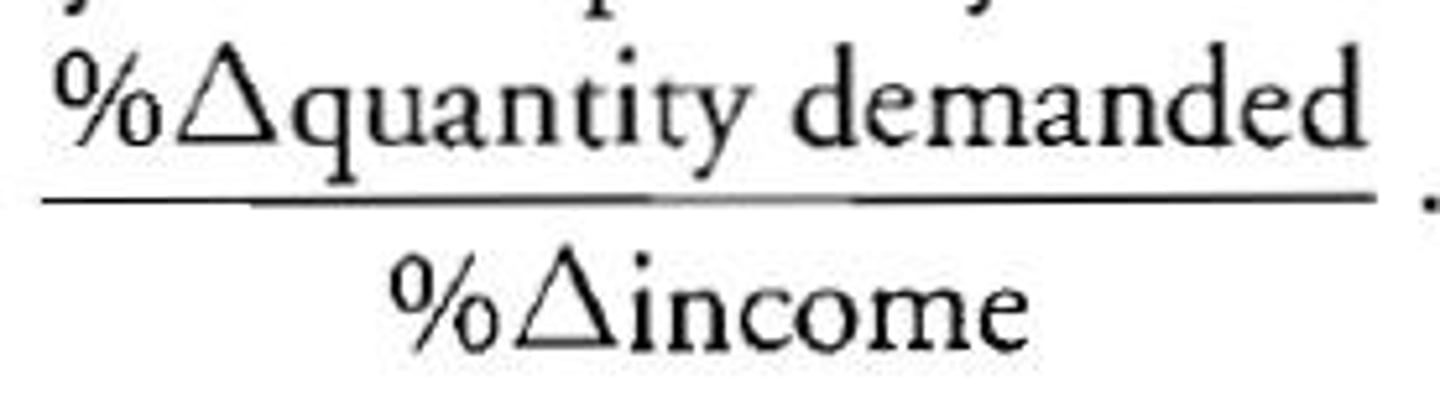
Income elasticity of demand equation (CH5)
Percentage of change in quantity demanded / percentage of change in income
Elasticity of supply sign (CH5)
Always (+) (think of supply curves)
Price of elasticity of supply equation (CH5)
Percentage of change in quantity supplied / percentage of change in price

Elastic ED (elasticity of supply) (CH5)
If | ED | > 1, a small change in price causes a big change in quantity supplied
Inelastic ED (elasticity of supply) (CH5)
If | ED | < 1, a big change in price causes a small change in quantity supplied

Factors that increase elasticity of supply (CH5)
High inventory, easily available inputs, extra capacity, easy entry and exit into the market, time
Price elasticity of supply (CH5)
Seeing how flexible it is to change the price of one good and how that change will affect the quantity supplied (cause and effect)
Tax on sellers/buyers (CH6)
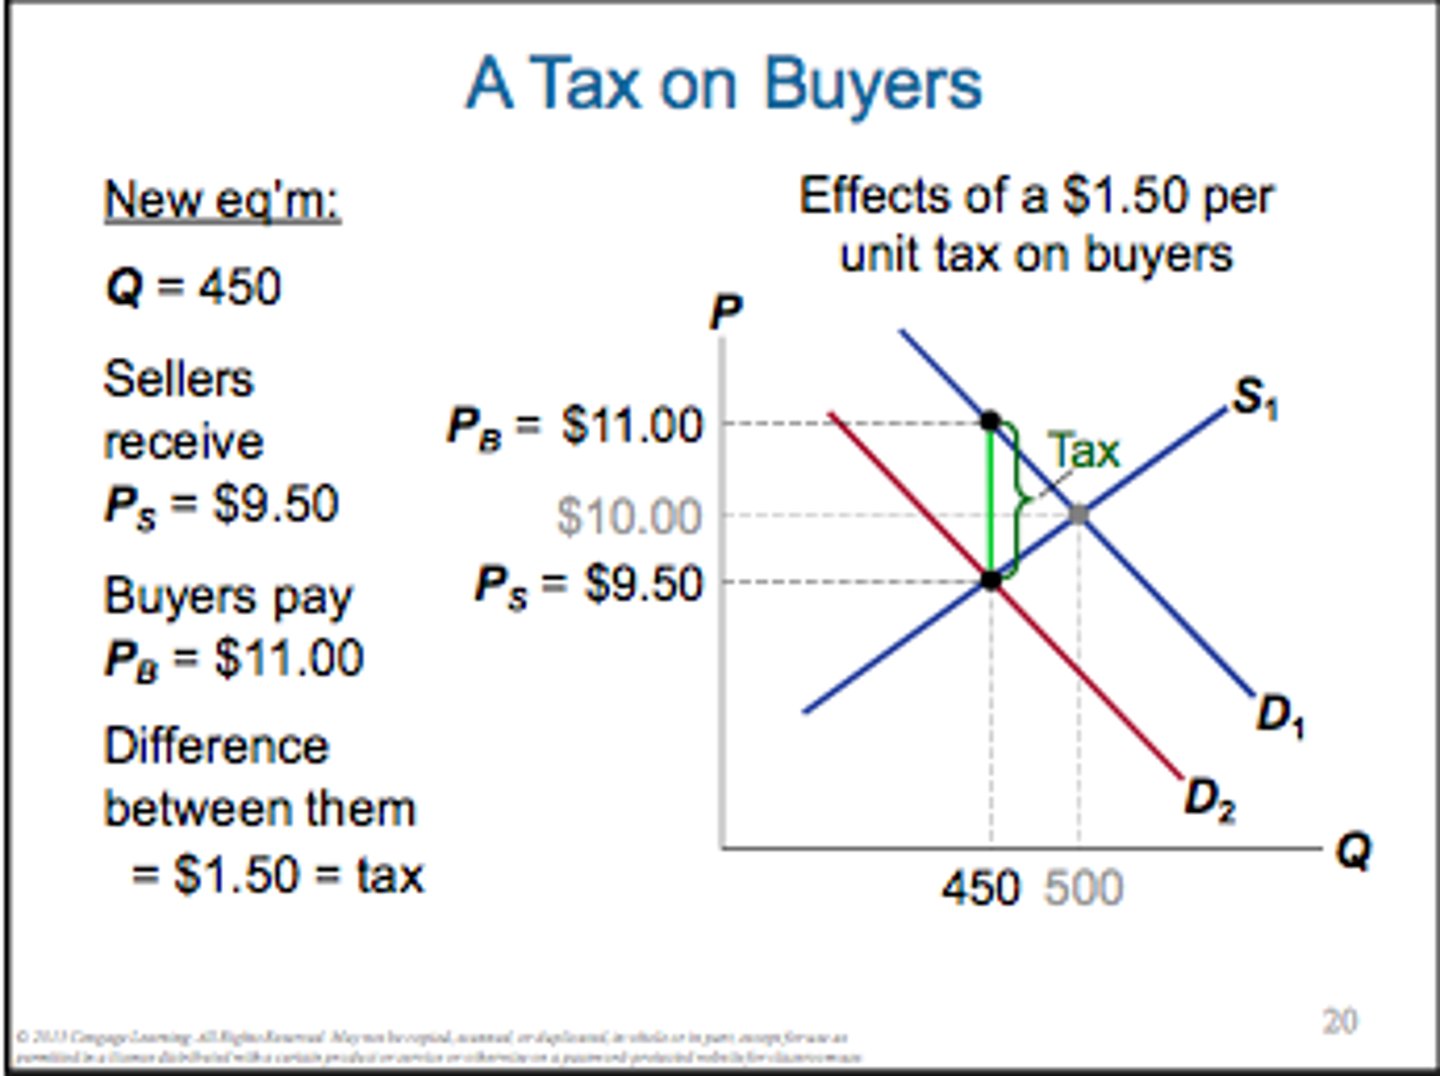
Statutory burden (CH6)
Who's paying tax to government
Economic burden (CH6)
Who's pocket the tax is coming out of
Tax incidence (CH6)
It doesn't matter who the tax is on (sellers or buyers), prices and amounts are the same. The only difference is the perspective.
Economic burden on relative elasticity (CH6)
Whoever's supply/demand is more elastic pays less of the burden
Commonly taxed goods (CH6)
Inelastic goods that will create more revenue if taxes
Subsidies (CH6)
Negative taxes, government pays the buyer or seller
Price ceiling (CH6)
Max price a good can be sold at, typically create shortages
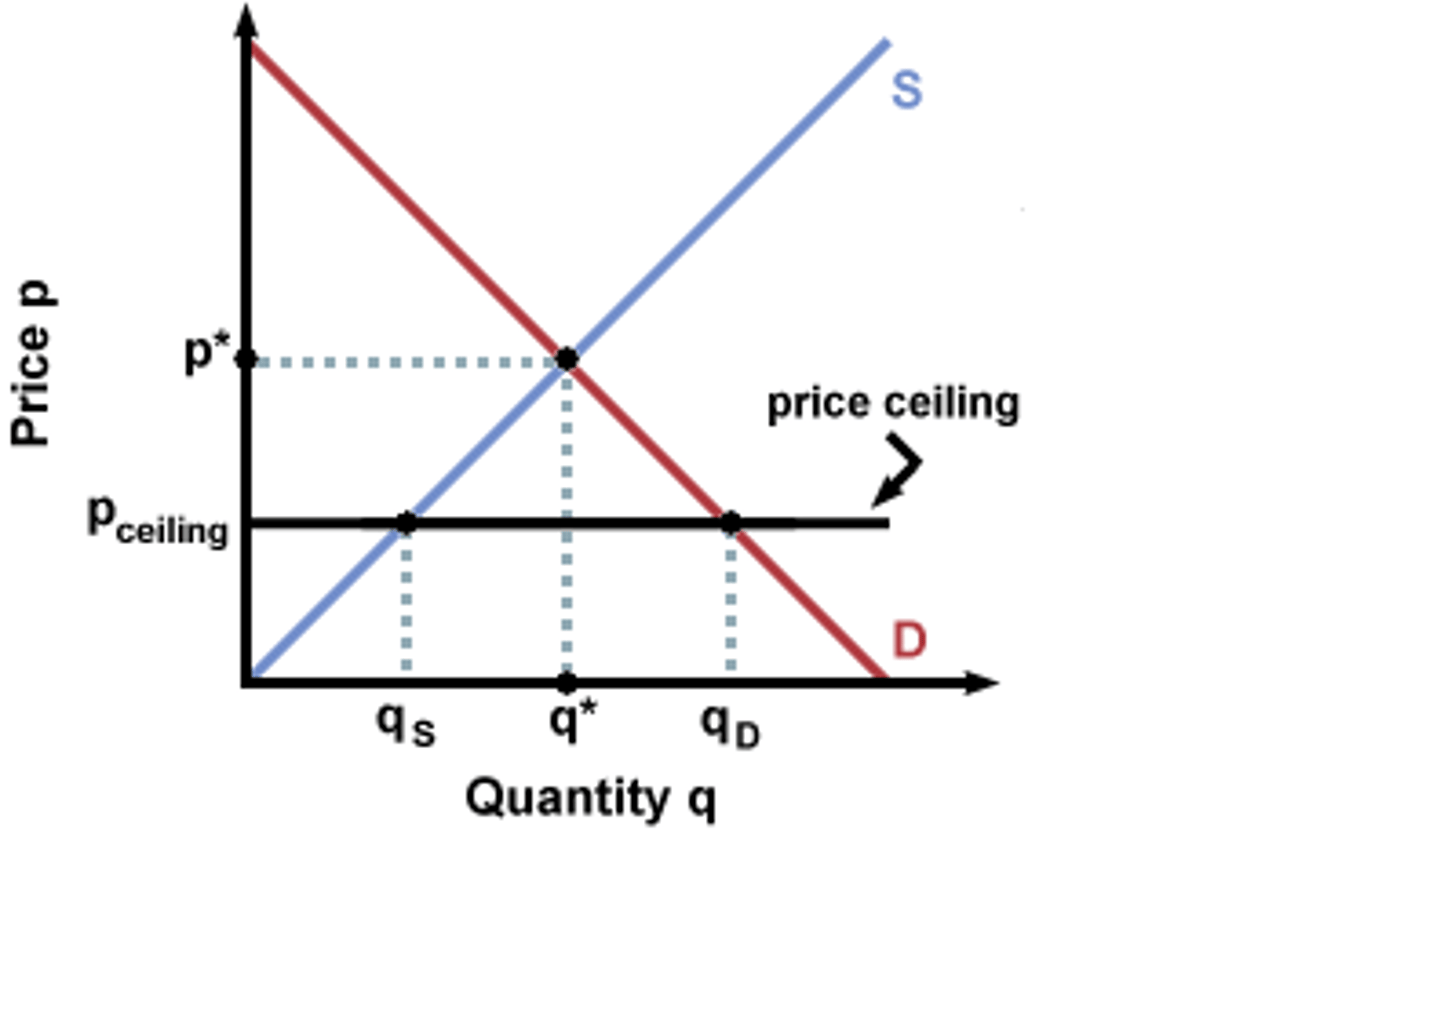
Binding price ceiling (CH6)
When the price ceiling is below the equilibrium point
Rent control (CH6)
Price ceiling in real estate
Price floor (CH6)
Min price a good can be sold at

Binding price floor (CH6)
When the price floor is above the equilibrium point, typically seen in min-wage laws

Policy analysis (CH7)
Thinking about all outcomes when possibly implementing a policy
Positive economics (CH7)
Factual statement, "what is"
Normative economics (CH7)
Value statement, "what ought to be"
Stages of policy analysis (CH7)
Stage 1 (positive) : what's going to happen; Stage 2 (normative): what should happen
Economic surplus equation (CH7)
Total benefits - total costs
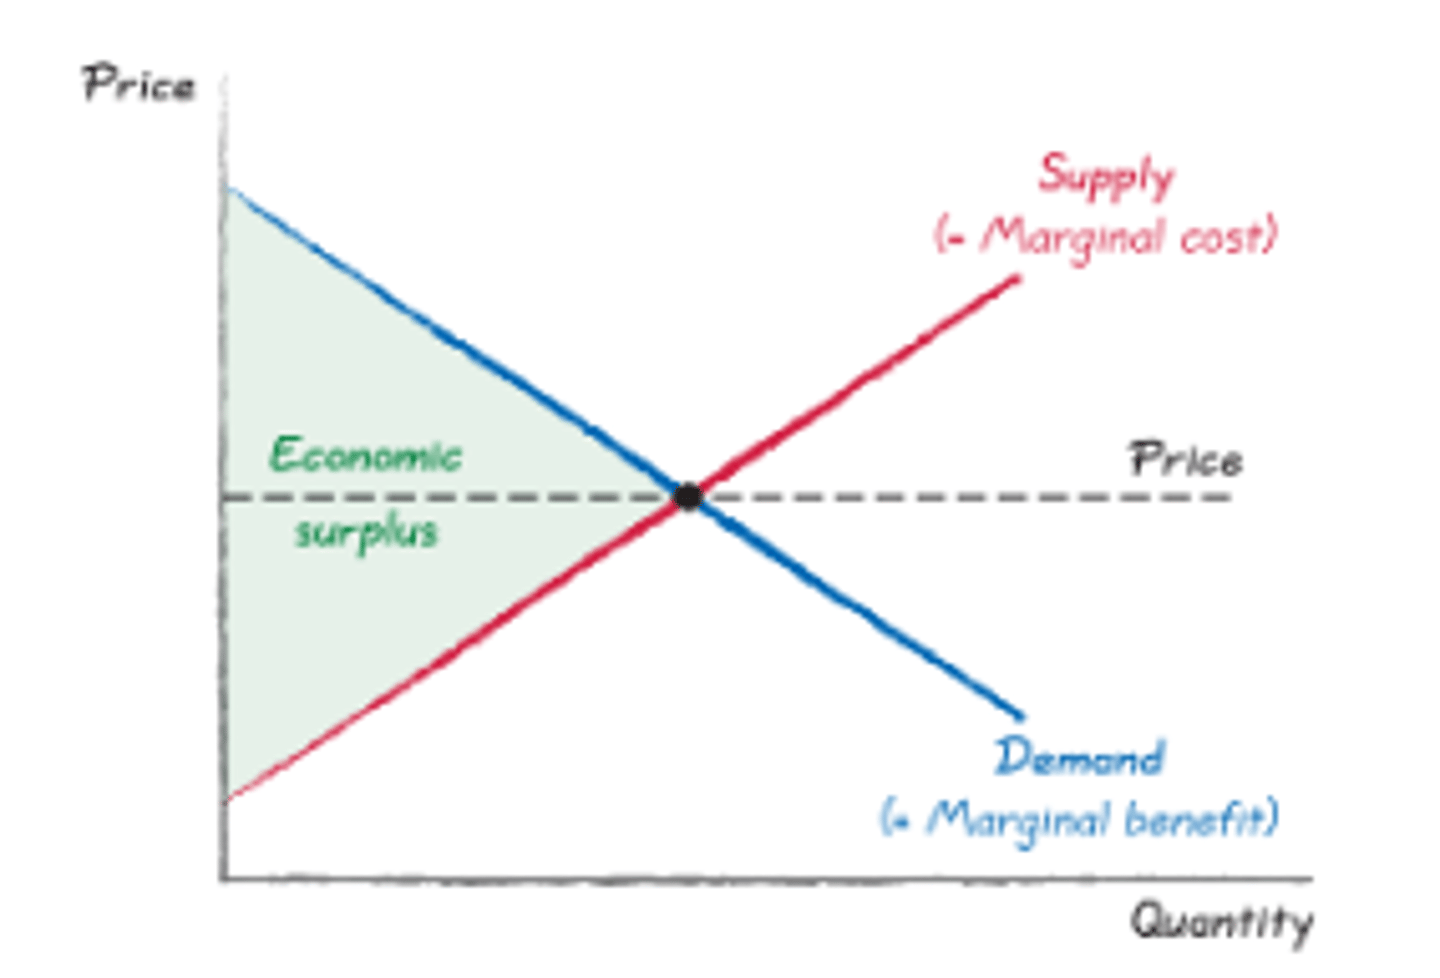
Total surplus/efficient outcome (CH7)
Largest possible economic surplus
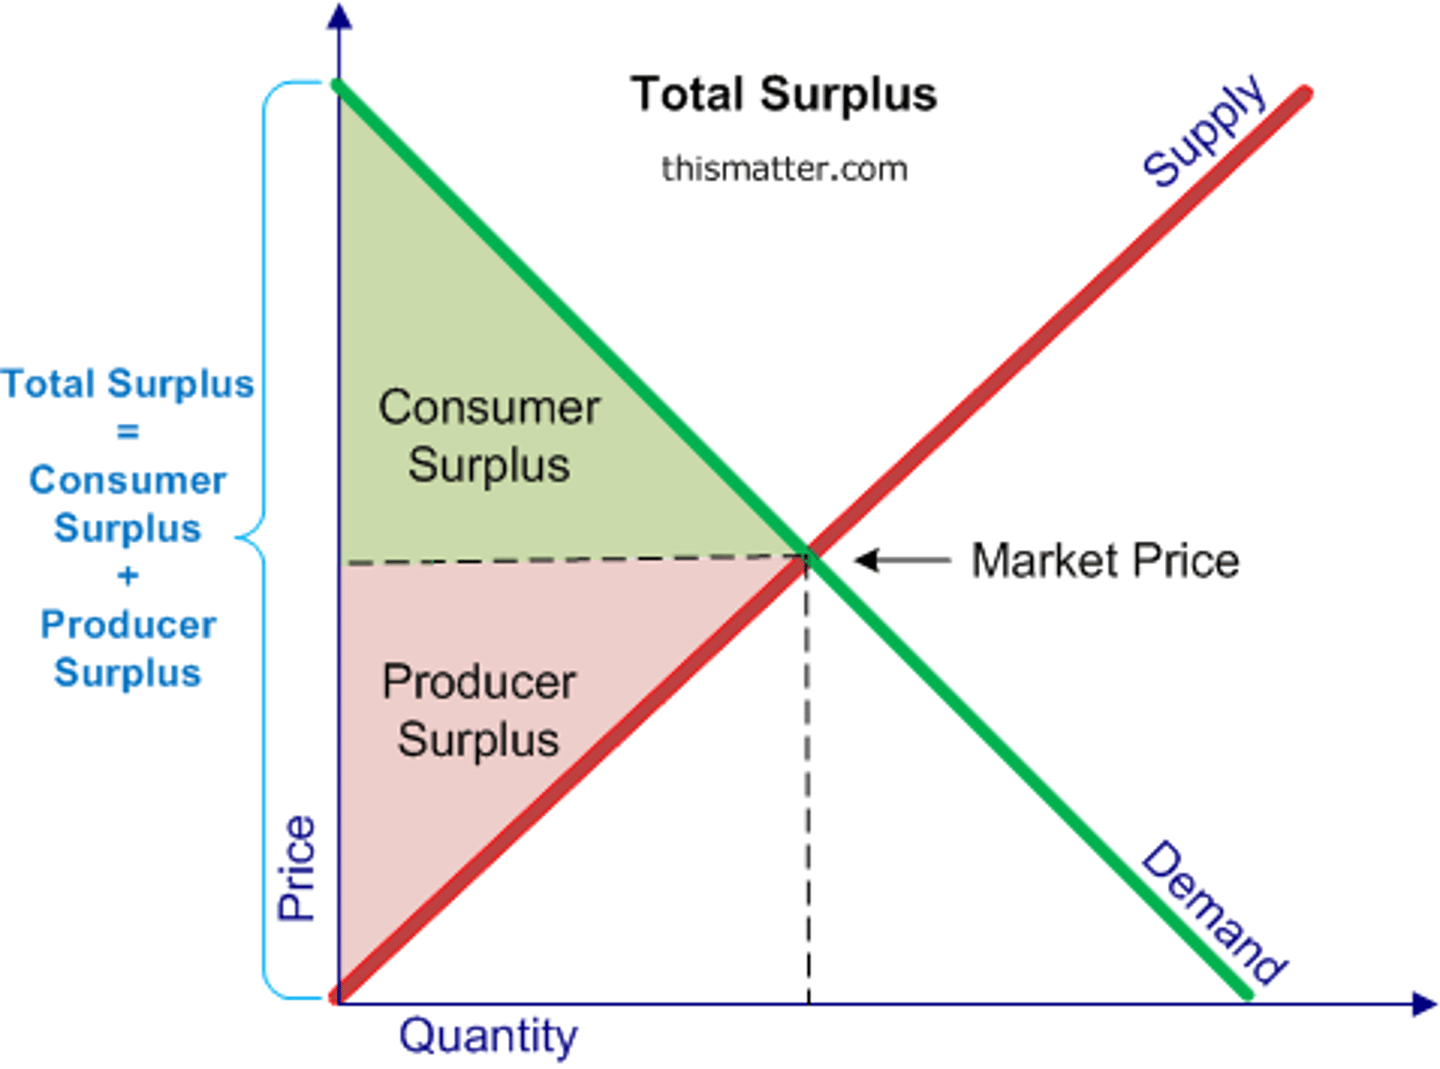
Consumer surplus equation (CH7)
Marginal benefit - price sold (area between demand curve and above price)
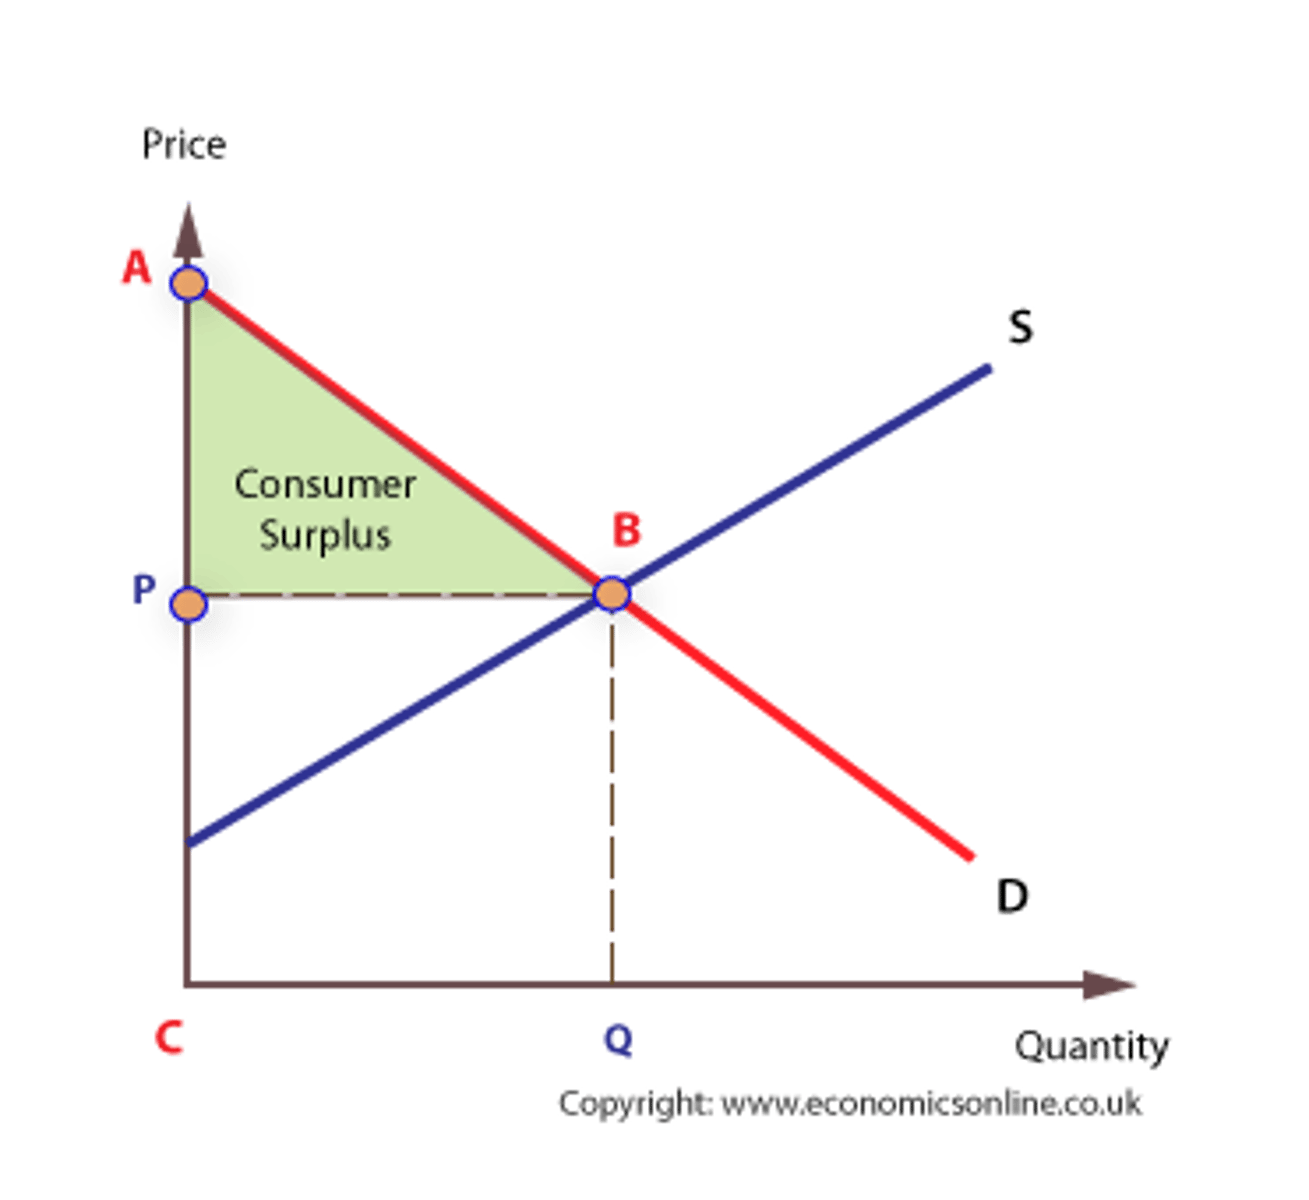
Consumer surplus effect if price decreases (CH7)
If price decreases, consumer surplus increases
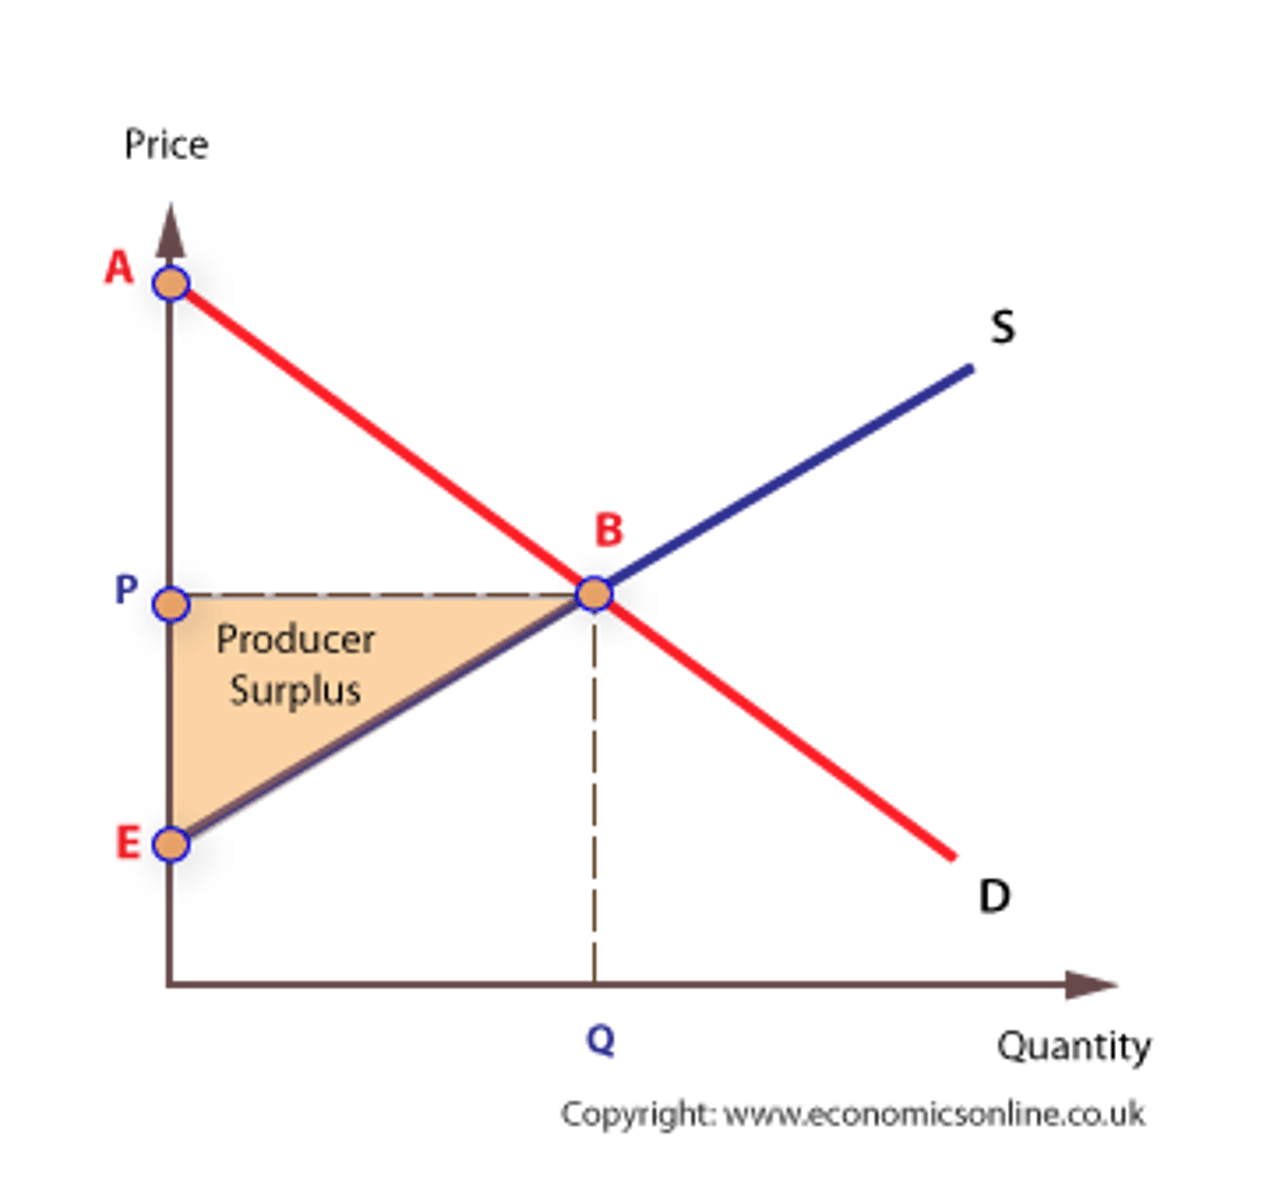
Producer surplus equation (CH7)
Marginal cost - price sold (area above supply curve and below price sold)
Total welfare equation (CH7)
Consumer surplus + producer surplus
Market at equilibrium (CH7)
When quantity supplied = quantity demanded, max total surplus

Invisible hand (CH7)
Natural market efficiency
Market failures (CH7)
Supply and demand lead to inefficient outcome