Dynamic
 Call Kai
 Learn
Learn Practice Test
 Spaced Repetition
 Match
Match Flashcards
 Knowt Play
1/7

There's no tags or description
Looks like no tags are added yet.
Name | Mastery | Learn | Test | Matching | Spaced | Call with Kai | Chat |
|---|
No analytics yet
Send a link to your students to track their progress
8 Terms
The first diagram shows the number of train passengers from 2000 to 2009. The second graph shows the percentage of trains running on time.
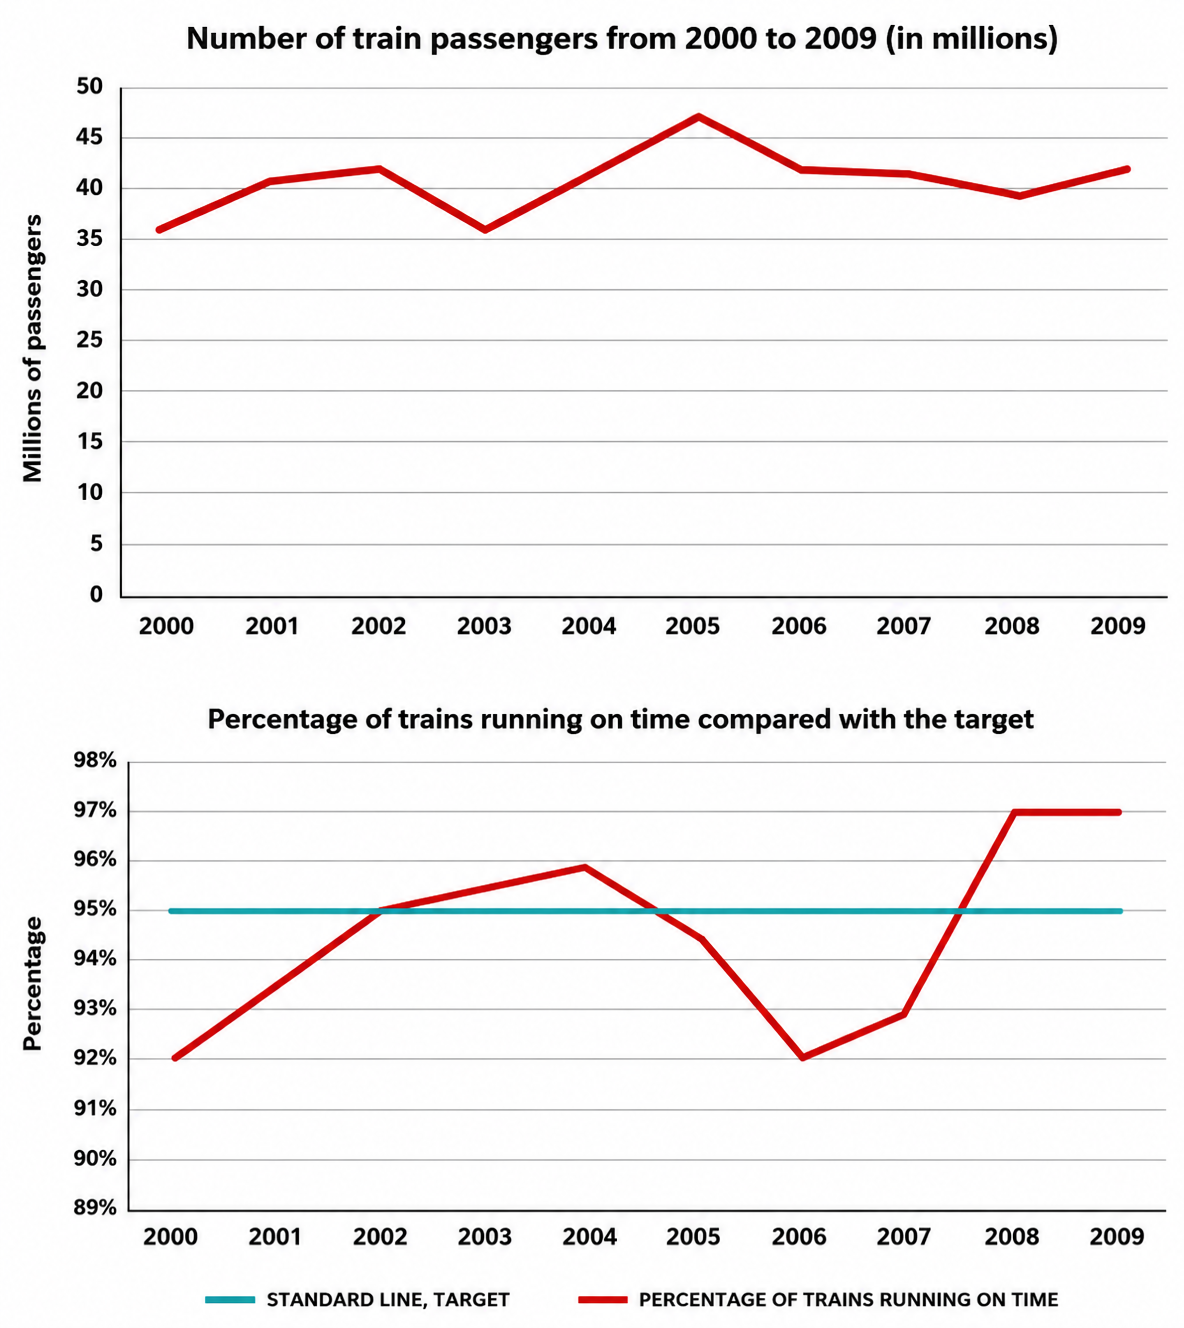
The line graphs illustrate_____ ______ _______ _______ the train between 2000 and 2009, and the proportion of ________ ________ compared with ________ ________ over the same period.
The line graphs illustrate how many people took the train between 2000 and 2009, and the proportion of punctual trains compared with annual targets over the same period.
The first diagram shows the number of train passengers from 2000 to 2009. The second graph shows the percentage of trains running on time.
Overall, it is clear that while both figures _____ ______ _______, the number of passengers _____ ______ _______ than _______ levels, with the latter generally oscillating _______ around its y_______ _______ . Also, although passenger volumes showed some _______ with the percentage of _______ trains, this was not always the _______ .
Overall, it is clear that while both figures recorded net increases, the number of passengers changed more frequently than punctuality levels, with the latter generally oscillating closely around its yearly standard. Also, although passenger volumes showed some correlation with the percentage of punctual trains, this was not always the case.
The first diagram shows the number of train passengers from 2000 to 2009. The second graph shows the percentage of trains running on time.
With _____ to the number of passengers, 38 million people t_____ _____ _____ n in 2000, and this figure rose _____ before _____ to the _____ level in 2003. This was followed by another period of fluctuation, albeit more _________ with passenger numbers peaking at 48 million, also the _______ figure across the ______ , prior to another _________in 2008. However, there was an ________ in the final year, ________ _____ a _____ increase of 4 million over nine years.
With regard to the number of passengers, 38 million people took the train in 2000, and this figure rose mildly before receding to the initial level in 2003. This was followed by another period of fluctuation, albeit more pronounced, with passenger numbers peaking at 48 million, also the largest figure across the board, prior to another regression in 2008. However, there was an uptick in the final year, translating into a net increase of 4 million over nine years.
The first diagram shows the number of train passengers from 2000 to 2009. The second graph shows the percentage of trains running on time.
Turning to __________ levels, the y__________ __________ was set at 95% __________ , which actual percentages failed to ________ in the first two years, despite an increase from 92% to 94%. Similar to the changes in passenger numbers, punctuality also __________ and __________ , matching ex__________ in 2002, __________ it in 2003 and 2004, before falling below the __________ , __________ to its __________ level in 2006. However, the proportion of trains running on time then __________ and __________ at 97% in 2008 and 2009, f__________ __________ the __________ target at the end.
Turning to punctuality levels, the yearly target was set at 95% throughout, which actual percentages failed to match in the first two years, despite an increase from 92% to 94%. Similar to the changes in passenger numbers, punctuality also rose and fell, matching expectation in 2002, surpassing it in 2003 and 2004, before falling below the target, returning to its original level in 2006. However, the proportion of trains running on time then recovered and stabilized at 97% in 2008 and 2009, firmly exceeding the annual target at the end.
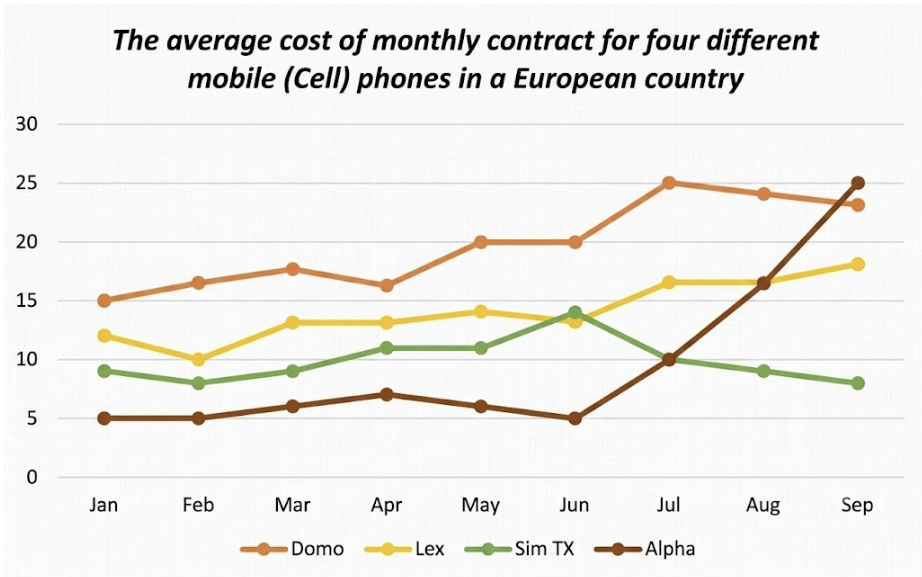
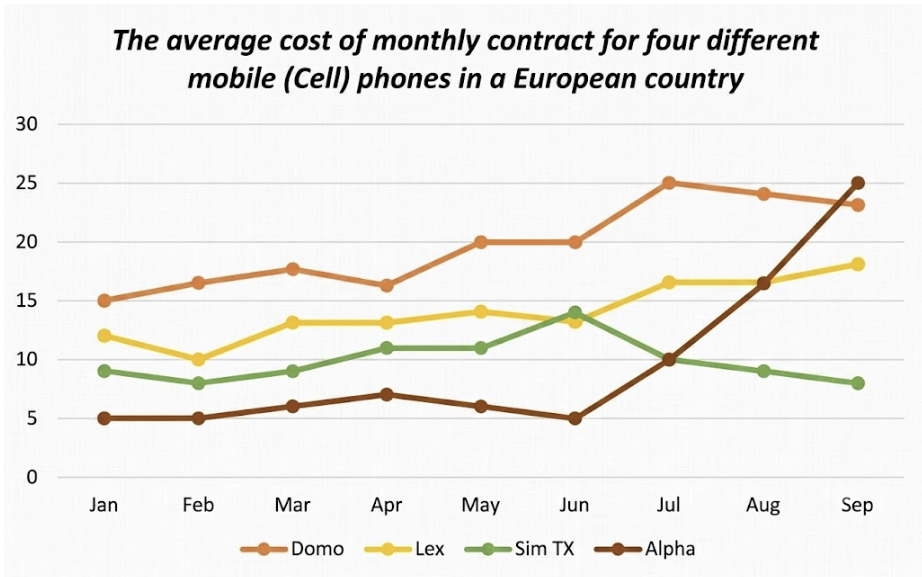
The chart below shows the average cost of a monthly contract for four different mobile (cell phones) companies in a European country from January to September 2002, measured in euros. Summarize the information by selecting and reporting the main features, and make comparisons where relevant.
The chart illustrates _______ _______ ________ contracts with four different mobile companies _____ in a European country from January to September 2002.
The chart illustrates how much monthly contracts with four different mobile companies cost in a European country from January to September in 2002.
Overall, it is clear that prices ________ to increase _______ the latter months, with the only ___________ being contracts with Slim TX. However, while Domo was the _____ _________ _______ for _____ of the period, it was _______ by Alpha, usually the ________, in the _____ month.
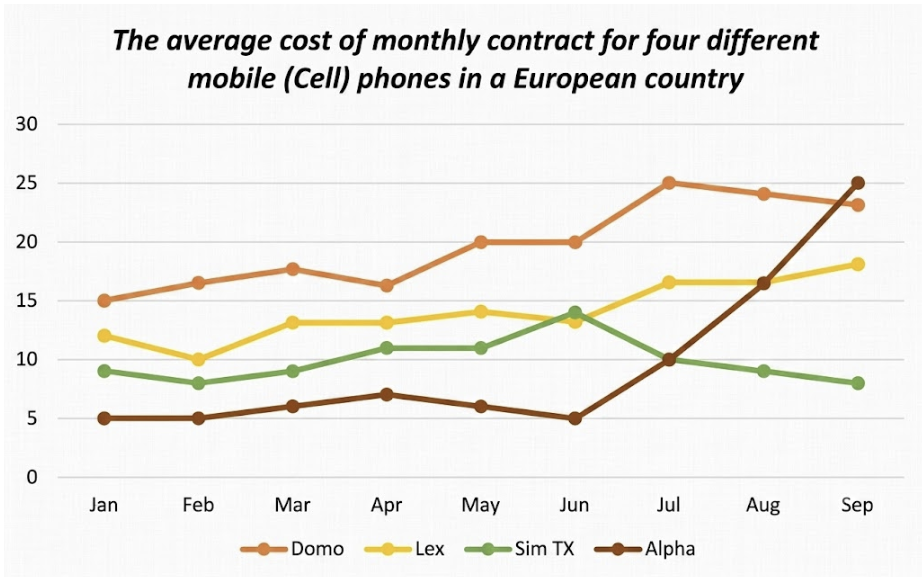
Overall, it is clear that prices tended to increase towards the latter months, with the only exception being contracts with Slim TX. However, while Domo was the most expensive brand for most of the period, it was replaced by Alpha, usually the cheapest, in the last month.
Looking first at the contracts with Domo and Alpha, the _______ _____ 15 euros in January, three _______ the ______ in the _______ month. Domo’s prices then __________ on a _______ climb, reaching a _____ of 25 euros in July before ________ ______ to 23 euros in September. Meanwhile, Alpha ______ the ______ _________ _________ in _______ of the period, ________ between 5 and 7 euros _______ in the first six months. However, the cost then _____ _______, __________ other companies in the last three months to ________ at 25 euros in September.
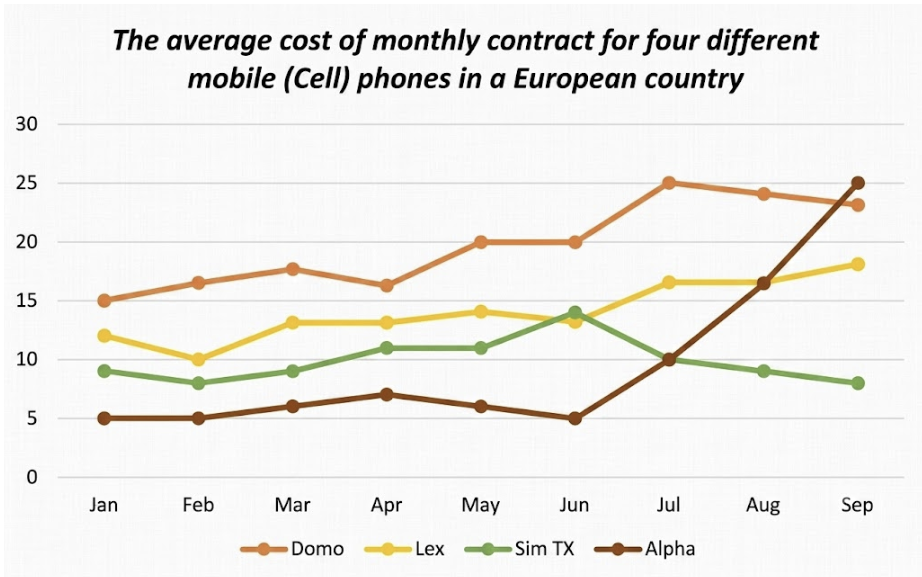
Looking first at the contracts with Domo and Alpha, the former cost 15 euros in January, three times the latter in the same month. Domo’s prices then embarked on a strong climb, reaching a high of 25 euros in July before falling back to 23 euros in September. Meanwhile, Alpha had the least expensive contracts in most of the period, changing between 5 and 7 euros mildly in the first six months. However, the cost then rose steeply, surpassing other companies in the last three months to peak at 25 euros in September.
By _______, contracts with Lex and Slim TX were _______ _____, ________12 euros and 9 euros in January, respectively. Their _______ then increased at a _______ _____ to _______ ________ the ______ price in June, at around 14 euros, before __________ afterwards. Lex’s contracts ________ their upward trend, reaching 18 euros, whereas Slim TX’s prices fell by ______, ending at 7 euros, which was also the _______ that month.
By contrast, contracts with Lex and Slim TX were relatively close, costing 12 euros and 9 euros in January, respectively. Their figures then increased at a similar pace to reach roughly the same price in June, at around 14 euros, before diverging afterwards. Lex’s contracts resumed their upward trend, reaching 18 euros, whereas Slim TX’s prices fell by half, ending at 7 euros, which was also the lowest that month.