9/14 Mechanisms of Evolutionary Change
 Call Kai
 Learn
Learn Practice Test
 Spaced Repetition
 Match
Match Flashcards
 Knowt Play
1/8

There's no tags or description
Looks like no tags are added yet.
Name | Mastery | Learn | Test | Matching | Spaced | Call with Kai | Chat |
|---|
No analytics yet
Send a link to your students to track their progress
9 Terms
Null Hypothesis vs Alternative Hypothesis (What are they used for?)
these are often used in statistical tests when determining whether or not HW conditions are met based on observed and expected genotype frequencies
Natural populations almost never perfectly meet HW conditions but many genes can approximate them.
Null Hypothesis (H0): there is no effect; there is no difference between the expected and observed values
Alternative Hypothesis (HA): there is a difference between the expected and observed values
Frequency Histogram
Shows data points categorized into equal sized ‘bins’
frequency can be relative or absolute

What is a “Goodness of Fit” statistical test used for? What is one example of this type of test?
used to determine if an observed result is consistent with an expected result
One type is the Chi-squared goodness of fit test
What is the Chi-Squared Goodness of Fit Test? What is it used for?
used to detect the goodness of fit for data that fit into one of the predetermined categories (experimental categories set up before data collection, for example, genotypes); essentially determines if your observed sample data matches an expected distribution
Chi-Square Statistic (how does it determine when a result is significant?)
O is the count of observed and E is the count of expected
k is the number of categories
The calculated chi-square statistic has to be greater than or equal to the critical value in order to reject the null hypothesis.

Chi-Square Distribution (what is it? what part of the curve indicates significant results?)
a probability distribution function, similar to normal distribution
A chi-square statistic that falls to the right of p = 0.05 boundary indicates significant results and means the null hypothesis is rejected.
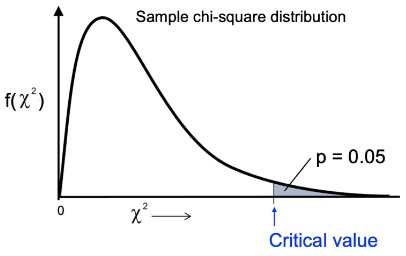
What is the critical value? What is it on the chi-square distribution curve? What determines critical value?
A specific value that acts as the threshold on the x-axis of the chi-square distribution curve
It is determined by the significance level, which is usually 0.05, and the degree of freedom, which is usually k minus 1.

What degree of freedom is used for Hardy-Weinberg problems?
1 degree of freedom
What does the significance level mean?
denoted by alpha α
It is the maximum risk you are willing to take of committing a false positive.
For example, a significance level of 5% means there is at most a 5% chance that your results claim a pattern that is actually due to chance.