Biol215 Final Review
1/27
There's no tags or description
Looks like no tags are added yet.
Name | Mastery | Learn | Test | Matching | Spaced | Call with Kai |
|---|
No analytics yet
Send a link to your students to track their progress
28 Terms
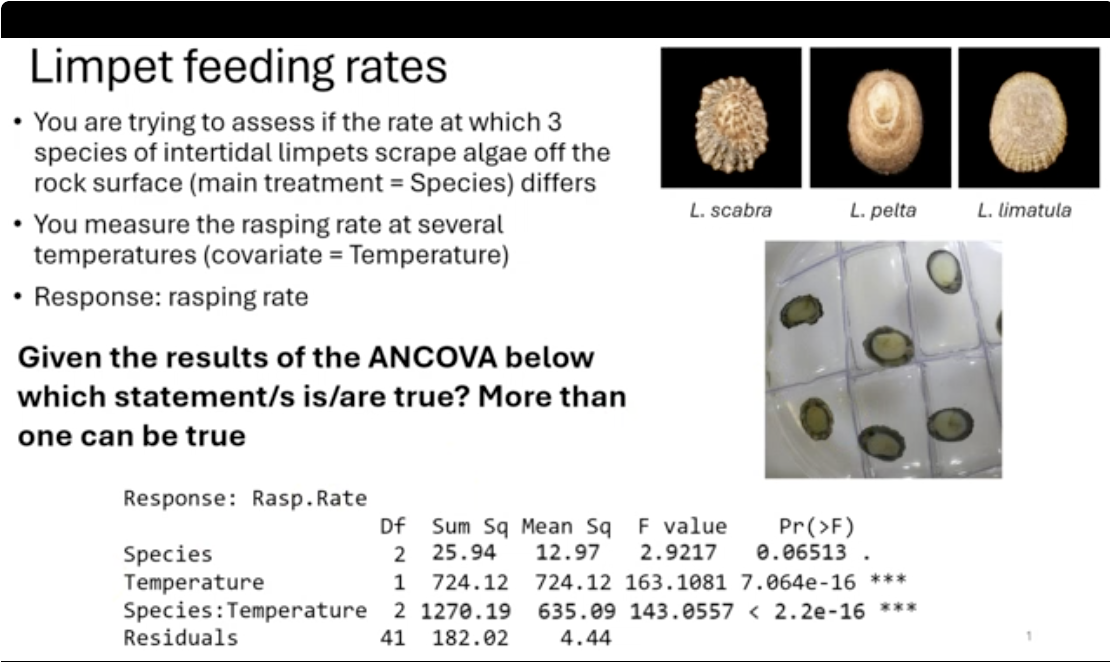
Null hypothesis (ANCOVA) is that all the group means of the treatment (Species) are the same, once you take the covariate (Temperature) into account
The interaction between Species and Temperature is NOT significant for a p=0.05. This indicates that the slopes for each species vs. temperature are homogeneous
Based on the output you cannot use ANCOVA
Based on the results you do not know which Species differ from each other in their rasping rate using a p=0.05
Null hypothesis (ANCOVA) is that all the group means of the treatment (Species) are the same, once you take the covariate (Temperature) into account
Based on the output you cannot use ANCOVA
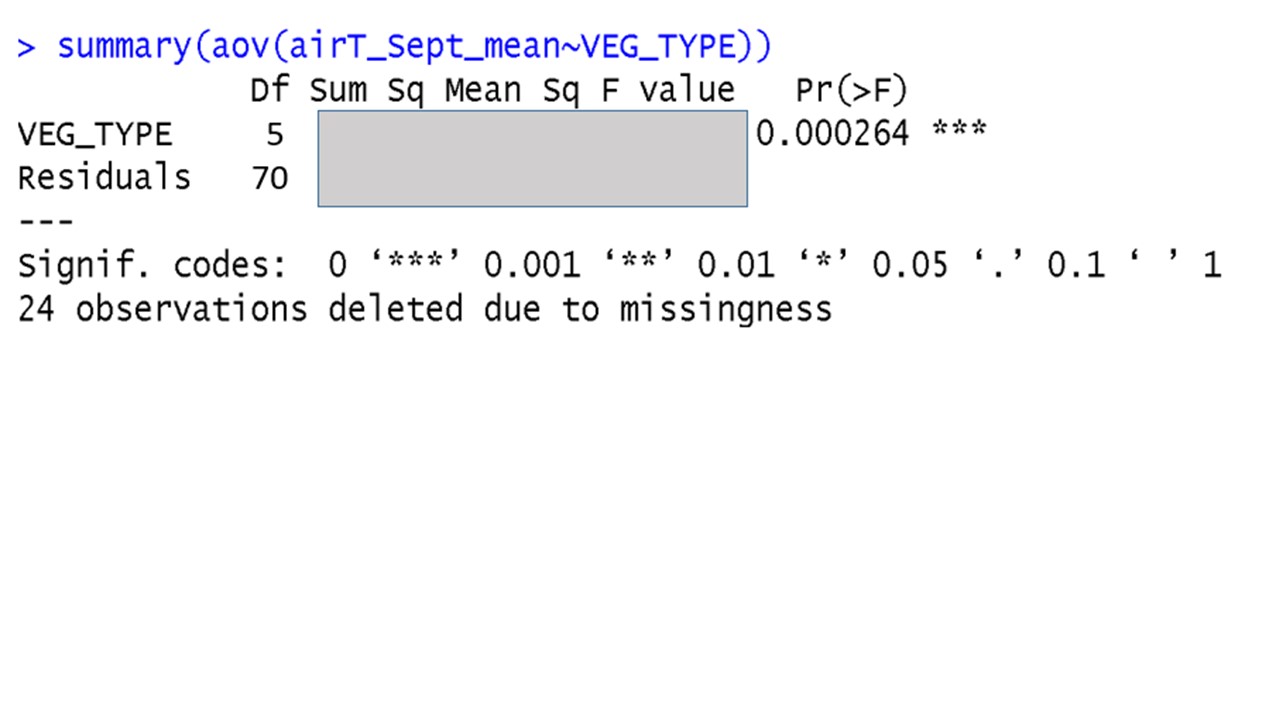
A scientist is investigating if the mean air temperature (airT_Sept_mean) is different between different vegetation types (VEG_TYPE). Given the output of the ANOVA below, and a significance level of 0.1, which is/are true (more than one can be true)?
The sample size used for this analysis (i.e. the total number of points across all the groups) is 76
There are 6 vegetation types (VEG_TYPE) in the dataset
The mean air temperature varies depending on the vegetation type
There are 5 vegetation types (VEG_TYPE) in the dataset
The sample size used for this analysis (i.e. the total number of points across all the groups) is 76
There are 6 vegetation types (VEG_TYPE) in the dataset
The mean air temperature varies depending on the vegetation type
We need to assess if growth (quantitative variable) is different in three different varieties of tomato (categorical variable: Mortgage Lifter, Roma, Cherry). Temperature could affect the growth of the tomatoes so you growth the three varieties at a stable temperature in a greenhouse, which is/are true? More than one can be true.
You should use an ANOVA for this experiment
You should use an ANCOVA for this experiment and include temperature as covariate
Temperature can be a confounding effect in this experiment
Temperature is not a confounding effect in this experiment
You should use an ANOVA for this experiment
Temperature is not a confounding effect in this experiment

A scientist is investigating if the mean air temperature (airT_Sept_mean) is different among different vegetation types (VEG_TYPE). Given the output of the ANOVA below, and a significance level of 0.05, which is/are true (more than one can be true)?
We need to run a post-hoc test to know which sites have significantly different temperature
The temperature data need to be normally distributed in all the vegetation types
The temperature data need to have equal variance in all the vegetation types
The degrees of freedom of the model are 6
We need to run a post-hoc test to know which sites have significantly different temperature
The temperature data need to be normally distributed in all the vegetation types
The temperature data need to have equal variance in all the vegetation types
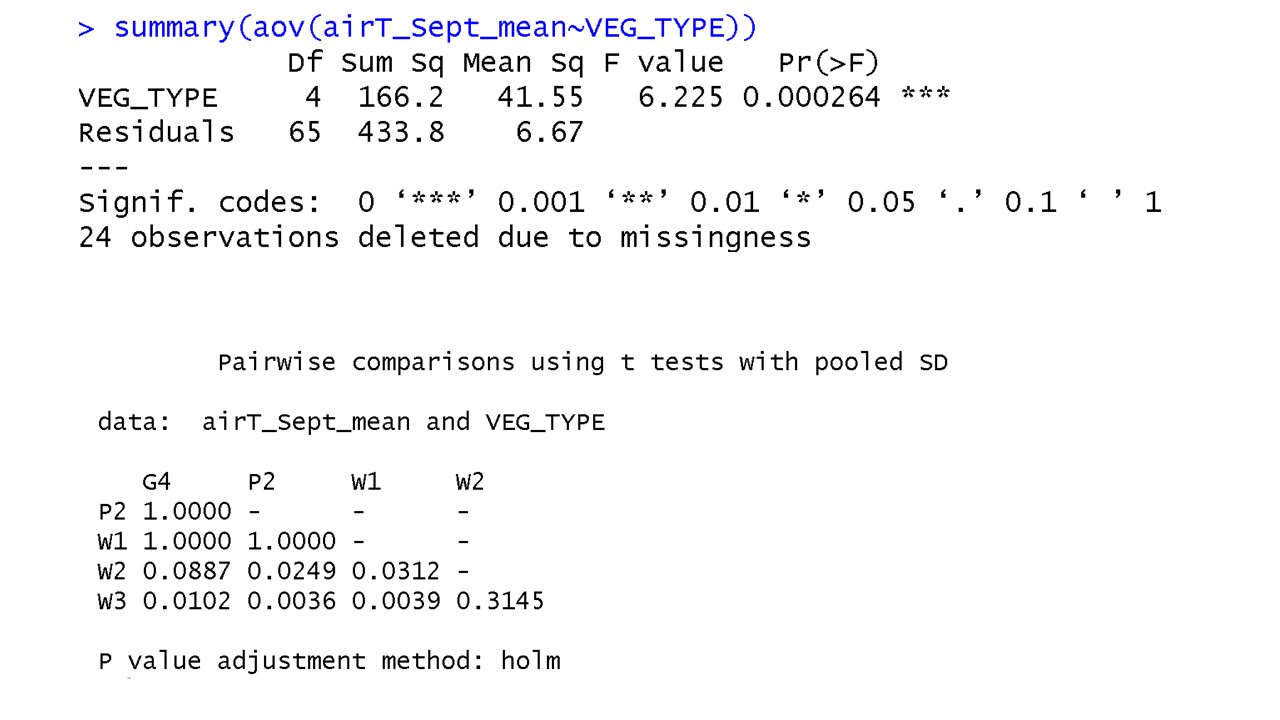
A scientist is investigating if the mean air temperature (airT_Sept_mean) is different among different vegetation types (VEG_TYPE). Given the output of the ANOVA and the output of the post-hoc pairwise comparison below (including the vegetation types indicated as: G4, P2, W1, W2, W3), and given a significance level of 0.1, which is/are true (more than one can be true)?
The mean air temperature in September (airT_Sept_mean) differs between vegetation type P2 and W2
The mean air temperature in September (airT_Sept_mean) differs among all of the vegetation types
The mean air temperature in September (airT_Sept_mean) differs between vegetation type G4 and W2
The mean air temperature in September (airT_Sept_mean) does not differ between vegetation type W1 and W3
The mean air temperature in September (airT_Sept_mean) differs between vegetation type P2 and W2
The mean air temperature in September (airT_Sept_mean) differs between vegetation type G4 and W2
We need to assess if growth (quantitative variable) is different in three different varieties of tomato (categorical variable: Mortgage Lifter, Roma, Cherry). Temperature affects the growth of the tomatoes; given that temperature increases during the summer when you are performing your experiment, which is/are true? More than one can be true.
You should use an ANOVA for this experiment and not consider temperature
You should use an ANCOVA for this experiment and include temperature as covariate
The average temperature should not be significantly different across the three different varieties of tomatoes
If you do not include temperature in your model, it can confound your experiment
You should use an ANCOVA for this experiment and include temperature as covariate
The average temperature should not be significantly different across the three different varieties of tomatoes
If you do not include temperature in your model, it can confound your experiment
Given the output of an ANCOVA analysis below, testing if there is a difference in the mean plant productivity measured by different instruments (open, closed, enclosed) considering the growing degree days (GDD, quantitative variable) which can affect plant productivity, and a significance level of 0.05, which is/are true (more than one can be correct)?
Plant productivity should have equal variance in the different INSTRUMENT groups
The null hypothesis of the ANCOVA is that plant productivity does not differ when using different instruments once you take GDD into account
The null hypothesis for covariate is that GDD has no effect on the response variable (Plant productivity)
GDD should not be significantly different in the different INSTRUMENT groups
You need to test if smoking affects children academic performance (quantitative variable), for this experiment you select 30 mothers that did not smoke during pregnancy, 30 that smoked 2 cigarette a day, and 30 that smoked 5 cigarettes a day (smoking: categorical variable with three levels), and measure the mean academic performance of their children in first grade. Mother educational level can also affect children’s academic performance, so you account for the mother’s educational level (quantitative variable). Which test should you use? Only one.
Chi-square
ANOVA
ANCOVA including mother’s educational level as covariate
t-test
ANCOVA including mother’s educational level as covariate
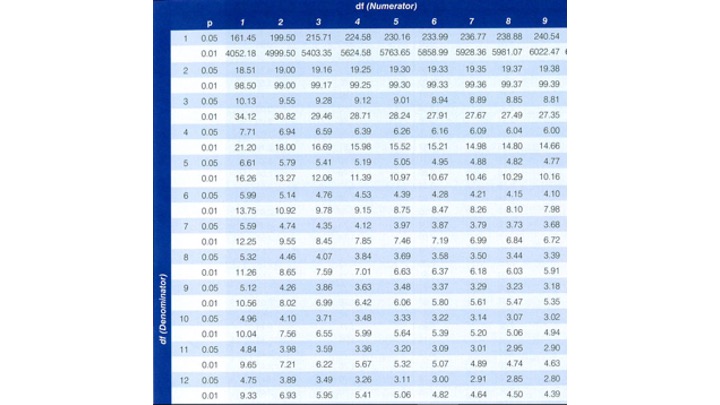
A doctor is investigating if different doses of aspirin (placebo, low dose, medium dose, high dose) affect the body temperature of a total 12 patients (divided into the four groups: 3 patients in each of the groups subjected to different aspirin doses). If the Mean Sums of Squares of the Model = 20, and the Mean Sums of Squares of the Residuals = 289, given the table below, which is/are true (more than one can be true)?
The critical F for a significance level 0.05 is 3.26
The mean body temperature of the patients differs among all different doses of aspirin with a p=0.05
The null hypothesis is that the mean body temperature of the patients does not differ among all different doses of aspirin
The critical F for a significance level 0.05 is 4.07
The null hypothesis is that the mean body temperature of the patients does not differ among all different doses of aspirin
The critical F for a significance level 0.05 is 4.07
You need to test if smoking affects children academic performance, for this experiment you select 30 mothers that smoked during pregnancy and 30 that did not (categorical variable with two levels), and measure the mean academic performance of their children in first grade. Mother educational level (quantitative variable) can also affect the children’s academic performance. Which is/are true? More than one can be true.
Mothers’ educational level can be a confounding factor for this experiment
The mother educational level should be significantly different between the mothers that smoked and not smoked
Mothers’ educational level would not be a confounding factor if you selected mothers with the same educational level
Mothers’ educational level is not a confounding factor for this experiment
Mothers’ educational level can be a confounding factor for this experiment
Mothers’ educational level would not be a confounding factor if you selected mothers with the same educational level
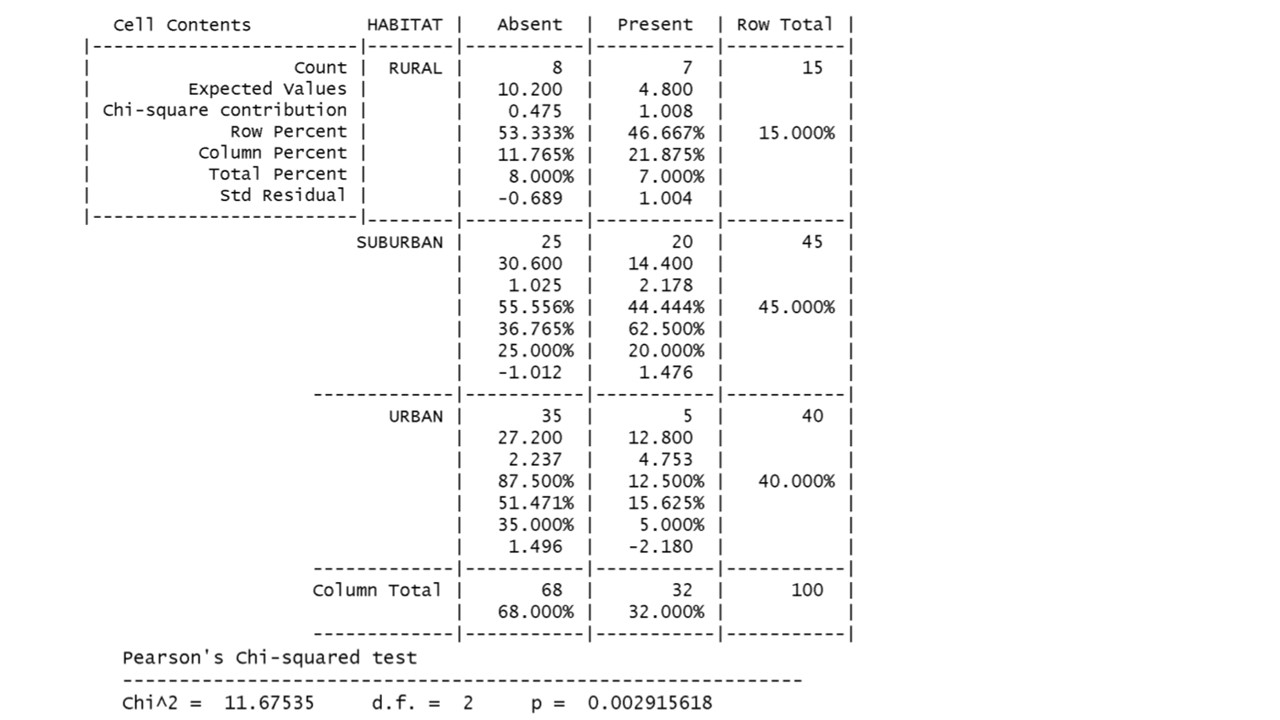
Given the output of the Chi-square below, which is testing if the presence of bobcat (variable with two levels: Absent, Present) is associated with Habitat (variable with three levels: Rural, Suburban, Urban), given a significance level of 0.05, which is/are true (more than one can be true)?
Habitat type is associated with the presence or absence of bobcats
In rural habitats there are significantly different number of bobcats present than expected
In urban habitats there are significantly different number of bobcats present than expected
The presence of bobcat (Present, Absent) and Habitat type (Rural, Suburban, and Urban) are both categorical variables
Habitat type is associated with the presence or absence of bobcats
In urban habitats there are significantly different number of bobcats present than expected
The presence of bobcat (Present, Absent) and Habitat type (Rural, Suburban, and Urban) are both categorical variables
You need to assess if the bacteria growth is different on spicy red salsa, spicy green salsa, and non-spicy salsa left outside of the fridge for 24 hours given that the ambient air temperature affects the bacterial growth. Given the experimental design which is/are true (more than one can be true)?
If possible, you should use an ANCOVA to test the significance in the difference in the bacterial growth in the different salsa groups controlling for ambient air temperature
To be able to use an ANCOVA the samples should be independent
If possible, you should use a t-test to test the significance in the difference in the bacterial growth in the different salsa groups
You should run an ANOVA to test if ambient air temperature is significantly different in the different salsa groups before running the rest of your analysis
If possible, you should use an ANCOVA to test the significance in the difference in the bacterial growth in the different salsa groups controlling for ambient air temperature
To be able to use an ANCOVA the samples should be independent
You should run an ANOVA to test if ambient air temperature is significantly different in the different salsa groups before running the rest of your analysis
An experiment is trying to test if there is an association between smoking (a categorical variable with three levels: never smoked, currently smoking, smoked but stopped for more than 5 years) and lung cancer (a categorical variable with two levels: cancer, no cancer). Which is/are true about this experiment (more than one can be true)?
The expected frequencies in the contingency table for this test should be greater than 1 in all the cells
The null hypothesis is that lung cancer is associated with smoking
A chi-square test should be used for this experiment
The degrees of freedom of this test are 2
The expected frequencies in the contingency table for this test should be greater than 1 in all the cells
A chi-square test should be used for this experiment
The degrees of freedom of this test are 2
An experiment is trying to test if there is an association between smoking (a categorical variable with two levels: smoking, not smoking) and lung cancer (a categorical variable with two levels: cancer, no cancer). If you reject the null hypothesis, which is/are the alternative hypothesis/es (more than one can be true)?
Lung cancer depends on smoking
The frequency of lung cancer is not associated with smoking
The frequency of lung cancer is the same in smokers and non-smokers
Lung cancer is contingent on smoking
Lung cancer depends on smoking
Lung cancer is contingent on smoking
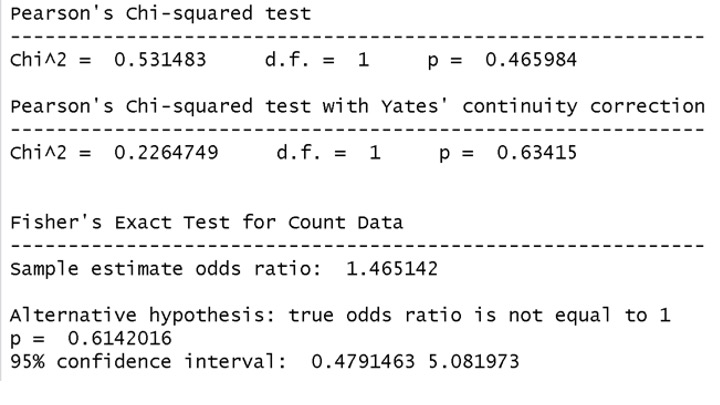
An experiment is trying to test if there is an association between smoking (a categorical variable with two levels: smoking, not smoking) and lung cancer (a categorical variable with two levels: cancer, no cancer). Given the output of the Chi-square test below, and a significance level of 0.1, which is/are true (more than one can be correct)?
The frequency of lung cancer is different between smokers and non-smokers
Lung cancer is not contingent on smoking
The alternative hypothesis is that the frequency of lung cancer is different between smokers and non-smokers
Lung cancer is independent of smoking
Lung cancer is not contingent on smoking
The alternative hypothesis is that the frequency of lung cancer is different between smokers and non-smokers
Lung cancer is independent of smoking
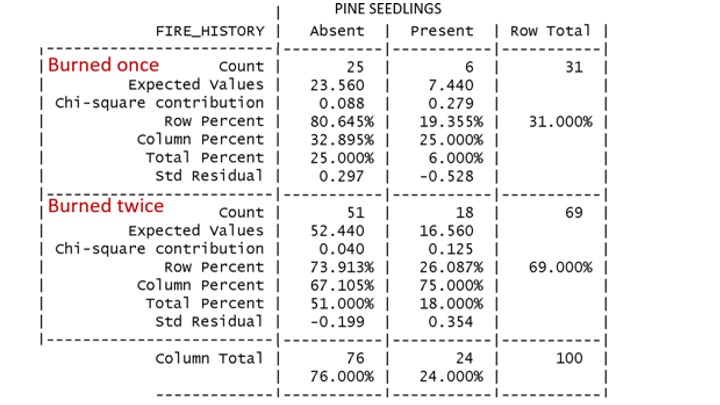
An experiment is trying to test if there is an association between fire history (a categorical variable with two levels: burned once, burned twice) and pine seedling presence (a categorical variable with two levels: absent, present). Given the output of the CrossTable() of the Chi-square test below, which is/are true (more than one can be correct)?
The alternative hypothesis is that if there is no association between fire history and pine seedling presence
In the burned twice sites as many pine seedlings as expected were present (THERE IS NO SIGNIFICANT EFFECT of burned twice on pine seedlings presence)
The null hypothesis is that if there is no association between fire history and pine seedling presence
In the burned once sites as many pine seedlings as expected were present (THERE IS NO SIGNIFICANT EFFECT of burned once on pine seedlings presence)
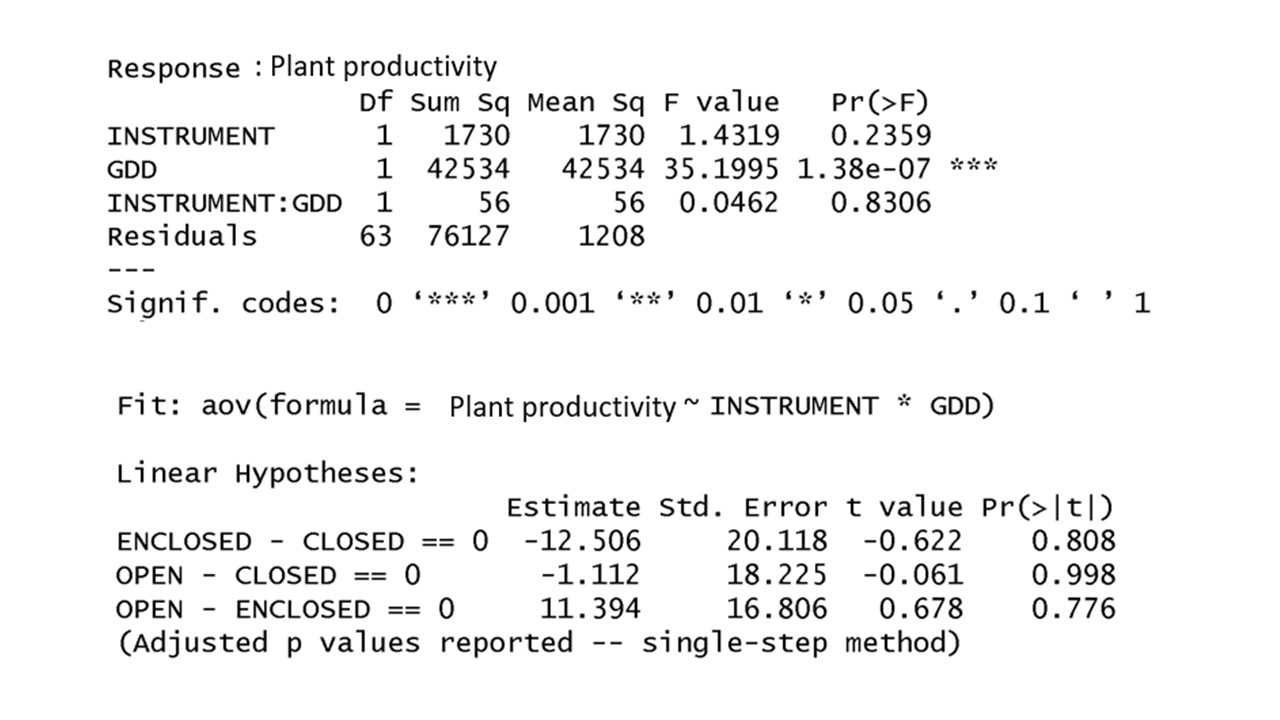
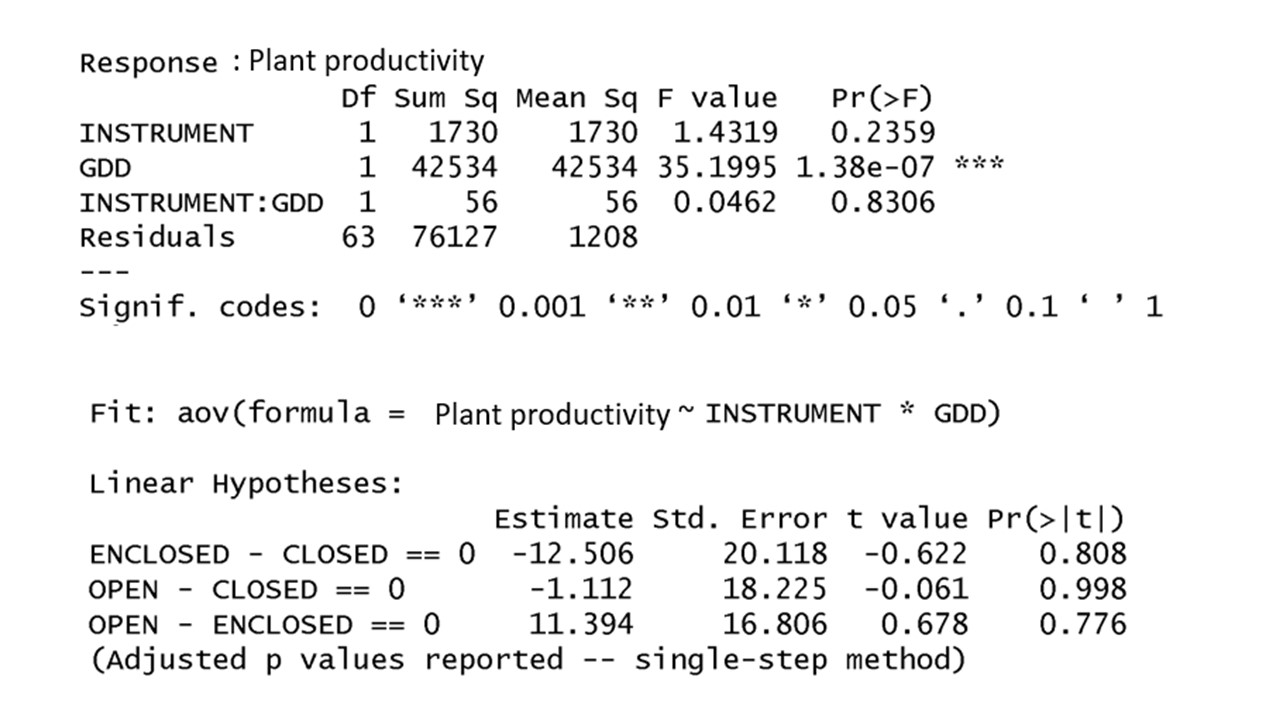
Given the output of an ANCOVA analysis below, testing if there is a difference in the plant productivity measured by different instruments (open, closed, enclosed) considering that temperature (growing degree days, GDD) might affect the reading of the instruments, given a significance level of 0.05, which is/are true (more than one can be correct)?
Plant productivity is significantly different among some/all of the instruments
GDD is significantly affecting the plant productivity differently in different instruments
Plant productivity measured in enclosed and open instruments is significantly different
GDD is significantly affecting plant productivity
GDD is significantly affecting plant productivity
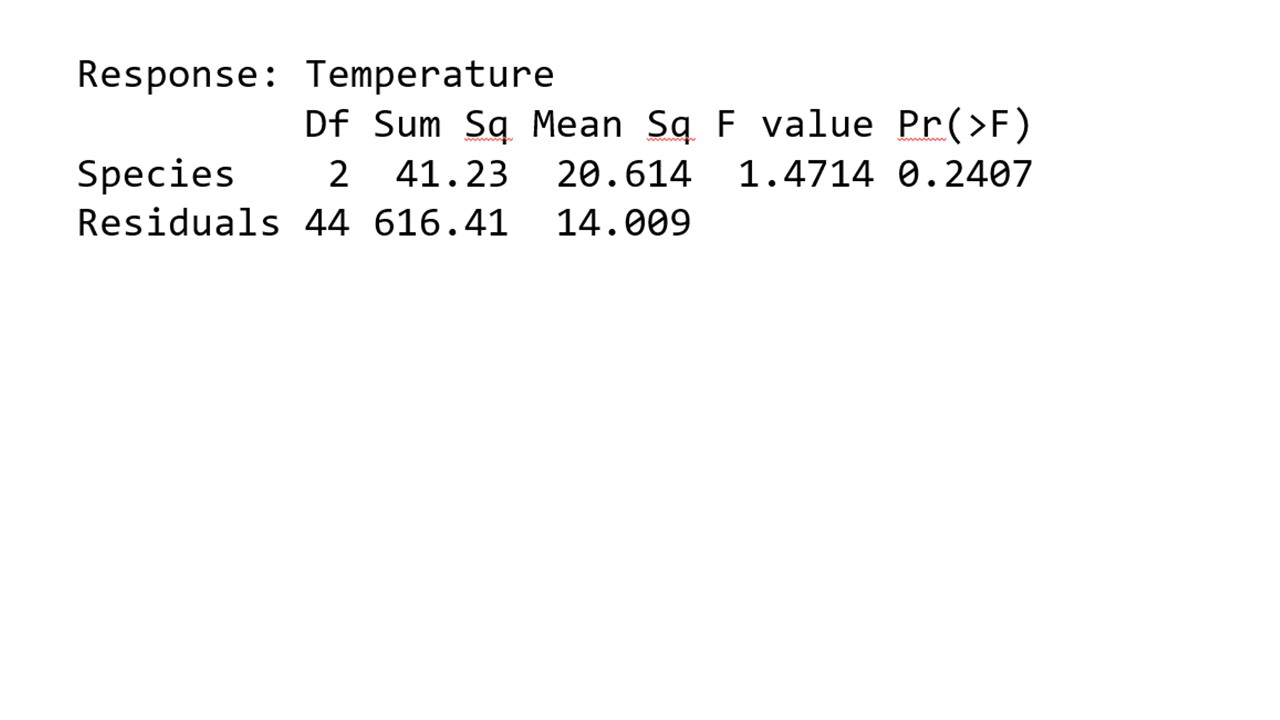
An experiment is testing if rasping rate differs among different species, given that air temperature is a covariate for this analysis. Given the output of an ANOVA testing if the covariate (temperature) differs among the levels of the categorical predictor variable (Species), and a significance level of 0.05, which is/are true (more than one can be true)?
Null hypothesis of the (ANOVA) is that all the group means of the covariate are the same across the different Species
Given this ANOVA output you can run the ANCOVA including temperature as covariate in the model
The alternative hypothesis of the ANOVA is that the group means of the covariate is different across all the different Species
Given this ANOVA output temperature does not affect rasping rate
Null hypothesis of the (ANOVA) is that all the group means of the covariate are the same across the different Species
Given this ANOVA output you can run the ANCOVA including temperature as covariate in the model

An analyst needs to assess if the frequency of people voting for Trump is different between the 2016 and the 2020 election. Given the dataset below, what test should he use (only one)?
ANCOVA
Dependent t-test
ANOVA
Chi-square
Chi-Square
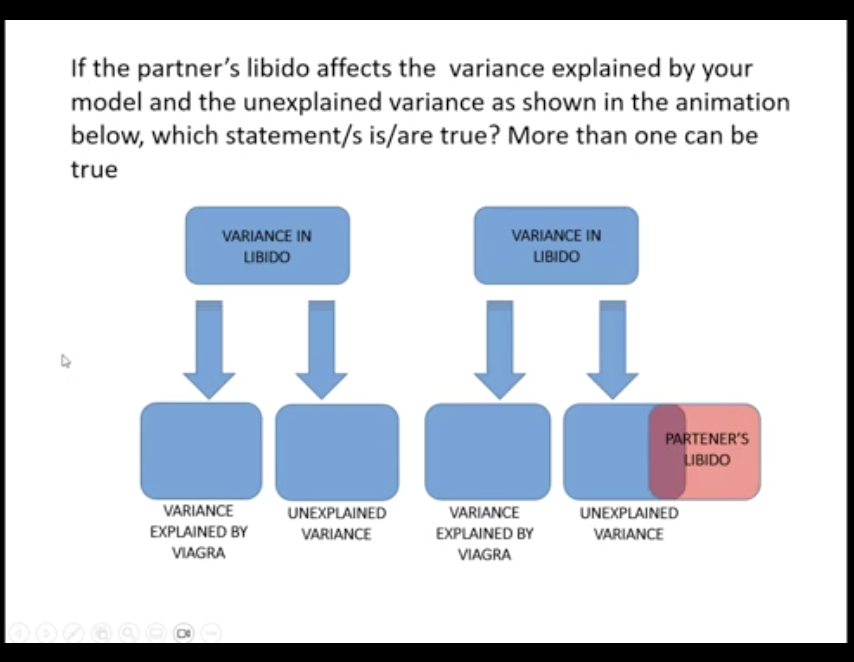
The partner's libido reduces the error variance
Partner's libido overlaps with the experimental effect (effect of the covariate is confounded with the experimental effect & reduces the experimental effect)
The partner's libido decrease the error of the model
You cannot use ANCOVA
The partner's libido reduces the error variance
The partner's libido decrease the error of the model
You are trying to asses if the frequency of people voting for Trump was different in the 2016 and 2020 election. Unfortunately, you lost some data and the expected frequencies changed. Given this change, what is/are true?
The Null Hypothesis is that two variables are not contingent
After you lost the data you are violating the assumptions of the CHI-square but you were not violating the assumption before loosing the data
You are violating the assumptions of the CHI-square before and after loosing the data
The Null Hypothesis is that the proportions of people voting for Trump are equal in the 2016 and 2020 elections
The Null Hypothesis is that two variables are not contingent
You are violating the assumptions of the CHI-square before and after loosing the data
The Null Hypothesis is that the proportions of people voting for Trump are equal in the 2016 and 2020 elections
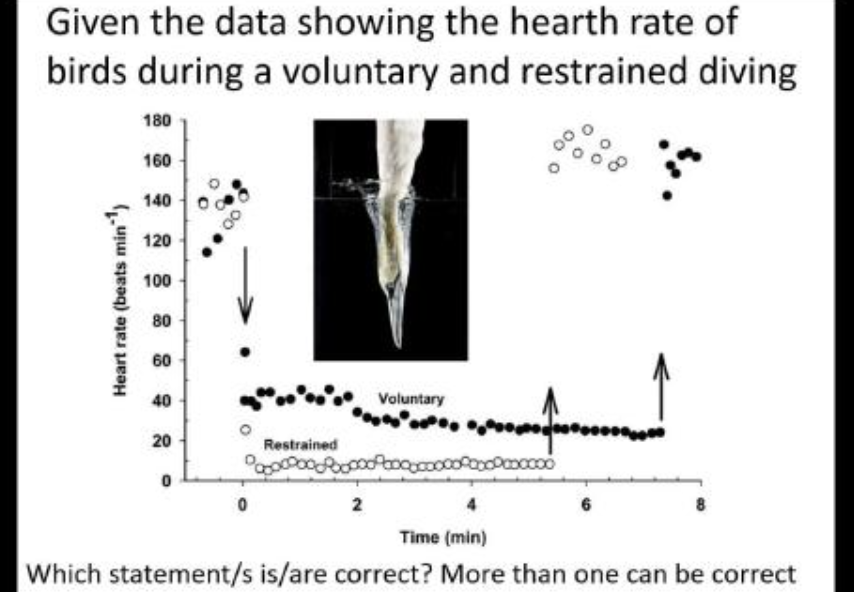
When birds are allowed to freely dive, their heart rate drops less than if they are restrained, presumably they are less concerned about saving oxygen if they are free to return to the surface whenever they like.
If the birds are freely diving their heart rate is lower then if they are restrained
The graphs shows that the heart rate recovers similarly in the voluntary and restrained bird after they return to the surface
Restraining birds under water might create an artifact in the experiment
When birds are allowed to freely dive, their heart rate drops less than if they are restrained, presumably they are less concerned about saving oxygen if they are free to return to the surface whenever they like.
The graphs shows that the heart rate recovers similarly in the voluntary and restrained bird after they return to the surface
Restraining birds under water might create an artifact in the experiment
You are testing the impact of sunlight on plant growth of two species and decide to modify the location of the samples of the two species inside your growth chamber as shown in the animation (alternated to in the same row). Given this change, which statement(s) is/are correct?
This change will help you reduce artifacts as your growth chamber light level might be different in different areas
If you want to reduce the artifacts you should not change the position of your samples as indicated in the animation
Changing positions of the two species in the greenhouse can help you reduce experimental artifacts
After the change your two treatments have equal (random) chance of experiencing any small-scale environmental variation or other potential biases.
If you want to reduce the artifacts you should not change the position of your samples as indicated in the animation
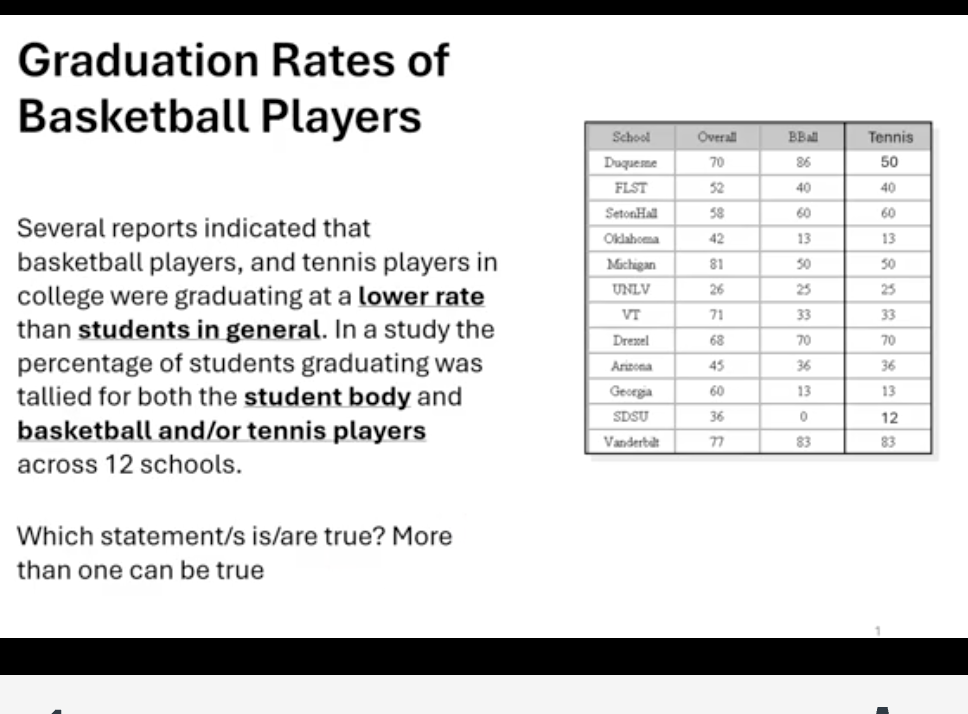
The null hypothesis is that the graduation rates in the 3 groups is the same
If you are testing if the graduation rates is lower in the basketball and/or tennis players group than in the overall student body you should use an ANOVA
To be able to use an independent t-test or ANOVA, observations within groups should have a normal distribution
If you are testing if the graduation rates is lower in the basketball and/or tennis players groups than in the overall student body you should use an independent t-test
The null hypothesis is that the graduation rates in the 3 groups is the same
If you are testing if the graduation rates is lower in the basketball and/or tennis players group than in the overall student body you should use an ANOVA
To be able to use an independent t-test or ANOVA, observations within groups should have a normal distribution
Experiement of “Can cats be trained to line dance?”. Initial experiment data is all categorical, and the second experiment data has categorical and quantitative.
To test if the cats dance longer with food than affection as reward (when you record the time they dance in min) you should use a Chi-square
The dataset including the time the cat dance (in minutes) has only categorial data
Your initial dataset (when you record only if the cats dance: Yes, or No) has only categorial data
To test if the cats dance longer with food than affection as reward (when you record the time they dance in min) you should use a regression
Your initial dataset (when you record only if the cats dance: Yes, or No) has only categorial data
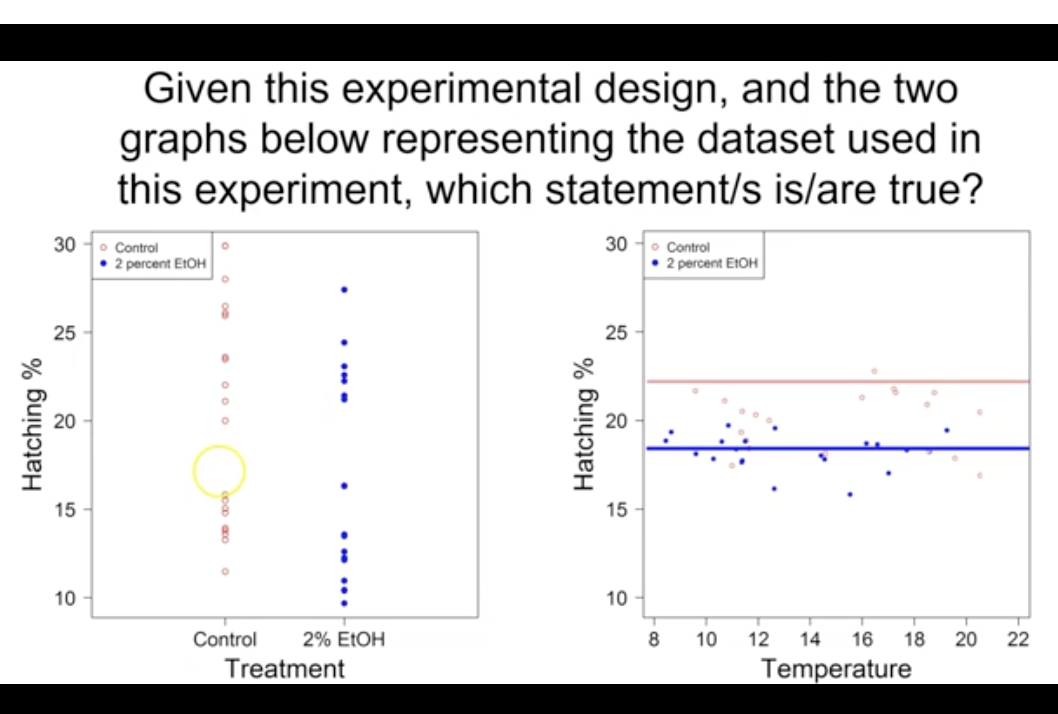
Rising temperature affects hatching rate, so temperature is a covariate that affects the response variable (hatching rate)
Based on the right scatterplot temperature seems to be affecting hatching rate, and should be included as covariate in your ANCOVA model
Temperature had no effect on the Hatching rate, so you can use an ANOVA
All eggs were laid at the same temperature, so you should use ANOVA (or t-test given you have only two groups) to test of the hatching rate is different between the two alcohol treatment (control and 2% alcohol)
Temperature had no effect on the Hatching rate, so you can use an ANOVA
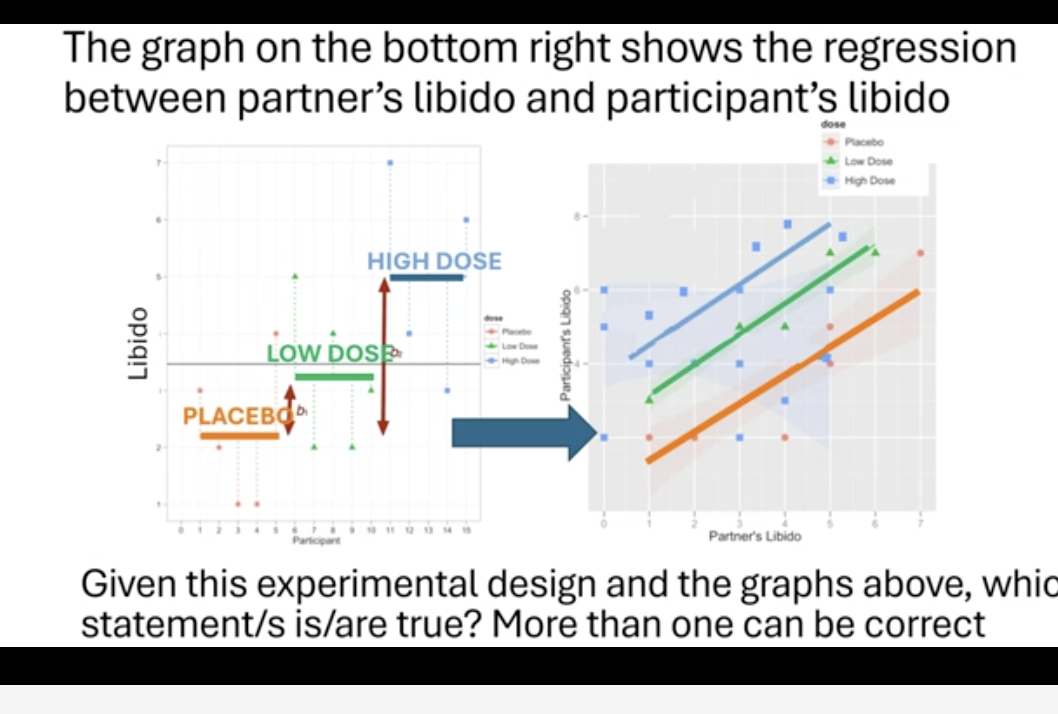
You cannot use ANCOVA because you violate one of the assumptions (Homogeneity of the regression slopes)
You cannot use ANCOVA because the slope of the covariate (partner’s libido, quantitative variable) is different in different groups
You should check if the slope for the relationship between the covariate (partner’s libido) and the response variable (participant’s libido) is different in different groups by looking at the significance in the interaction terms between partner’s libido and participant’s libido
You should use a regression to test if participant’s libido differs among the three groups (placebo, low dose, high dose)
You should check if the slope for the relationship between the covariate (partner’s libido) and the response variable (participant’s libido) is different in different groups by looking at the significance in the interaction terms between partner’s libido and participant’s libido
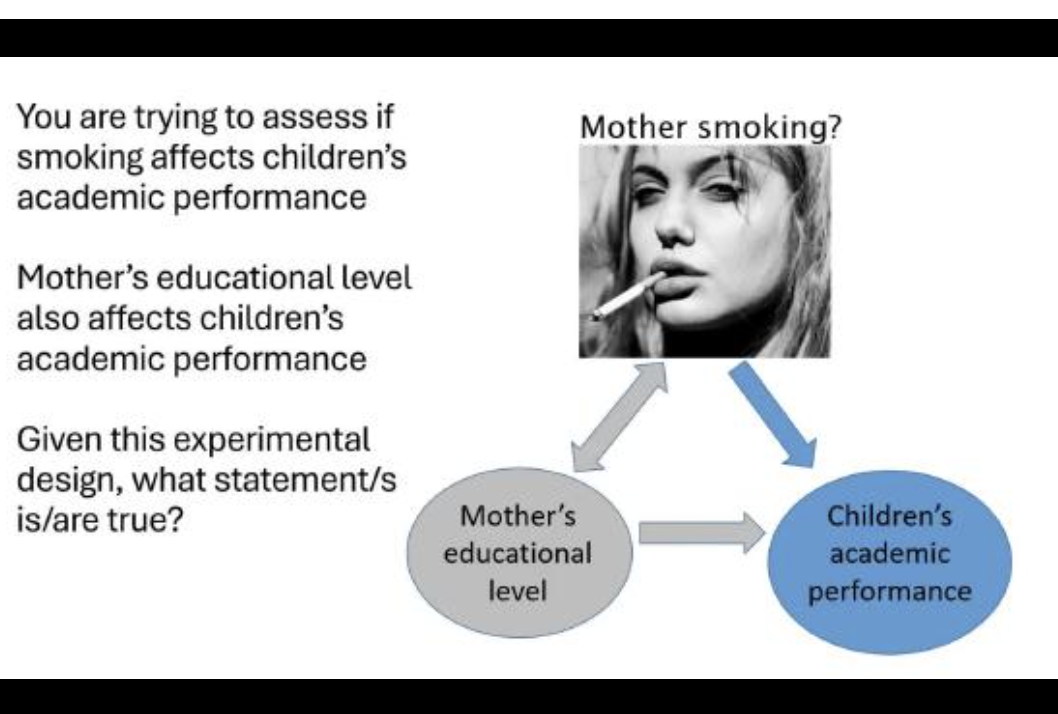
This can only be an observational experiment for ethical considerations
Children’s academic performance is the dependent (response variable or outcome)
Mother’s education level is a confounding variable if you do not consider it in your model
Mother’s smoking is the independent variable (predictor)
This can only be an observational experiment for ethical considerations
Children’s academic performance is the dependent (response variable or outcome)
Mother’s education level is a confounding variable if you do not consider it in your model
Mother’s smoking is the independent variable (predictor)