Quantitative Traits (Part 1)
1/27
There's no tags or description
Looks like no tags are added yet.
Name | Mastery | Learn | Test | Matching | Spaced | Call with Kai |
|---|
No analytics yet
Send a link to your students to track their progress
28 Terms
Quantitative traits are what the trait looks like in a ___________ (a smooth range
population (describes phenotype pattern)
Polygenic is how many ______ control the trait
genes (describes genetic cause)
Multifactorial traits are traits shaped by a combination of multiple genes and _____________ influences working together
environmental
Quantitative Patterns are inheritance patterns where a trait shows a smooth, __________ range of phenotypes
continuous (contributing small additive effects)
Multiple-gene hypothesis is the explanation for _____ that smooth range happens in quantitative traits
why (because each gene adds a small amount)
Discontinuous traits are traits with only a few clear ________ and no in between traits
categories (ex- blood type: A,B,AB,O)
Continuous Traits are traits that ____ every possible value in a smooth range
show
Phenotypic variation is a the natural __________ in physical traits among individuals
differences
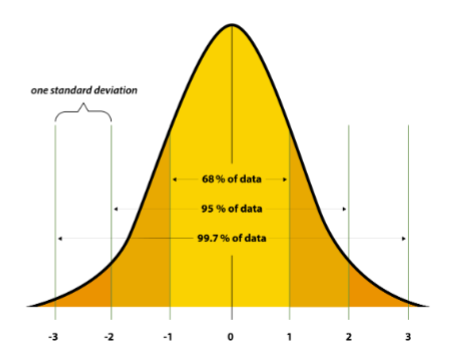
Normal Distribution is a ____ shaped curve where most values cluster around the ________ and fewer appear at the extremes
bell; average
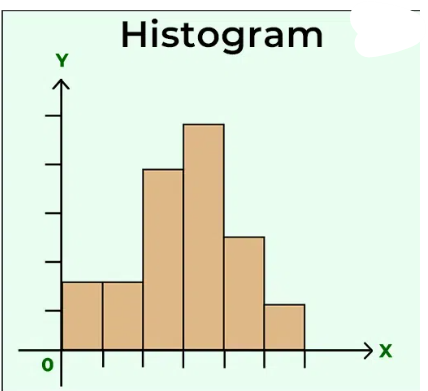
Histogram is a graph that shows how ______ different ranges of values appear in dataset
often
Measurements of Average
Mode
Median
Mean
Mode is the value that appears the most _____ in a dataset
often (2,3,4,4,5,4,7)
Median is the _______ value in a dataset (smallest—largest)
middle (3, 5, 8)
Mean is the _______ of a dataset
average (add values—divide by values)
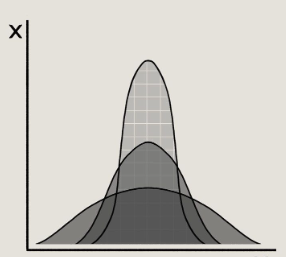
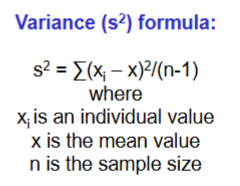
Variance measures how ______ out the values in a dataset are
spread (look at how far each value is from the mean)
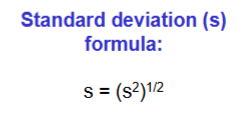
Standard Deviation shows how much the values in a dataset ______ from the mean
differ
Small Standard Deviation the data points are _____ together
close
Large Standard Deviation the data points are _______ out
spread
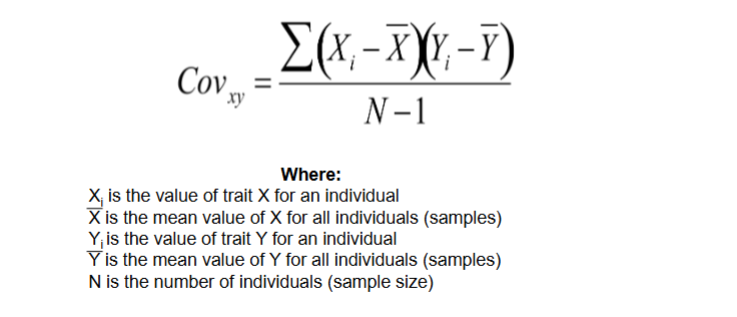
Covariance measures how two variables _______ together
change (whether they move in the same direction or in opposite directions)
Positive Covariance is when both variables tend to _______ together
increase
Negative Covariance is when one increases while one __________
decrease
Correlation coefficient __ measures the strength and direction of the linear relationship between two variables
r
Quantitative Traits are either ____________ or ______________
polygenic; multifactorial
Additive allele ________ equally to the phenotype
contributes
Nonadditive allele _________ contribute to the phenotype
doesn’t
Polygenic Inheritance is when a trait in controlled by several genes, each _______ a small amount to the phenotype
adding (adding small doses of a gene to the trait)
Phenotypic Variance is the total amount of variation in a trait within a population which includes:
Genetic Differences
Environment Differences
Interactions (between genes and environment)
Hereditability tells ___ much of the variation you see in a trait due to genes, not environment
how