MF Unit 2- Evaluation of Microfinance institutions
1/24
There's no tags or description
Looks like no tags are added yet.
Name | Mastery | Learn | Test | Matching | Spaced | Call with Kai |
|---|
No analytics yet
Send a link to your students to track their progress
25 Terms
What is Operational Risk in MFIs?
Operational risk is the risk of loss due to failed internal processes, people, systems, or external events such as natural disasters or fire. It arises from technology dependence, weak systems, low ethics, and competition.
Operational risk is “the risk of direct or indirect loss resulting from inadequate or failed internal processes, people and systems, or from external events.”
types of operational risk:-
Human risk- errors, frauds ,collusions, animosity
Process risk- lack of clear procedure on operations such as disbursements, day to day matters, accounting, data recording and reporting, cash handling, auditing
System & technology risk- failure of softwares, computers, power failures
Asset loss & operational failure due to external events- loss of property and other assets or loss of work due to natural disasters, fires, robberies, thefts, riots etc
Relationship risk- client dissatisfaction, drop outs loss to competition, poor products
What are the five categories of operational risk
Human risk- errors, frauds ,collusions, animosity
Process risk- lack of clear procedure on operations such as disbursements, day to day matters, accounting, data recording and reporting, cash handling, auditing
System & technology risk- failure of softwares, computers, power failures
Asset loss & operational failure due to external events- loss of property and other assets or loss of work due to natural disasters, fires, robberies, thefts, riots etc
Relationship risk- client dissatisfaction, drop outs loss to competition, poor products
How can MFIs prevent operational risk?
Daily backups of MIS data stored in two different locations or with two separate person.
Daily reconciliation of accounts & portfolio
Strong monitoring & internal audit systems to check frauds
Disaster procedures for riots/natural calamities-Standard operating procedures should be prepared for natural disasters and riots. Staff should know exactly what needs to be done in such situations.
Alternative office locations for emergencies
Fireproof storage for important documents- Fire extinguishers can be made available in all offices. important documents such as loan files post dated cheques etc. , can be stored in fireproof cupboards.
What is internal audit
internal audit is an independent check on the performance of the MFI. Independence is ensured by having completely separate staff team and the department reporting directly to the to the Board of directors or to the organisation’s head.
The idea behind the internal audit is not just to catch frauds or malpractices but more constructive that is to add value and efficiency within the organisation by meeting getting the possibilities of malpractices.
Internal audit is done by a specialised internal audit team who should be very well versed with the organisation policies and procedures.
FUNCTIONS
To detect any product or misappropriation irrespective of its size, magnitude or the staff involved in it.
To detect any malpractice, Collusion for action on part of employees that is against the organisational policies /cultureTo see if the operational policies/ procedures
To check an article staff behaviour
To check the accuracy of reports,MIS and accounting, accuracy of records
To provide feedback/ opinion related to operational risk such as staff dissatisfaction, competition, in appropriate policies aur areas of potential conflict.
What is the scope of audit?
Financial reports
Loan documents
MIS reports
Client visits
Other observations
What is impact and impact assessment?
Impact is the change directly attributable to microfinance programmes.
Impact assessment is research to measure how microfinance has improved lives of target clients.
Impact Assessment (IA) in microfinance is the systematic process of measuring the effect that financial services (credit, savings, insurance) have on the lives of the poor and their communities. Unlike financial audits that look at "repayment rates," impact assessment focuses on the social and economic changes—positive or negative—that can be attributed to the intervention.
GOALS
Accountability: To prove to donors, investors, and regulators that the institution is fulfilling its social mission.
Operational Improvement: To understand which products (e.g., crop insurance vs. livestock loans) work best for clients.
Risk Management: To identify unintended negative consequences, such as over-indebtedness or increased domestic stress.
LEVELS
Individual level: savings, confidence, self-esteem
Household level: food security, income, assets, education
Enterprise level: income, cash flow, business growth
Community level: contribution to society, change in social attitudes
WHO USES
a) Policymakers
b) Donors
c) Researchers
d) MFIs
What are the levels and indicators of impact assessment?
Individual level: savings, confidence, self-esteem
Household level: food security, income, assets, education
Community level: contribution to society, change in social attitudes
Enterprise level: income, cash flow, business growth
Who uses impact assessment?
a) Policymakers
b) Donors
c) Researchers
d) MFIs
types of financial ratios?
1) Operating self sufficiency (OSS) ratio: operating income/financial expense+loan loss provision expense+operating expense
Operating income = interest and fees paid by borrower,income from investment or from other services.
Financial expense=it includes int and fees that the institution pays to commercial bank,shareholders and other investors.
Loan loss provision expense=it is the amount set aside to cover the cost of loans that a microfinance institution from other investors.
Operating expense=rent,salaries,travel etc
2) Financial self sufficiency (FSS) ratio: = Adjusted operating revenue/financial exp +loan loss provision exp+operating expense
+expense adjustment
Adjusted operating revenue= operating revenue-subsidy Expense adjustment = subsidies given to people.
3) Return on Asset(ROA) : net operating revenue-taxes/average assets
4) Portfolio at Risk(PAR) ratio:) PAR (30 days) = PAR (30 days)/gross loan portfolio
PAR is the value of all loans outstanding that have one or more instruments of principle overdue more than a certain number of days.This system includes an entire unpaid principle balance.
5) Yield on gross loan portfolio = cash financial revenue from loan portfolio/average gross loan portfolio
What are liquidity ratios?
A liquidity ratio is a type of financial ratio used to determine a company’s ability to pay its short-term debt obligations. The metric helps determine if a company can use its current, or liquid, assets to cover its current liabilities.
Three liquidity ratios are commonly used – the current ratio, quick ratio, and cash ratio. In each of the liquidity ratios, the current liabilities amount is placed in the denominator of the equation, and the liquid assets amount is placed in the numerator.
Given the structure of the ratio, with assets on top and liabilities on the bottom, ratios above 1.0 are sought after. A ratio of 1 means that a company can exactly pay off all its current liabilities with its current assets. A ratio of less than 1 (e.g., 0.75) would imply that a company is not able to satisfy its current liabilities.
A ratio greater than 1 (e.g., 2.0) would imply that a company is able to satisfy its current bills. In fact, a ratio of 2.0 means that a company can cover its current liabilities two times over. A ratio of 3.0 would mean they could cover their current liabilities three times over, and so forth.
Types of Liquidity Ratios
1. Current Ratio
Current Ratio = Current Assets / Current Liabilities
The current ratio is the simplest liquidity ratio to calculate and interpret. Anyone can easily find the current assets and current liabilities line items on a company’s balance sheet. Divide current assets by current liabilities, and you will arrive at the current ratio.
2. Quick Ratio
Quick Ratio = (Cash + Accounts Receivables + Marketable Securities) / Current Liabilities
The quick ratio is a stricter test of liquidity than the current ratio. Both are similar in the sense that current assets is the numerator, and current liabilities is the denominator.
However, the quick ratio only considers certain current assets. It considers more liquid assets such as cash, accounts receivables, and marketable securities. It leaves out current assets such as inventory and prepaid expenses because the two are less liquid. So, the quick ratio is more of a true test of a company’s ability to cover its short-term obligations.
3. Cash Ratio
Cash Ratio = (Cash + Marketable Securities) / Current Liabilities
The cash ratio takes the test of liquidity even further. This ratio only considers a company’s most liquid assets – cash and marketable securities. They are the assets that are most readily available to a company to pay short-term obligations.
In terms of how strict the tests of liquidity are, you can view the current ratio, quick ratio, and cash ratio as easy, medium, and hard.
what are the Importance of Liquidity Ratios?
1. Determine the ability to cover short-term obligations
Liquidity ratios are important to investors and creditors to determine if a company can cover their short-term obligations, and to what degree. A ratio of 1 is better than a ratio of less than 1, but it isn’t ideal.
Creditors and investors like to see higher liquidity ratios, such as 2 or 3. The higher the ratio is, the more likely a company is able to pay its short-term bills. A ratio of less than 1 means the company faces a negative working capital and can be experiencing a liquidity crisis.
2. Determine creditworthiness
Creditors analyze liquidity ratios when deciding whether or not they should extend credit to a company. They want to be sure that the company they lend to has the ability to pay them back. Any hint of financial instability may disqualify a company from obtaining loans.
3. Determine investment worthiness
For investors, they will analyze a company using liquidity ratios to ensure that a company is financially healthy and worthy of their investment. Working capital issues will put restraints on the rest of the business as well. A company needs to be able to pay its short-term bills with some leeway.
Low liquidity ratios raise a red flag, but “the higher, the better” is only true to a certain extent. At some point, investors will question why a company’s liquidity ratios are so high. Yes, a company with a liquidity ratio of 8.5 will be able to confidently pay its short-term bills, but investors may deem such a ratio excessive. An abnormally high ratio means the company holds a large amount of liquid assets.
For example, if a company’s cash ratio was 8.5, investors and analysts may consider that too high. The company holds too much cash on hand, which isn’t earning anything more than the interest the bank offers to hold their cash. It can be argued that the company should allocate the cash amount towards other initiatives and investments that can achieve a higher return.
With liquidity ratios, there is a balance between a company being able to safely cover their bills and improper capital allocation.
What is capital adequacy?
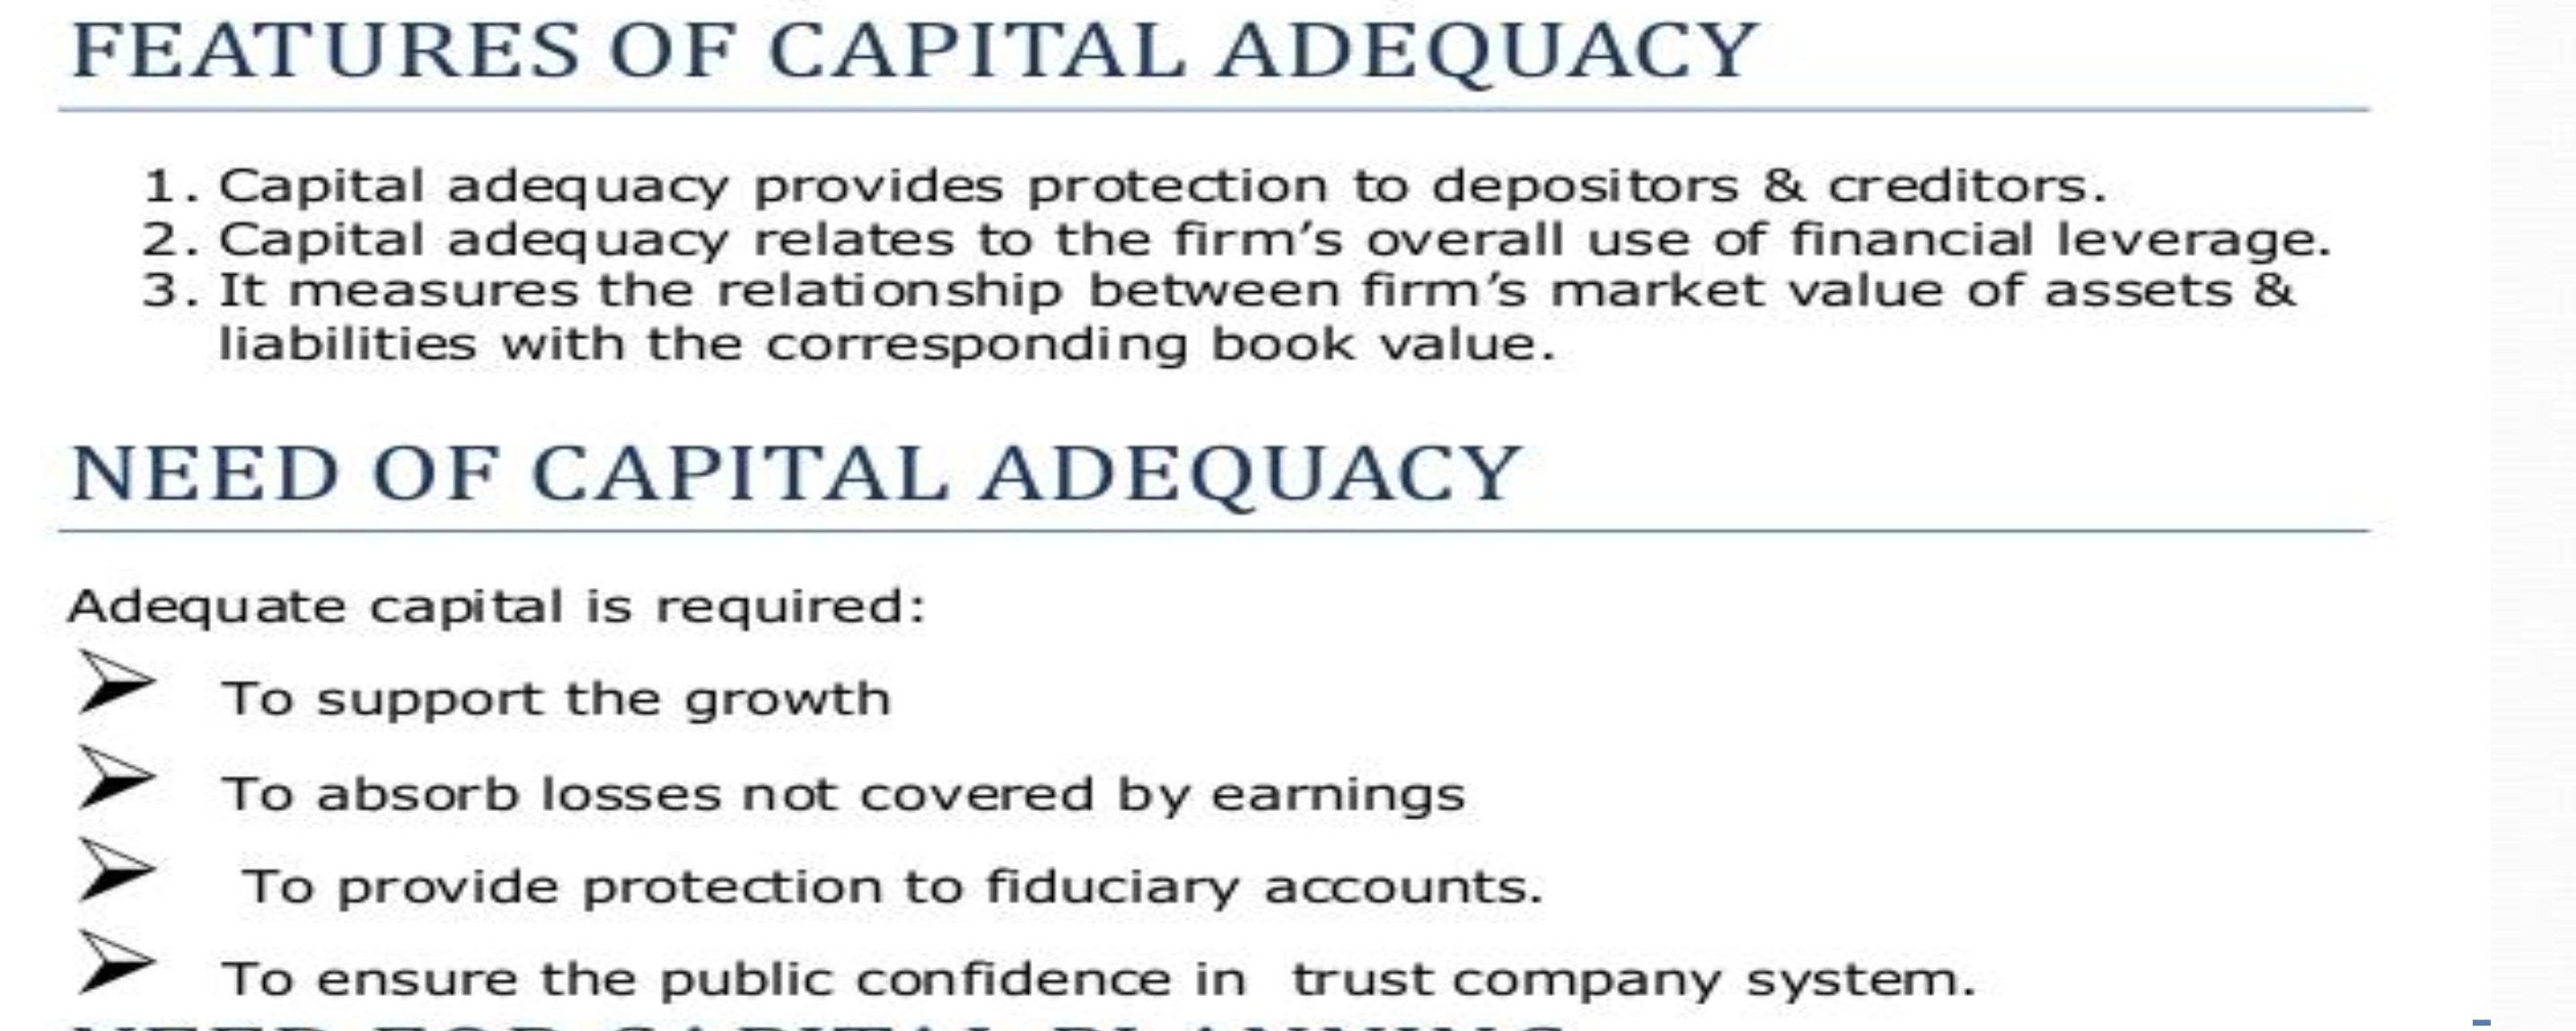
Capital is the investment in or contribution to the business of an institution that ranks behind depositors and other creditors as to entitlement to repayment or return on investment.
capital adequacy is a ratio that can indicate a banks ability to maintain the equity capital sufficient to pay the depositors whenever they demand money and still have enough funds to increase the banks assets through additional lending
Capital adequacy provides regulators with a means of establishing whether banks and other financial institutions have sufficient capital to keep them out of difficulty. regulators use a capital adequacy ratio a ratio of a bank’s capital to its assets to assess risks.
CAR= banks capital/ risk weighted assets = tier 1 capital + tier 2 capital/ risk weighted assets
Tier 1 capital is the primary way to measure a bank’s financial health. It includes shareholder’s equity and retained earnings, which are disclosed on financial statements. As it is the core capital held in reserves, Tier 1 capital is capable of absorbing losses without impacting business operations.
On the other hand, Tier 2 capital includes revalued reserves, undisclosed reserves, and hybrid securities. Since this type of capital has lower quality, is less liquid, and is more difficult to measure, it is known as supplementary capital.
Risk Weighted assets= They are calculated by looking at bank’s loan,evaluating risk and then assigned a weight based on the degree of credit risk.
features and needs of capital adequacy
revenue model
The revenue model of an MFI is built on the spread between the cost of capital and the interest charged to borrowers.
Core Revenue Streams:
Interest Income: The primary source. Rates are typically higher than commercial banks (often 18%–24%) to cover the high cost of field-based operations and the lack of collateral.
Processing & Service Fees: A one-time fee (usually 1%–2%) charged at the time of loan disbursement to cover administrative costs.
Commission from Third-Party Products: Many MFIs act as agents for insurance companies or solar energy providers, earning a commission on every policy or product sold to their client base.
Investment Income: Interest earned on cash reserves held in commercial banks or government bonds.
The Profitability Equation:
For an MFI to be "Sustainable," its revenue must cover:
Cost of Funds: What it pays to its lenders.
Operating Costs: The cost of the "human touch" (loan officers visiting villages).
Loan Loss Provisions: The cost of people not paying back.
Capital Growth: A small margin to grow the fund so they can reach more people next year.
What is CVP analysis?
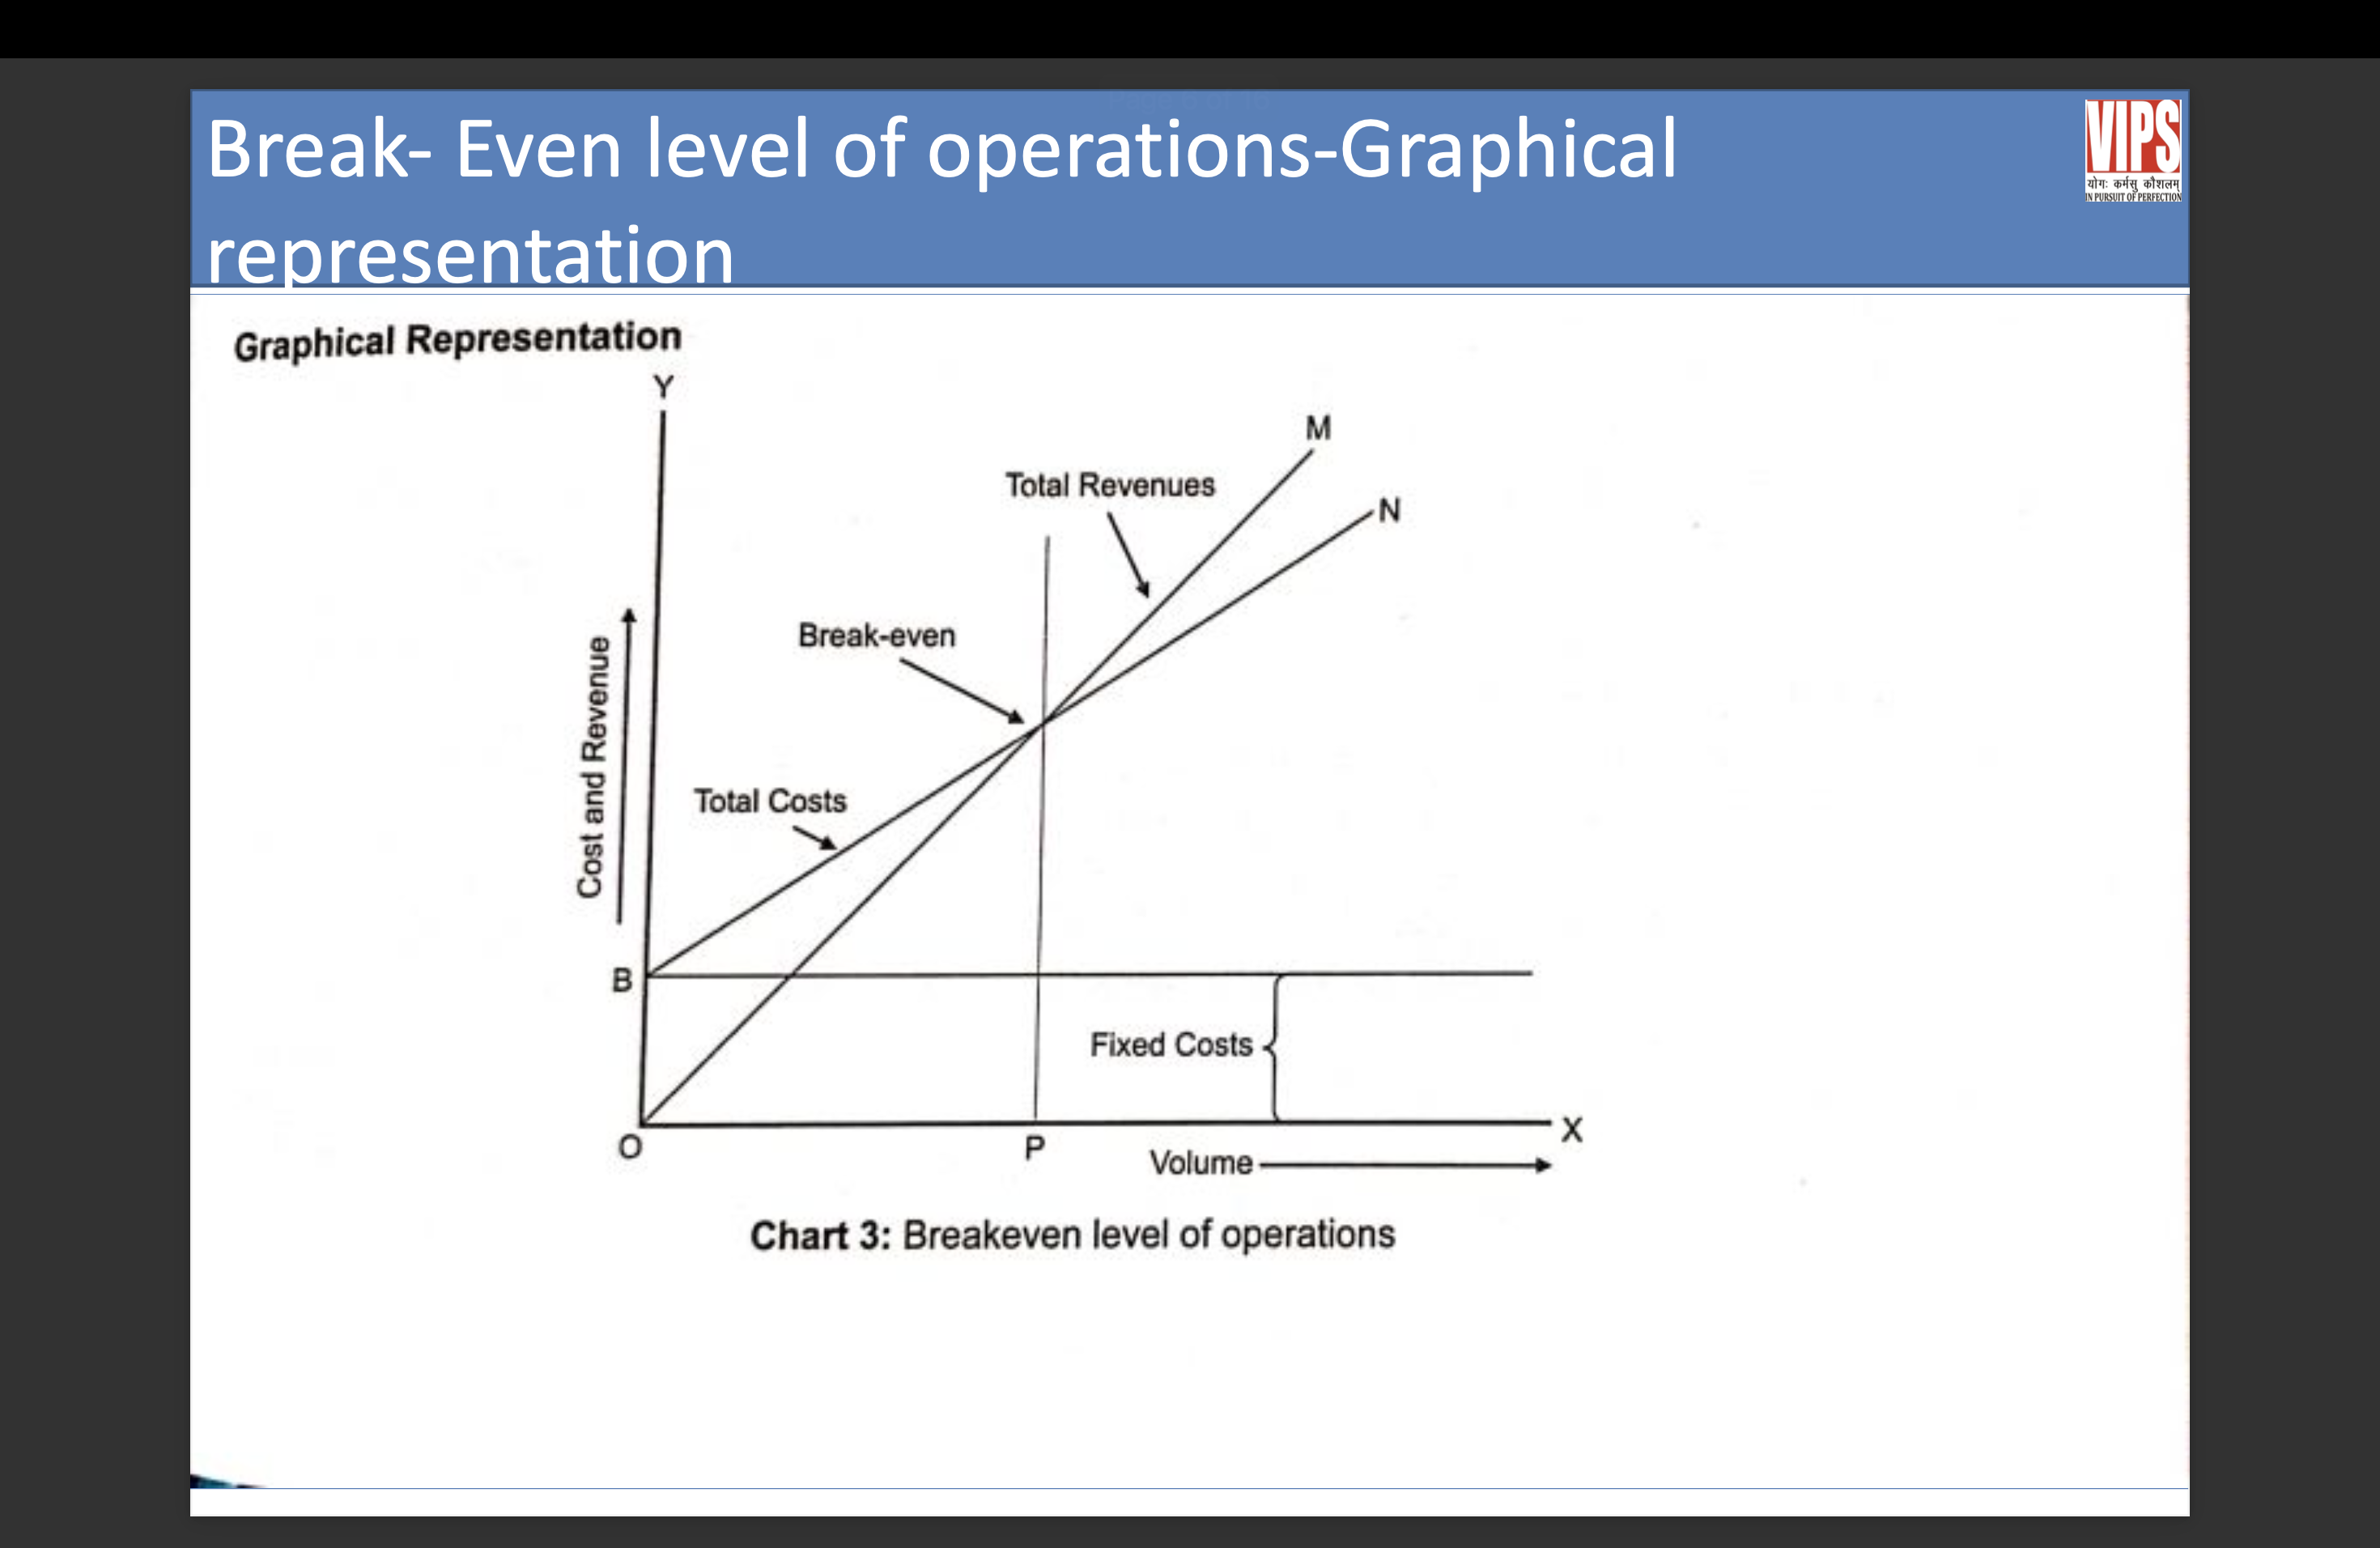
Cost-volume-profit (CVP) analysis examines how changes in sales volume and costs affect a company's operating profit, it is said to be break even when total revenues are equal to total cost.
Total variable cost are considered to be those cost that vary as the volume of operation changes.
Fixed cost on the other hand are the cost which do not vary according to the volume of operations.
CVP analysis is very important tool for decision-making, which enables the management to take informed decisions about MFI operations.
Assumptions of CVP analysis
All cost can be divided into their fixed and variable elements
The behaviour of variable cost is linear
Total fixed cost remain constant
Interest yield are constant
Efficiency and productivity are constant
The CVP Analysis is usually performed with a single product. In case of MFIs most of the CVP analysis is performed with loan products.
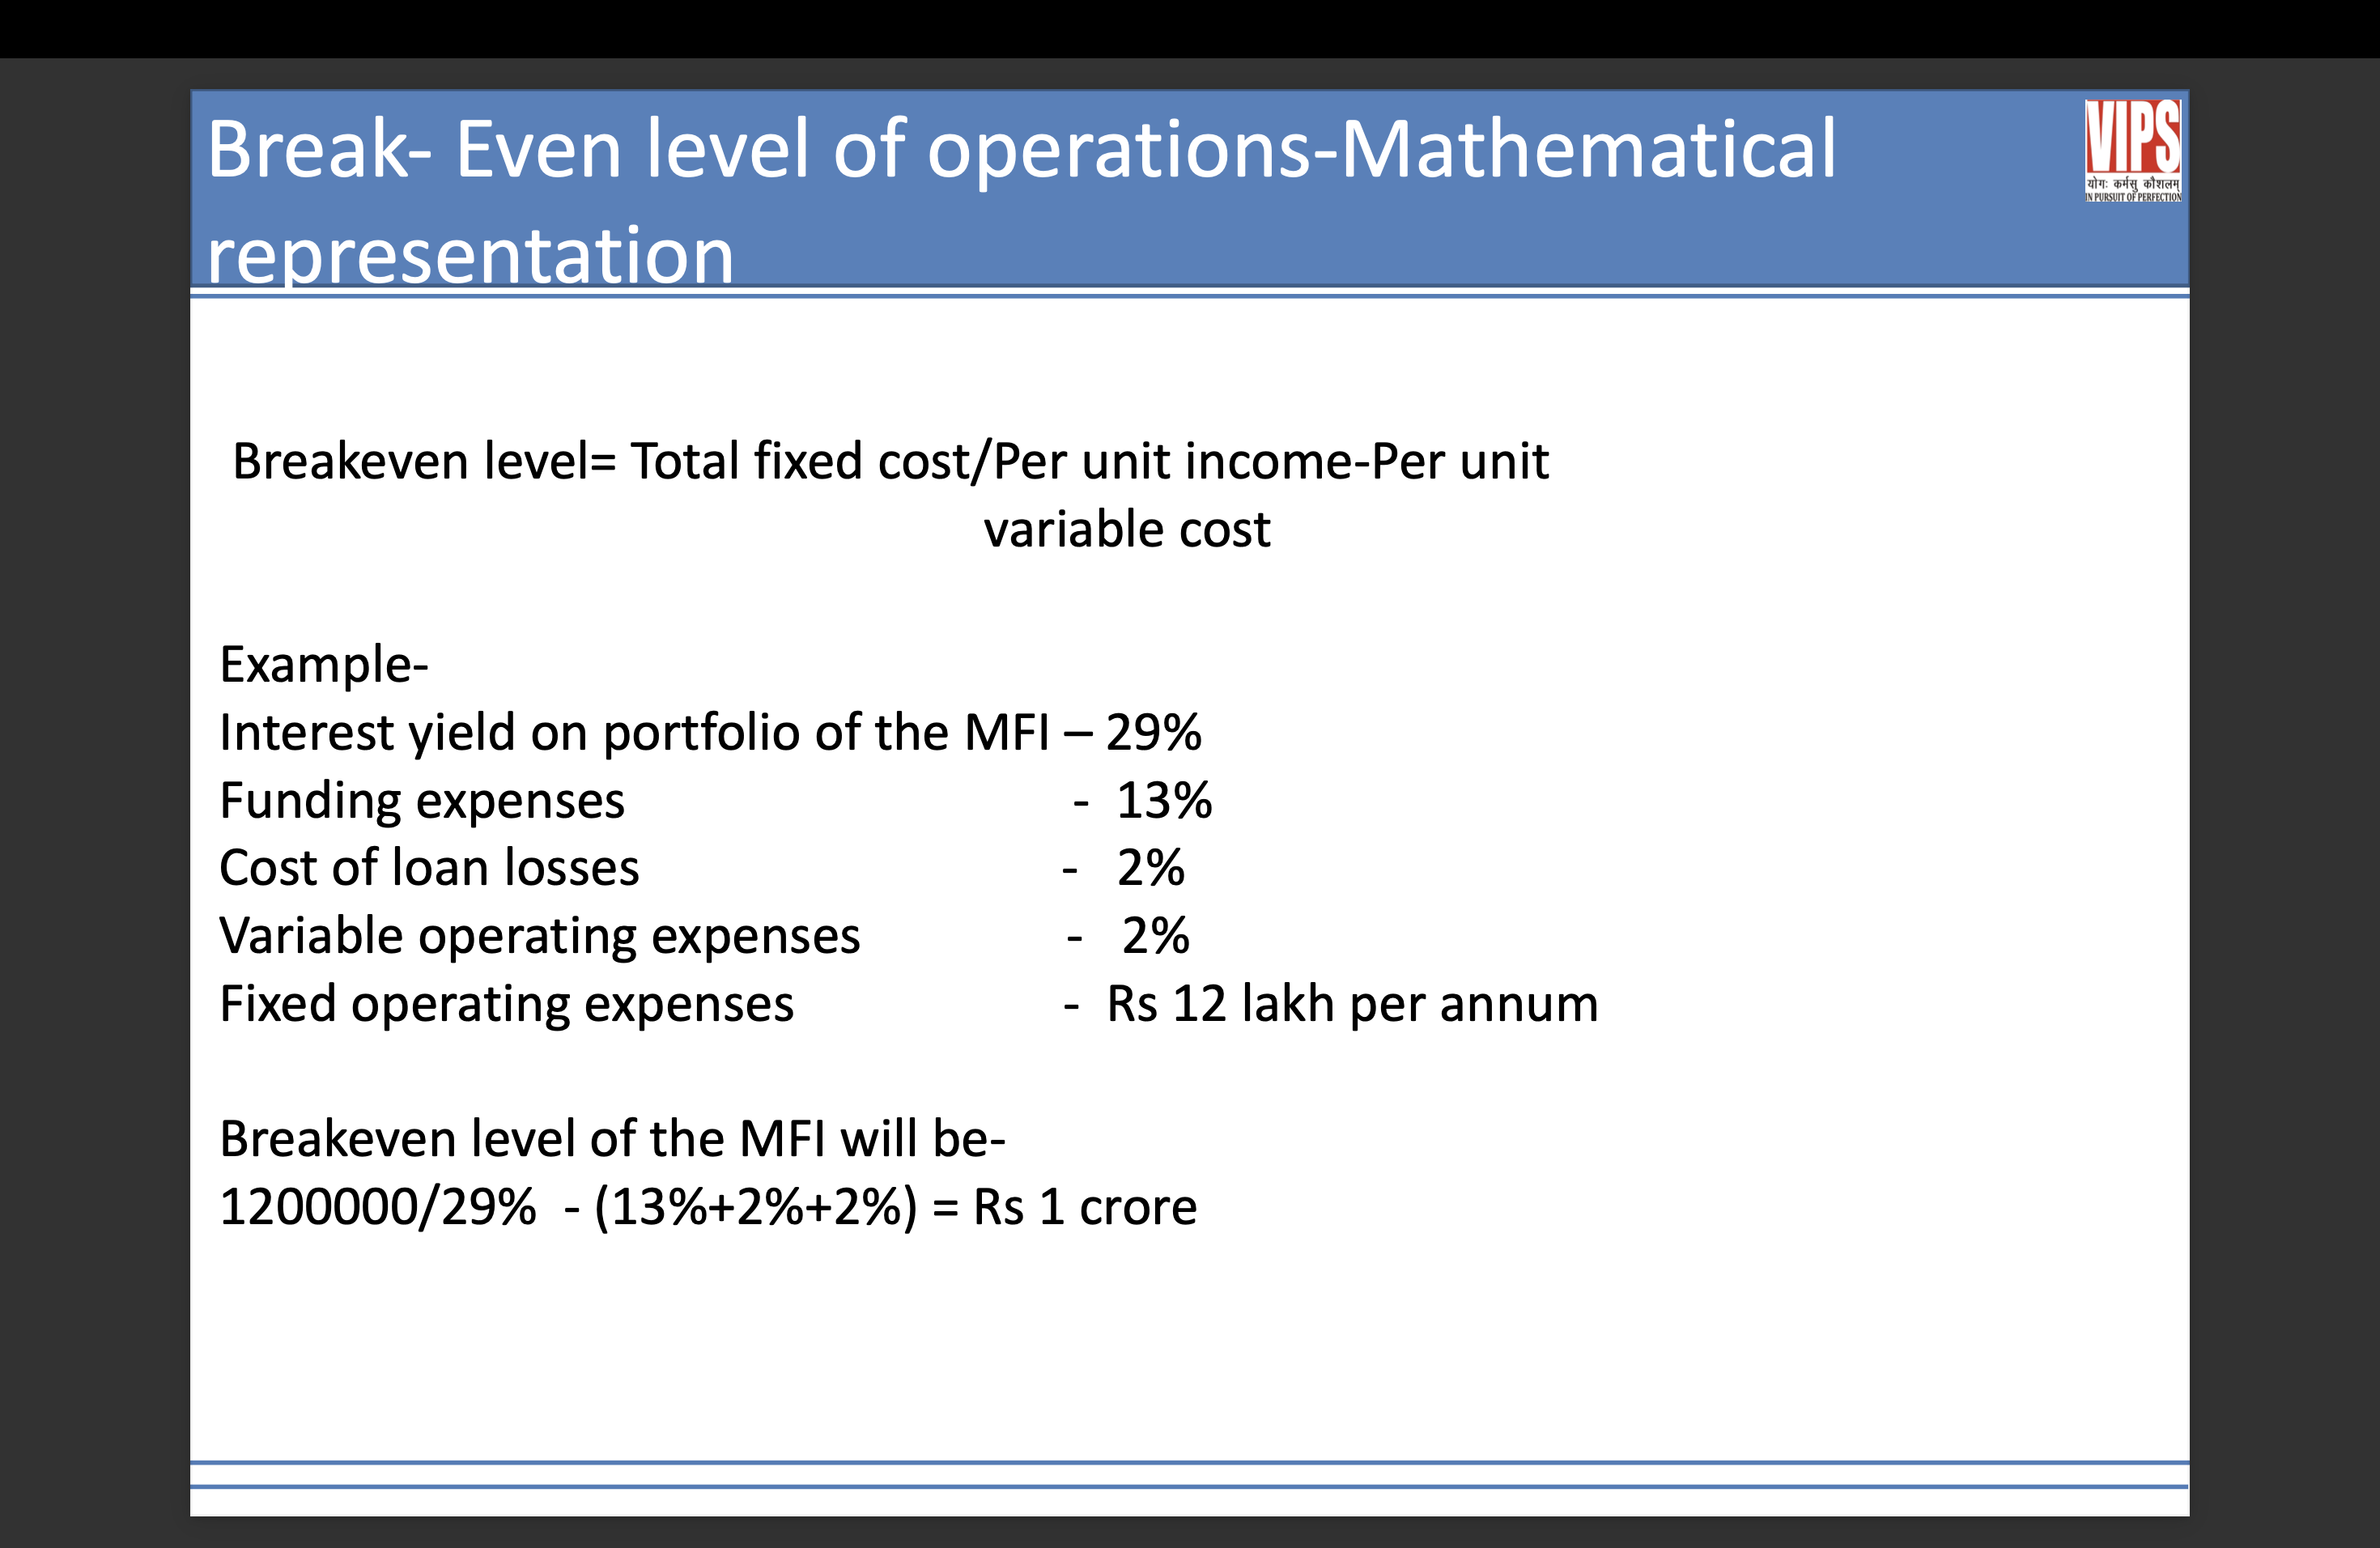
Break even level of operations
measuring operating efficiency
Operating efficiency in microfinance is the ability of an institution to deliver financial services at the lowest possible cost while maximizing its output (reach).
Because MFIs deal with small transactions, even a slight decrease in efficiency can make a loan "unprofitable" due to the high costs of staff travel and administration. Efficiency is generally divided into two levels: Individual Productivity (the Loan Officer) and Institutional Efficiency (the MFI as a whole).
How MFIs Can Improve Efficiency
To reach an optimum level of efficiency, MFIs focus on trimming "bad outputs" (like defaults) and optimizing "inputs" (staff and capital).
Economies of Scale: Growing the borrower base (ideally beyond 2,000 active clients) allows an MFI to spread fixed costs (rent, IT, head office salaries) over a larger loan portfolio.
Adopting the "Tech-Touch" Model: Implementing Core Banking Solutions (CBS) and mobile-based loan applications reduces paperwork and "turnaround time" (TAT) for loan approvals.
Customer Retention: It is significantly cheaper to provide a second or third loan to an existing "known" borrower than to acquire and vet a new one. Efficiency improves as the information asymmetry decreases over time.
Standardized Product Design: Offering a few simple, well-designed products rather than a complex array of customized loans reduces training costs for staff and confusion for clients.
Decentralized Operations: Empowering branch managers to make credit decisions (within set limits) prevents "bottlenecks" at the head office, making the institution more agile.
2. When Efficiency Becomes Counterproductive
While efficiency is usually a virtue, pushing it too far can lead to "Mission Drift"—where the MFI begins to function like a predatory commercial bank rather than a social enterprise.
Negative Effects of Excessive Efficiency Focus:
Exclusion of the Poorest (Depth of Outreach): The "cost per borrower" is highest for the poorest clients who live in remote areas and need tiny loans. To be "efficient," an MFI might stop serving these clients in favor of wealthier "micro-entrepreneurs" in urban centers.
The "Assembly Line" Effect: Loan officers may be forced to manage too many clients (e.g., more than 500 per officer). This leads to poor vetting, zero relationship-building, and a lack of financial literacy training for the borrower.
Aggressive & Coercive Collection: In an effort to keep the Portfolio at Risk (PAR) at zero, staff may resort to high-pressure tactics or harassment to ensure 100% repayment, leading to borrower distress or even suicides.
Hidden Costs for Borrowers: To lower their own operating expenses, some MFIs shift costs to the borrower (e.g., requiring them to travel long distances to a central branch instead of visiting the village), which effectively raises the "real cost" of the loan for the poor.
Staff Burnout: High turnover of field staff is a common byproduct of extreme efficiency targets. This destroys "institutional memory" and leads to higher long-term costs in hiring and retraining.
Measuring Loan Officer Efficiency
Loan officers are the engine of an MFI. Their efficiency is measured by how well they manage their "caseload" without compromising the quality of the loans.
A. Productivity Ratios
Borrowers per Loan Officer: The total number of active borrowers assigned to one officer.
Standard: In a traditional group-lending model, a productive officer typically handles 300 to 500 clients.
Portfolio per Loan Officer: The total outstanding dollar value of all loans managed by the officer.
New Client Acquisition Rate: The number of new borrowers an officer brings in per month. This measures their "growth" efficiency.
B. Quality-Adjusted Efficiency
Efficiency is meaningless if the loans aren't being paid back. Therefore, loan officer performance is always measured alongside:
Portfolio at Risk (PAR): The percentage of the officer's portfolio that has at least one payment overdue (usually 30 days).
Collection Efficiency:
\frac{\text{Actual Amount Collected}}{\text{Amount Due for Collection}} \times 100
Target: Most efficient MFIs require a collection rate of 98% to 100%.
2. Measuring Overall Institutional Efficiency
Overall efficiency looks at how the entire organization uses its resources (capital and staff) to generate its portfolio.
A. The Operating Expense Ratio (OER)
This is the "Gold Standard" metric for MFI efficiency. It measures the institutional cost of delivering loan services.
\text{OER} = \frac{\text{Total Operating Expenses (Salaries + Rent + Admin)}}{\text{Average Gross Loan Portfolio}}
Interpretation: If the OER is 15%, it means the MFI spends 15 cents for every $1 it lends out.
Goal: A lower OER is better. Large, efficient MFIs often have an OER between 10% and 20%, while smaller ones may be as high as 30%.
B. Cost per Borrower
This measures how much it costs (in absolute currency) to serve one client.
\text{Cost per Borrower} = \frac{\text{Total Operating Expenses}}{\text{Average Number of Active Borrowers}}
Why it matters: Unlike OER, this ratio isn't skewed by loan size. It reveals the true "transaction cost" of reaching a person in poverty.
C. Operational Self-Sufficiency (OSS)
Efficiency ultimately leads to sustainability. OSS measures if the MFI generates enough income to cover its costs.
\text{OSS} = \frac{\text{Operating Income}}{\text{Operating Expenses + Financial Expenses + Loan Loss Provisions}}
Benchmark: An OSS of >100% indicates the MFI is efficient enough to survive without donor subsidies.
What factors affect operating expenses of MFIs?
Scale of operations
Governance structure
Target group
Operational area
Methodology
Technology
Expansion strategy
What can MFIs do to improve efficiency?
Cost analysis
Standardised procedures
Larger loan sizes
More clients per loan officer
Incentives
Use of technology
what is benchmarkings
Benchmarking in Microfinance Institutions (MFIs) is the process of comparing an MFI's performance metrics against industry standards or peer groups to identify strengths, weaknesses, and opportunities for improvement. It involves using various financial and operational ratios to evaluate profitability, efficiency, and outreach, enabling MFIs to enhance performance, attract investment, and drive strategic decisions.
what is ratings
Microfinance Institutions (MFIs) receive two primary types of ratings: MFI Grading (assessing operational sustainability and scalability) and a Code of Conduct Assessment (COCA) grade (assessing adherence to industry ethical standards). These ratings use specific alphanumeric scales and are provided by credit rating agencies like CRISIL, Brickwork Ratings, ICRA, and SMERA.
what are the analysis of financial statements?
Financial statement analysis is the process of reviewing a company's financial records to assess its performance, financial health, and future prospects. Key financial statements used in this analysis include the balance sheet, income statement, and cash flow statement.
Components of Financial Statements in Microfinance
Financial statements for MFIs follow standard accounting principles but include specific line items related to micro-lending.
A. The Balance Sheet (Statement of Financial Position)
This provides a snapshot of the MFI’s resources and how they are funded at a specific point in time.
Assets: The largest asset for an MFI is the Gross Loan Portfolio (GLP)—the total amount of principal owed by clients. Other assets include cash, bank balances, and investments.
Liabilities: Includes Client Savings (if the MFI is deposit-taking), commercial borrowings from banks, and concessional loans from donors.
Equity: Represents the "net worth," consisting of donated equity (grants), share capital from investors, and Retained Earnings (accumulated profits).
B. The Income Statement (Statement of Activities)
This tracks the flow of money over a period (e.g., a year).
Financial Revenue: Primarily Interest Income and Loan Processing Fees.
Financial Expense: The interest the MFI pays to its own lenders or on client deposits.
Loan Loss Provision Expense: A "non-cash" expense that sets aside money to cover expected defaults.
Operating Expenses: Costs like loan officer salaries, rent, and travel.
C. The Cash Flow Statement
Crucial for MFIs to ensure they have enough liquidity to disburse new loans while meeting repayment obligations to their own creditors.
Characteristics of MFI Financial Statements
To be useful for stakeholders (investors, donors, and regulators), these statements must possess six key qualitative characteristics:
Transparency: Clearly showing the "Yield on Portfolio" so stakeholders know the true interest rate charged to the poor.
Adjustability: MFIs often use "Analytical Adjustments" to account for inflation or subsidies to show how the MFI would perform as a purely commercial entity.
Comparability: Standardized reporting allows investors to compare an MFI in India with one in Peru.
Timeliness: Frequent reporting (often monthly or quarterly) is necessary because micro-portfolios turn over very quickly.
Portfolio Quality Focus: Unlike traditional banks, MFIs highlight Portfolio at Risk (PAR)—a critical indicator of loan health.
Sustainability Metrics: They emphasize Operational Self-Sufficiency (OSS) to prove they don't just rely on charity.
what is financial evaluation?
Financial evaluation is a comprehensive assessment of a business, project, or asset's financial health, performance, and prospects. It involves using data from financial statements (income statements, balance sheets, and cash flow statements) to make informed decisions for internal management, external investors, or lenders.
Purpose of Financial Evaluation
The primary goals of a financial evaluation include:
Assessing performance: Evaluating a company's past and current operational efficiency and profitability.
Identifying strengths and weaknesses: Pinpointing areas for improvement or competitive advantage.
Planning and forecasting: Building long-term plans, setting financial policies, and predicting future growth and profitability prospects.
Informing investment decisions: Helping investors decide whether to buy into a company or project, or assisting management in project appraisal.
Determining value: Estimating the objective value of a company or asset, which is crucial during mergers, acquisitions, or fundraising.
Ensuring compliance: Verifying adherence to regulations and assessing financial risk.