Biology Quiz 3 Prep: Lecture 14,15,16,17
1/48
There's no tags or description
Looks like no tags are added yet.
Name | Mastery | Learn | Test | Matching | Spaced | Call with Kai |
|---|
No analytics yet
Send a link to your students to track their progress
49 Terms
Species Defined By BSC
Species are defined by the biological species concept based on the goal of reproductive isolation among populations. NO GENE FLOW. This means that members of different species cannot interbreed and produce viable, fertile offspring.
Prezygotic Isolation
A mechanism that prevents mating or gene flow between different species, ensuring reproductive isolation before the formation of a zygote. Based on three different concepts: Temporal (time), Habitat (isolated because of different habitats), behavioral, gametic barrier, and mechanical.
Postzygotic isolation
A reproductive barrier that occurs after fertilization, preventing the development of viable, fertile offspring. This includes mechanisms such as hybrid viability, hybrid sterility, and hybrid breakdown.
Problems w/ BSC
Species need to be co-located to demonstrate reproductive barriers. Cannot be tested in fossil specimens, does not apply to asexual organisms, difficult to apply when hybridization is common.
Species Defined by PSC
A concept that defines species based on their evolutionary history and phylogenetic relationships, emphasizing the smallest group of individuals that share a common ancestor.
Monophyly
Groups of taxa that contain all known descendents of a single common ancestor
Problems w/ PSC
Issues arising from defining species based on phylogenetic relationships include difficulties in determining ancestral traits, potential for oversplitting species, and challenges in interpreting incomplete or ambiguous data. Not many good phylogenies.
Species Defined by MSC
A concept that defines species based on morphological characteristics and physical traits, often focusing on observable features rather than genetic or evolutionary relationships.
Problems w/ MSC
Issues related to defining species based on morphological characteristics include subjectivity in trait selection, potential for overlooking genetic diversity, and challenges in accounting for variations within species.
Three stage process of speciation
Isolation of populations
Divergence between populations
Reproductive isolation of populations
Vicariance
A process in which a species' range is split into separate populations due to geographical barriers, leading to speciation.
Isolation of Populations
The separation of groups of organisms, often due to geographical barriers or environmental changes, which prevents interbreeding and allows for evolutionary changes to occur.
Divergence between populations
The process by which two or more populations evolve different traits or characteristics over time, often due to different selective pressures or adaptations to their environments.
Reproductive Isolation
The inability of different species or populations to interbreed and produce viable, fertile offspring, often due to behavioral, temporal, or mechanical barriers.
Extirpation
Loss of a species locally, populations may exist elsewhere.
Extinction
Complete Loss of a species, no individuals anywhere
Background Extinction
The normal rate of extinction occurring in the absence of human influence, typically due to natural processes such as environmental changes.
Mass Extinction
A rapid and widespread decrease in the biodiversity on Earth, typically characterized by the extinction of a large number of species in a relatively short period of geological time.
K-P Extinction
Most Recent extinction, killed off the dinosaurs and other marine species (75%)
Evidence of K-P Extinction
Fossil records indicating a sudden decline in species diversity, including the disappearance of dinosaurs and other organisms, along with iridium layers and geological changes.
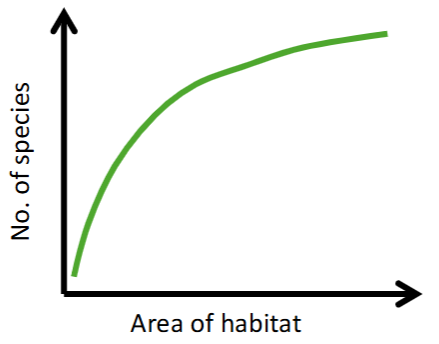
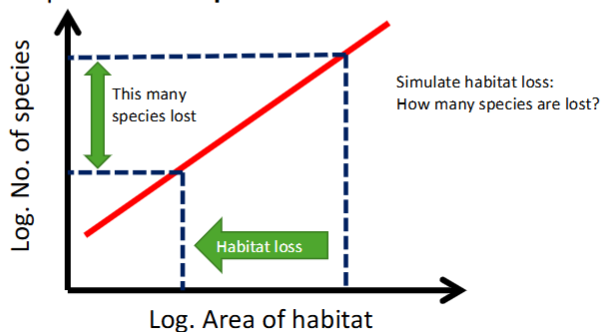
Species Area Curves
Used to determine the likelihood of a species going extinct.
Biogeography
global distributions of lineages and diversity
Ways the geographical distribution of a given clade will be determined by:
The ancestorial ecological niche of the clade
The geographical starting point for dispersal (tectonic history)
Limitations to dispersal due to abiotic conditions and other species
Opportunities for niche evolution that are afforded to species by the geographic location
the amount of time since the origin of the clade, during which Niche evolution and dispersal could occur
Ancestral niche of the clade
Niche: set of physical and environmental conditions a species requires and interactions it has w/ other species.
Ex: cacti: Arid environments, limited to Americas, Seed dispersal by birds, Limited by freezing temps
Geographical starting point for dispersal
History of earth: pangea, gondwanaland, land bridges
Ex: ostriches, depending on location is when you lost flight
Limitations to dispersal imposed by abiotic conditions and species
Dispersal: movement of individuals from where they were born to where they live
Locomotion: flying versus walking, wind dispersed, water column
Ex: Pleitocene Glaciation
Change in climate, climate zones shift toward equator, species w/ low dispersal capabilities had to adapt to new climatic regions
Opportunities for niche evolution that are afforded to species by the geographic location
species unlikely to adapt to ecological conditions that they were never exposed to
Ex: salamander diversity in SE US, ancestors lived in higher elevations
The Amount of time since the origin of the clade, during which niche evolution and dispersal could occur
Why are there lots of species in the Tropics: Tropics occurred over large extents until 30 MYA, more clades originated here therefore.
Biological Map
atom→molecule→organelle→cell→tissue→organ→organ system→organism→population→community→ecosystem→biosphere
3 Properties of Populations
Size
Distribution
Density
BIDE
Determines Population size (Birth, immigration, death, emigration)
Why calculate population sizes:
For endangered species count, reproductive success
Ways to quantify Population
Linear Model
Exponential Model
Logistic Model
Linear Model
Population increases steadily with no per capita rate.
Ex: N0 = 10
2 rabbits born per year
Limitations to Linear Model
Doesn’t factor in environmental concerns, no loss, birth rate isn’t a function of pop size
Exponential Model
Population grows steadily at a rate.
Ex: N=10
2 Rabbits born/rabbit
0.5 deaths/rabbit
Per capita growth rate: 1.5 (2-0.5)
Causes exponential curve
Point of Crisis
Point of exponential curve where the limiting resource affects population growth. “Law of minimum phenomena”
Logistic Model
Same stats as exponential model
Adds carrying capacity (K)
Grows steadily than plateaus
Assumptions: Steady Environment
Best model
Carrying capacity
Max number of individuals in a population
When N is Not close to K, what happens
K-N is LARGE, population is growing faster
When K is close to N
K-N is small, population is growing slowly
When N=K
Growing stops
When N>K
Limiting resources, growing shrinks
Life Tables
Lets you access births/deaths over life/age stages of the population
Uses cohort classes
Assumptions: no immigration or emigration
Cohort Classes
Groups of individuals of the same age
Net productive rate
R0 = average birth rates per year per females
R0 > 1
INCREASING population
R0 <1
Decreasing Population
R0=1
Stable Population