WL Habitat Conservation Final
1/93
There's no tags or description
Looks like no tags are added yet.
Name | Mastery | Learn | Test | Matching | Spaced | Call with Kai |
|---|
No analytics yet
Send a link to your students to track their progress
94 Terms
Course Description
Application of principles of wildlife biology to conservation and management of wild bird and mammal habitats including field applications
Themes of Defining Wildlife
Not easy to define
Inconsistent definition because of human importance bias
Must be alive (no viruses)
Wild/Non-domesticated
Wildlife
Non-domesticated terrestrial and aquatic vertebrate species.
Population Growth Rate Equation
Nt+1 = Nt * lambda
BIDE Model of Population Change
Nt+1 = Nt+B+I-D-E
Population Change by Survival/Reproduction
Nt+1 = N*S + N*R
Rule of survival and reproduction
1 = S + R (also lambda = S+R)
r Selection
Fast, emphasis on reproduction, high pressure/harvest
K Selection
Slow, emphasis on survival of adults, low pressure/harvest
Natural Selection
Occurs when individuals with certain genotypes are more likely than others to survive and reproduce, and thus pass on their alleles to the next generation.
Fitness
Total number of offspring an individual adult recruits into the next generation. Made up of fecundity, recruitment, and adult survival.
Conservation
The management of natural resources so it may yield the greatest sustainable benefit to present and future generations.
Principles of Conservation (5)
Organism biodiversity is good
Untimely extinctions are bad
Ecological complexity is good
Evolution should be allowed to continue
Biodiversity has intrinsic value
North American Model of Wildlife Conservation (7)
Wildlife resources are a public trust
Markets for game are eliminated
Allocation of wildlife is by law
Wildlife can be killed only for legitimate purpose
Wildlife is considered an international resource
Science is the proper tool to discharge wildlife policy
Democracy of hunting is standard
Management
The science and art of making decisions and taking actions to manipulate the structure, dynamics, and relations of wildlife populations, habitats, and people to achieve specific human objectives.
Ecosystems
Similar regions within a biome of similar environmental conditions, plants, and animals
Communities
Biotic groupings of plants and other organisms within ecosystems
Factors Limiting Geographic Range (4)
Competition with other species
Ability to disperse
Adequate food and cover resources
Environmental tolerance
Habitat
The suite of resources and environmental conditions that determine the presence, survival, and reproduction of a population.
Habitat vs Niche
Habitat is physical place, how environment impacts organism, is GEOGRAPHIC space
Niche: how organisms fit into ecosystem, how species use and affect environment, ENVIRONMENTAL space
Niche
The ecological conditions that a species requires to maintain populations in a given region, together with the impacts that a species has on its resources, other interacting species, its habitat, and environment.
Habitat Use
Demonstrated presence of a particular habitat in an animal or population’s behavioral repertoire
Habitat Selection
A hierarchical process involving a series of innate and learned behavioral decisions made by an animal about what habitat it would use at different spatial scales
Writing equation for multiple interactions
= B0 + B1(length) +B2(species) + B3(species)(length)
Scaling covariates
New x = current x - mean(x)
Intercept is now mass at the mean length while slope is the same
Z-standardizing across covariates
[x-mean(x)]/sd(x)
Biodiversity
Measures the amount of variety in organisms
Biogeography
Spatial patterns of biodiversity
Island Biogeography Theory (IBT) by MacArthur and Wilson
The number of species of a given taxon that become established on an island represents a dynamic equilibrium controlled by the rate of immigration of new species and the rate of extinction of previously established species.
Habitat surrounded by inhospitable matrix and biodiversity influenced by size/proximity of patches
Island Biogeography
The study of the species composition and survival rate on islands
Equilibrium species number
The species richness if an island at which immigration balances extinction, and which remains roughly constant
Drivers of fragmentation vulnerability (7)
Wide-ranging species (wolves)
Poor dispersers/poor mobility (beetles/butterflies)
Species with specialized requirements and temporary habitat (like stop-over sites)
Large-patch/patchily-distributed or interior species (pandas, spotted owls)
Species with low fecundity or recruitment or adult survival (grizzlies)
Species vulnerable to human exploitation/persecution
Sensitive to disturbance (wolverines)
Comparative Cost Benefit Analysis Steps (3)
Calculate the costs
Calculate the benefits
Pick the best choice
Reasons Cost-Benefit is Complicated (4)
Hard to assign monetary values to ecosystem services
Self interest
People lie
People forget
Cuyahoga River
“Business vs. Environmental Regulations” - False equivalency
Historically: River fires were common due to oil contamination
Went on for over 100 years until environmental legislation was passed
Present: still have spills because of industry around the river
Project Chariot
1950s plan by feds to build artificial harbor in Alaska, using nuclear bombs
Local tribes displeases and UAF concluded fallout would harm terrestrial and aquatic ecosystems
Known Known
We understand it’s an issue, and understand the issue
ex: job cost, building costs,…
Known Unknown
We understand it’s an issue and that we don’t fully understand the issue
ex: environmental impacts of projects
Unknown Unknown
We don’t even realize it’s a problem, nor do we understand it
ex: Whiskey fungus on town, Berkeley pit
Ecosystem Services Worth
Highly complicated
Estimate of $10/person/acre/year
Possible over $125 trillion (more than global GDP)
Uses of Cost-Benefit Analysis
In conjunction with power analyses, useful for allocating funds on wildlife research
In conjunction with parameter estimates from research to determine which management actions are the most cost effective
Precautionary Principle
An approach to risk management, where, if it is possible that a given policy/action might cause harm to the public or the environment (and if there is still not scientific agreement on the issue), the THE POLICY OR ACTION IN QUESTION SHOULD NOT BE CARRIED OUT.
Cost/Benefit Timescale Differences
Often, see lots of benefits shortly after action, with the costs not setting in for years to decades
Problems with Limited Research Funding (2)
Make sure doing something useful with the money
Make sure we don’t “over do” it
Standard way sample size is determined
= ($ available - salary - equipment)/per unit cost
Power Analysis
Used to determine the most cost=effective sample size for an experiment or observational study given a required significance level, statistical power, and effect size.
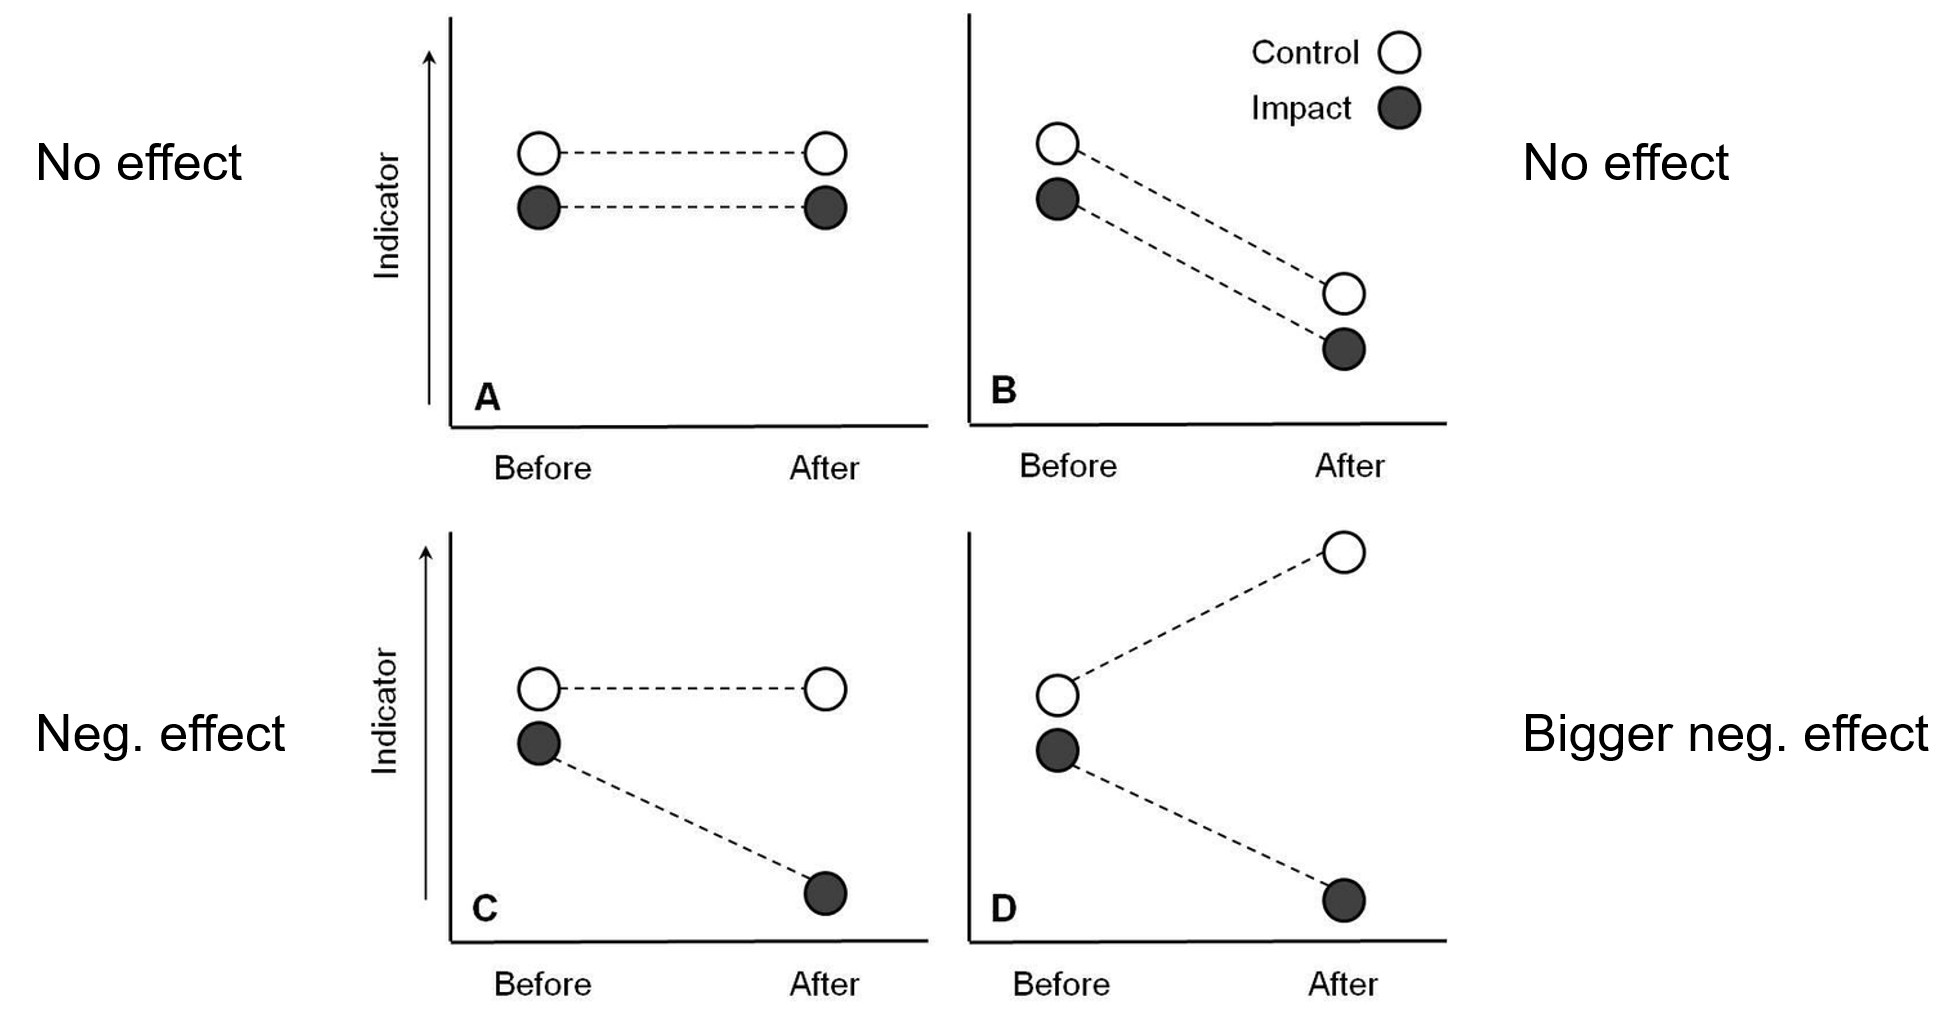
Before-After-Control-Impact Design
Used to study ecological responses in large experimental units for which replication is difficult or impossible.
Two units are monitored over time; one unit receives an intervention at some intermediate time, while the other is left as an undisturbed control.
The pre-intervention differences in the response between units are compared to the post-intervention differences, with a large disparity interpreted as evidence of an effect of the intervention.
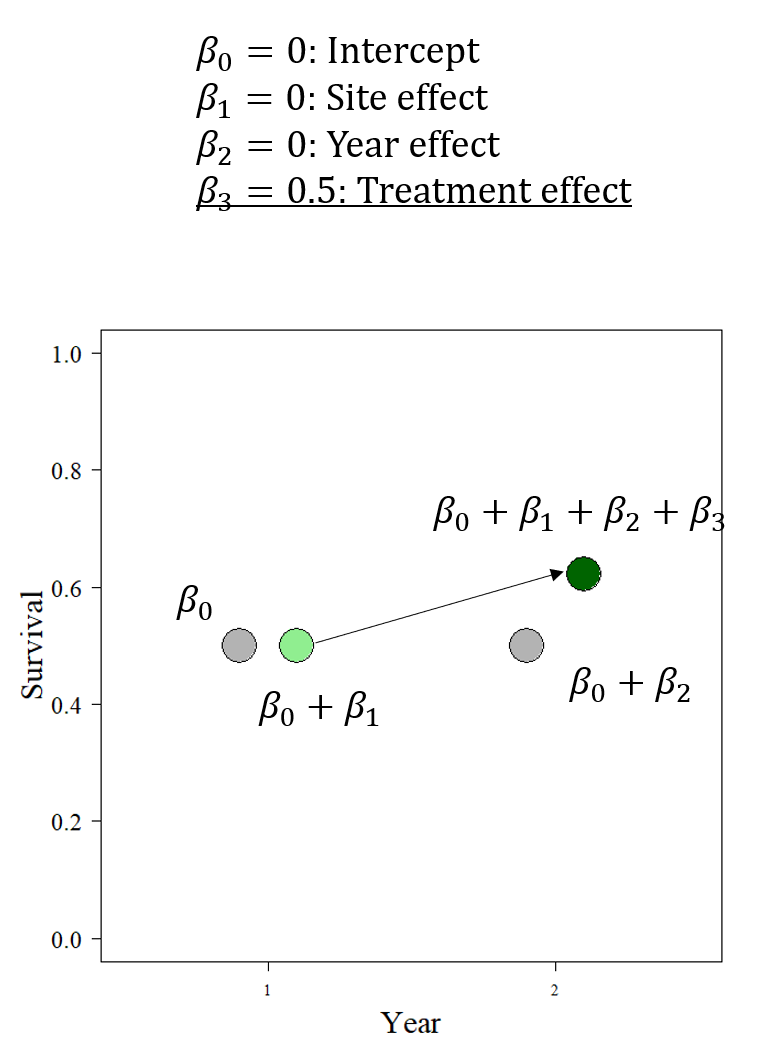
BACI Variables
Resulting treatment value is a combination of:
Beta-0: intercept (starting, control value)
Beta-1: Site effect (difference between initial control and initial treatment)
Beta-2: Year effect (difference between initial control and next control)
Beta-3: Treatment effect
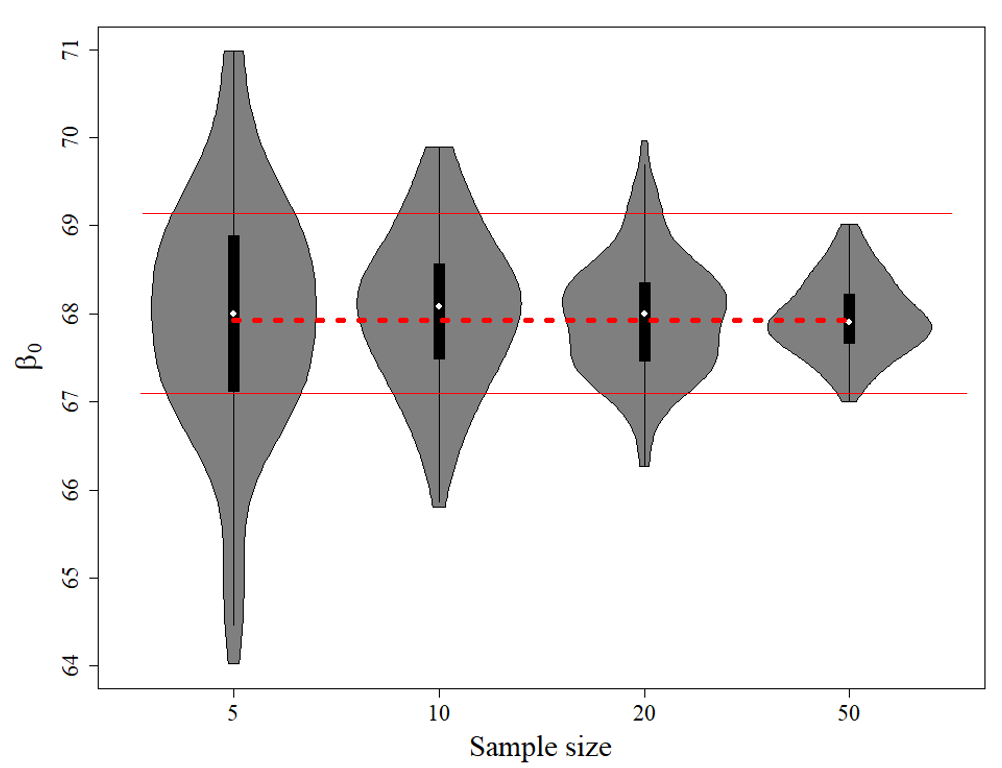
Considerations for Power Analysis (3)
Increasing sample size increases precision and power
The ‘right’ sample size may be a function of cost
The right answer might be ‘don’t do the project’
Benefits of Power Analysis (4)
Confidence in study
Competitive advantage for sources of funding
Bargaining power with funding agencies
More thorough understanding of what your analyses will look like, and how you should format your experiment
Path to Overabundance- Snow geese
1950-1990 Increased survival/fecundity through increased food availability (waste rice and corn) leading to population explosion
Decimation of arctic ecosystems
1998 Conservation Order, unlimited spring bag w/ shotguns and electronic calls w/ goal of 50% reduction by 2005
Estimates show effective for 10% of the population (southern breeding)
Lead to drop in juvenile survival and fidelity
Why did snow goose harvest efforts fail to reduce goose populations? (3)
Underestimation of abundance
Underestimation of harvest potential (geese good at avoiding harvest)
Harvest of adults was not completely additive (compensatory)
False Positives
Unsupported correlations, “leaf bird”, wrong tag ID reported
False Negatives
Fail to detect elements that are present
Elements Controlling Observation Potential (2)
Availability for detection (is it there, binary)
Detection Probability Given Availability (how easy to observe)
Zi - Latent State
The ecological truth of if animals present or not
Bernoulli of psi
Yij - Data
Was the animal actually observed at instance ij.
Zi * probability of detection
Outcomes of Z/Y interactions (4)
Z = 0, Y = 1: False Positive
Z = 0, Y = 0: Truth
Z = 1, Y = 1: Truth
Z = 1, Y = 0: False Negative
Pij
Probability of detecting an individual at a site (i) on a specific visit (j)
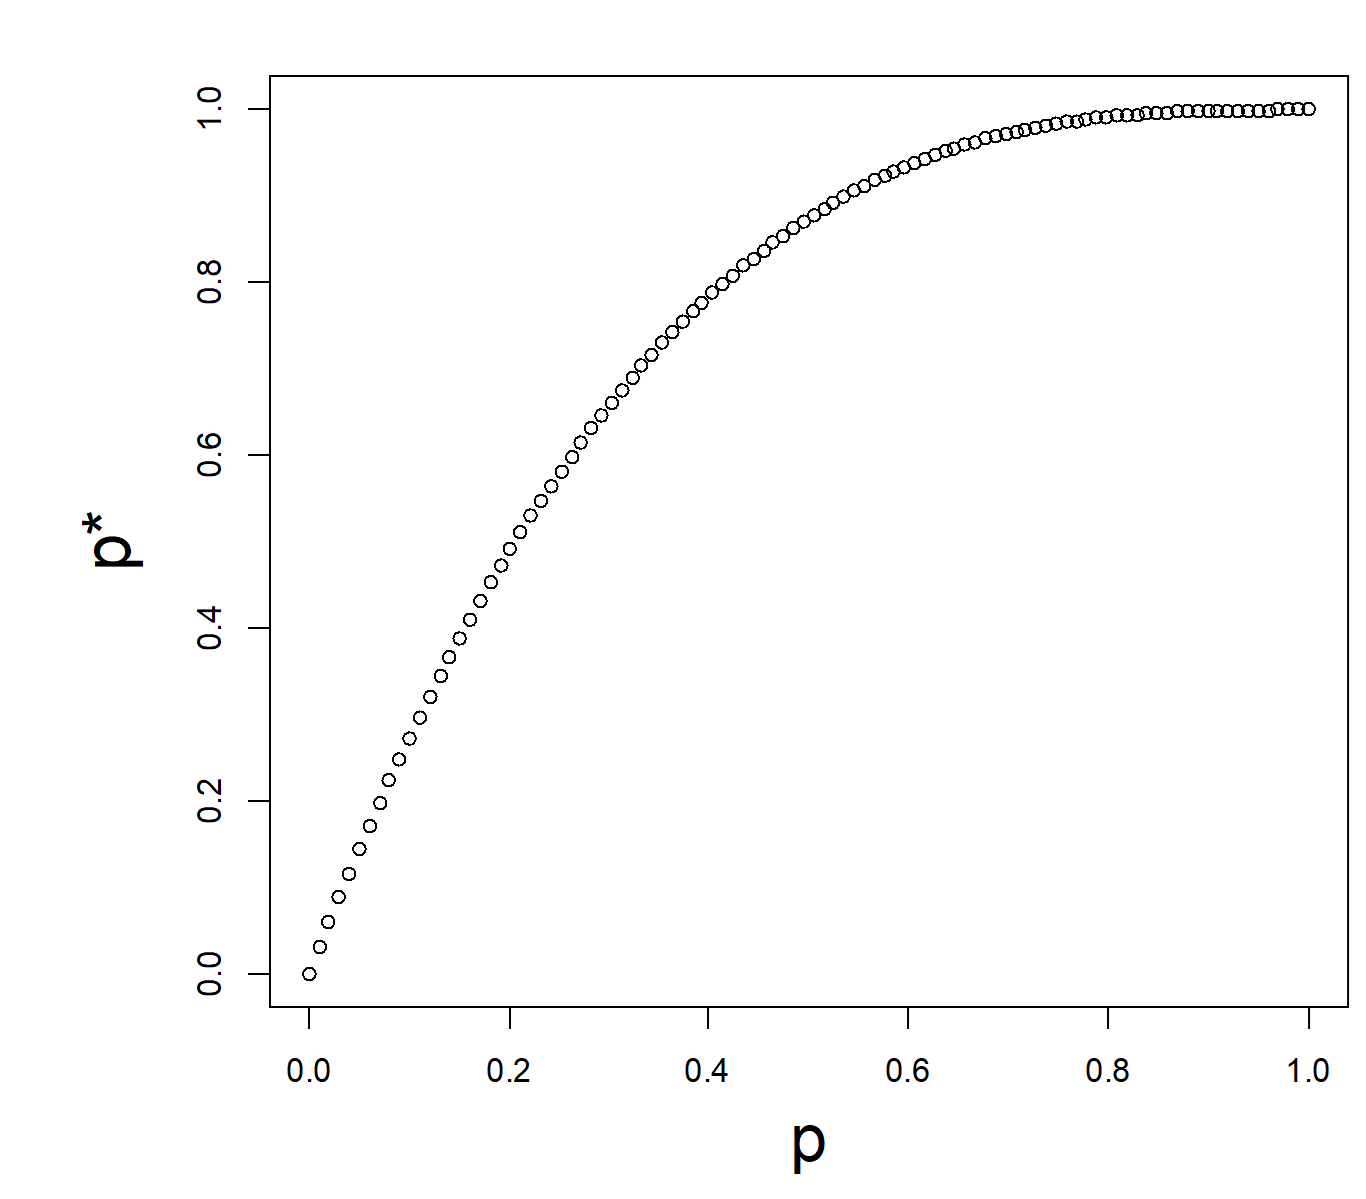
Pi*
Probability of detecting an individual at a site across all of the multiple visits
Pi* Equation
= 1- PRODUCT(1-Pij)
Categorical Covariates
Binary or categories such as degraded/restored that have set constraints
Continuous Covariates
Variables that are of a non-categorizable distribution, such as island size and distance from mainland
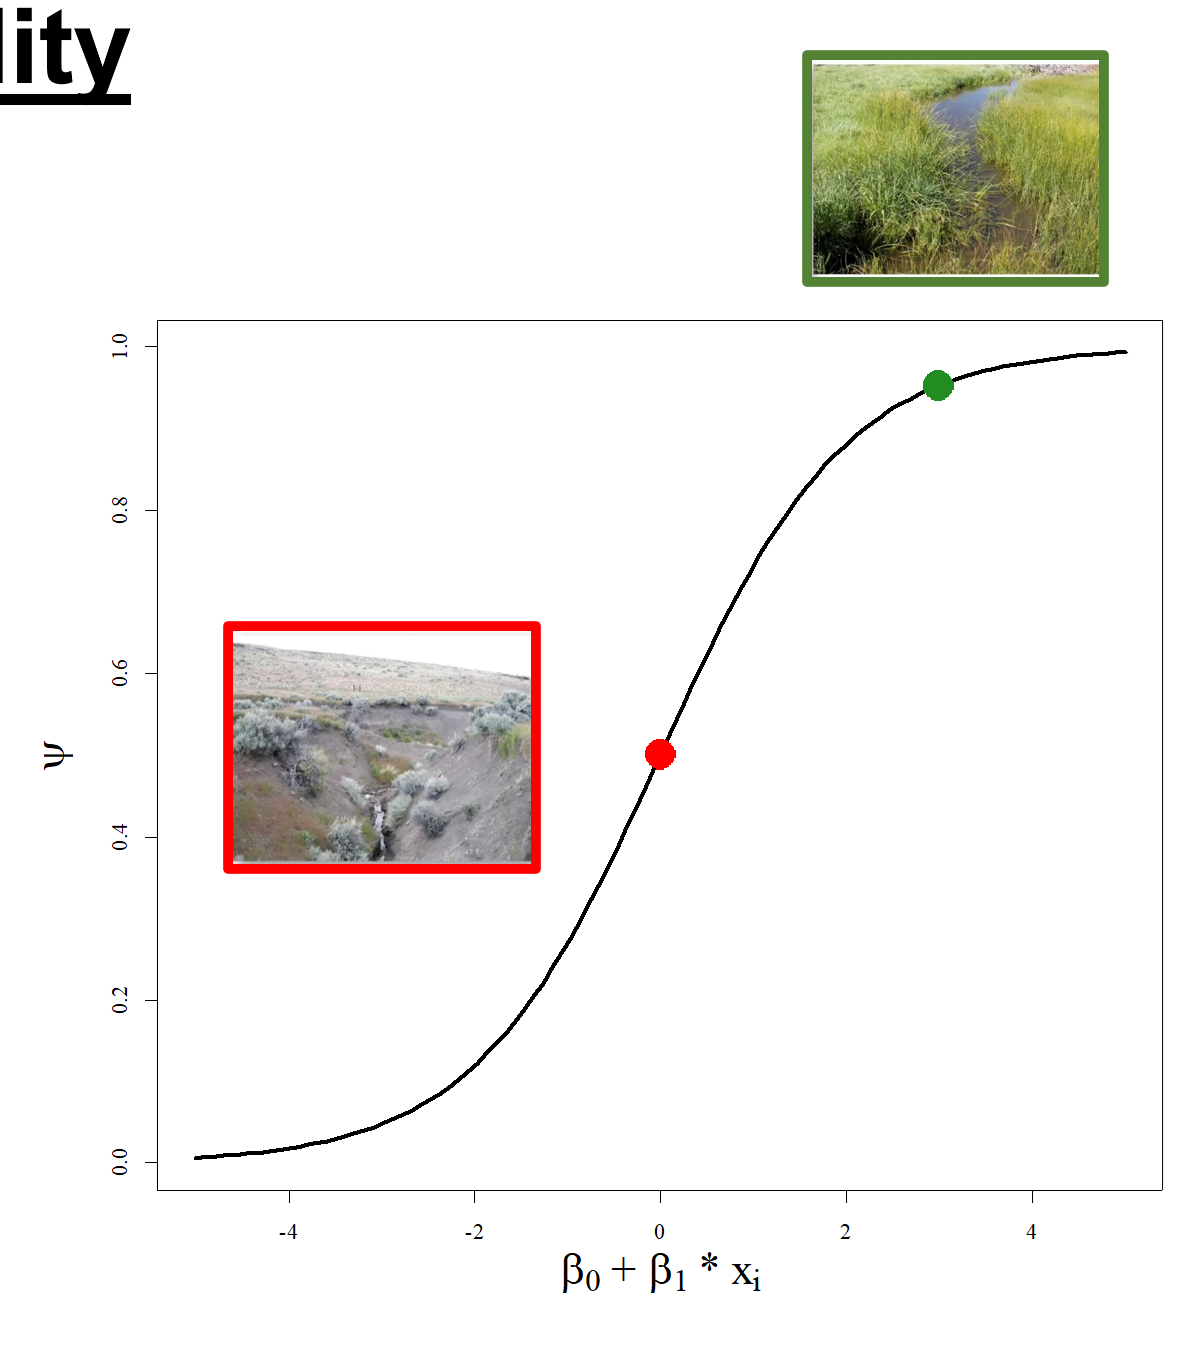
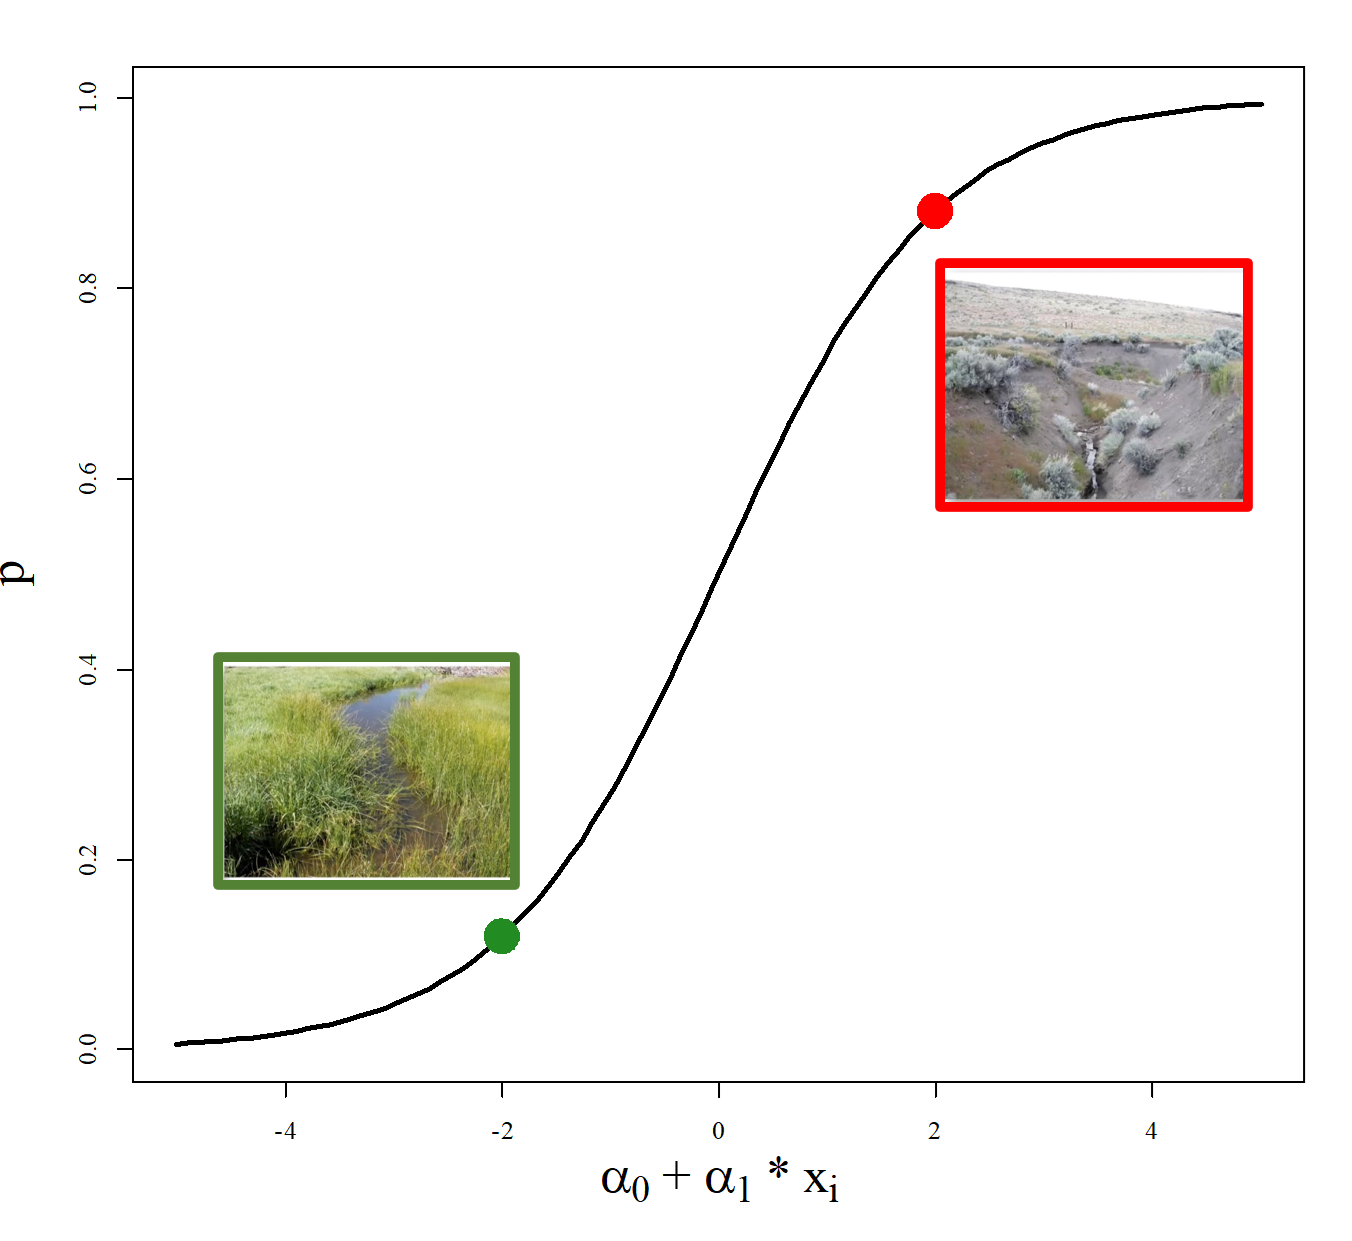
Occupancy probability and equation (psi)
logit(psi) = Beta0 + Beta1*xi
B1 is the influence that the presence of the confounding variable has on occupancy
Where xi is confounding variable (restored/grazed)
Graphed on x with y being proportion of sites at that state with occupancy
Detection probability and equation
logit(Pij) = Alpha0 + Alpha1*xi
A1 is the influence that the presence of the confounding variable has on occupancy
Where xi is confounding variable (restored/grazed)
Graphed on x with y being proportion of sites at that state with occupancy*pij
Relationship between pij and p*
p* initially increases rapidly with p increasing before leveling off to 1
Scale and Surveys
Want to see what occupancy can tell us about population dynamics, but home ranges can fluctuate temporarily and spatially. Ideally want to match home ranges.
Island Biogeography Case Study on Observational Studies Steps (5)
Make a bunch of fake islands varying randomly by size and distance to mainland
Create the occupancy probability model as:
logit(psi) = Beta0 +Beta1*size + Beta2*distance
Calculate the occupancy probability
Simulate occupancy for each island using respective probability
Simulate island surveys overtime on each island at some p
Effect of p on precision
The closer p is to 0.5, the less precise the model becomes
How to get Psi from Logit(Psi)
= (e^x)/(1+e^x)
Markovian Process
Probability of events depends on previous events or states
Fate Trees
Helps determine probability of next-time events based on current events using Persistence, Colonization, Extinction…
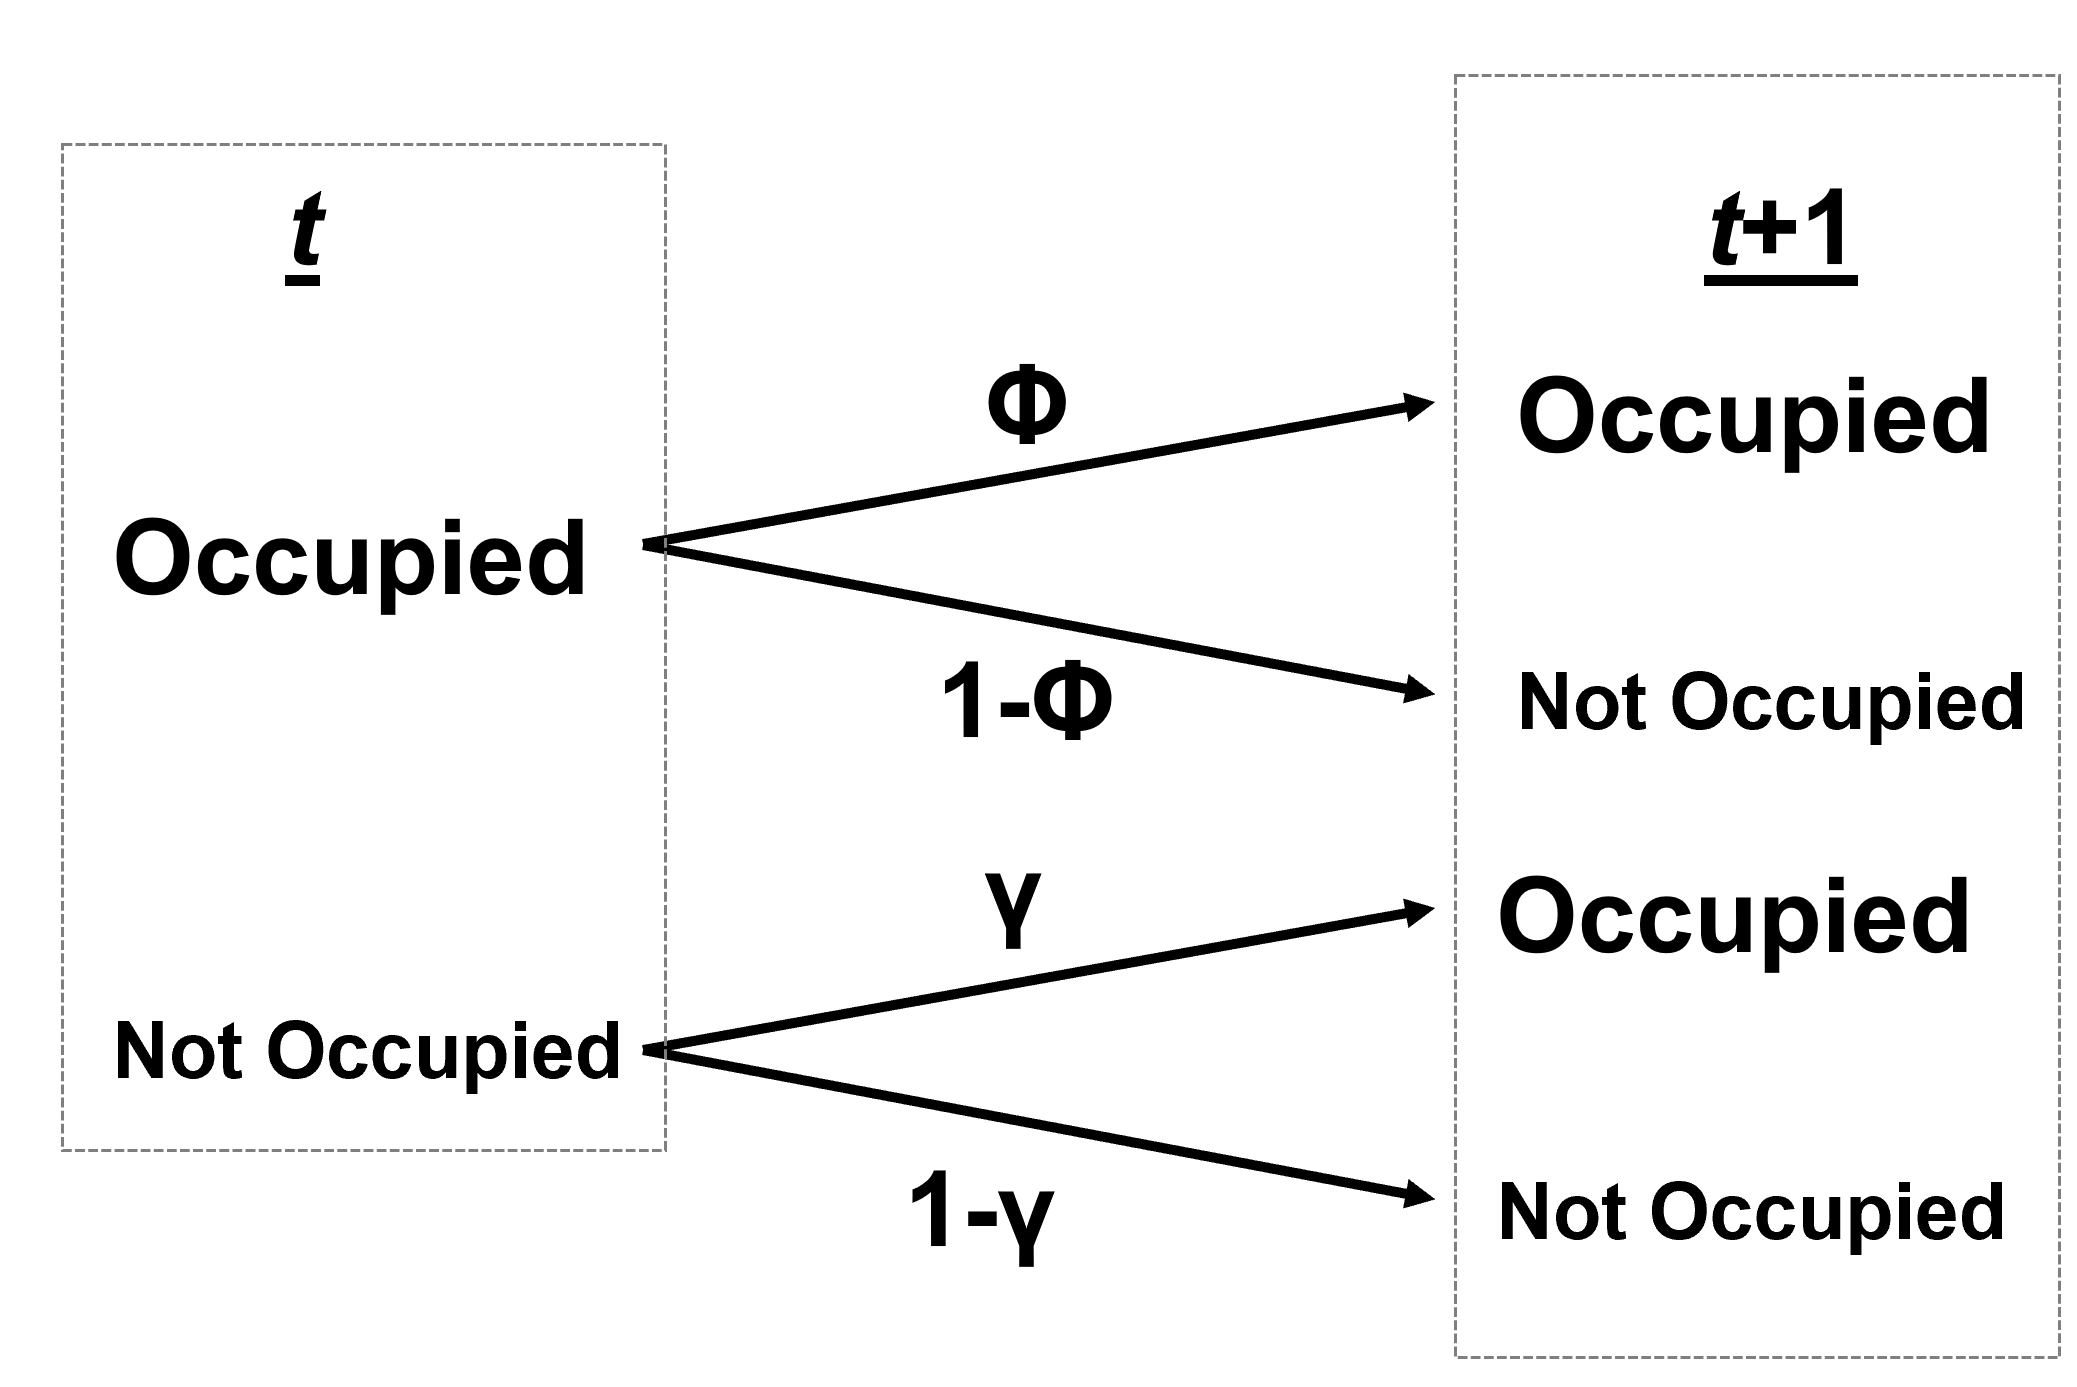
Persistence Probability (Phi)
The probability that a population that is present at a site will still be at the site at the next time-step
= 1- extinction probability
Colonization Probability (Y, upsilon)
The probability that an unoccupied site will be colonized between t and t+1
= 1-non-colonization probability
Effect of Markovian Process on Latent State (now Zi,t)
= Bernoulli(Zi,t-1 * Phi i,t-1 ((1-Zi,t-1) * Upsilon i,t-1)
Two elements because can either persist or be colonized and that depends on if was present in the previous time-step
Notes for persistence and colonization probability
Persistence based only on island size (logit(Phi) = B0,phi + B1,phi*size)
Colonization based only on distance to mainland (logit(Upsilon) = B0,up + B1,up *size)
How to Alter Metapopulation Preferences/Groups
Trap → Sink, remove cue (drop habitat preference)
Trap→ Source, improve habitat (improve quality)
Perceptual Trap/Undervalued Resource → Source, introduce cue (improve preference)
Wolf Monitoring
Field-Intensive (verify packs, counts, collars)
Issues with Intensive Monitoring
Challenging
Costly
Less funding
No longer Viable
Minimums don’t reflect full picture of population
Patch Occupancy Model
Divide region into grid with cells the size of a pack’s range
Classify with presence/absence using…
Uncertain detections (public wolf sightings)
Certain Detections (field monitoring and pack locations)
Create week-by-week ENCOUNTER HISTORIES to estimate probability of occupancy
Use Territory Size and Pack Size to estimate number of individuals
Integrated Patch Occupancy Model Sub-models (3)
Occupancy Model
Territory Model
Group Model
Territory Covariates (4, 1 max, 3 min)
Maximize:
Food (higher density, smaller territory)
Minimize:
Competition (higher density, smaller territory)
Travel
Mortality Risk (human density increase, smaller territory)
Suggests wolves select ECONOMICALLY
Pack Size Covariates (4)
Prey abundance and vulnerability (higher density, smaller size)
Pack densities (higher density, higher size)
Mortalities/Risk Factors (more removals/hunting, smaller size)
Terrain (higher ruggedness, smaller size)
Wolf iPOM Model Elements
Occupancy Model: area occupied
Territory Model: territory size
Group Model: Pack size*#packs*dispersers/loners
Integrated Patch Occupancy Model Benefits (4)
Requires limited data possible
Improved accuracy over outdated counts
Predicts over many spatial scales
Biologically based
Compensatory Mortality
Removal of animals that were more likely to die anyways or less likely to contribute to population growth (males)
Increases number of resources for remaining individuals
Compensatory Natality
Removing animals increases fecundity of remaining animals
Spotted Owls
High pair and site fidelity, high adult survival, BUT low fecundity
“Nest” in shallow depressions of existing structures like debris platforms or tree deformities, in stands with high canopy closure
Timeline of Spotted Owl Conservation
1977 preservation of old growth forests became a priority
1981 calls for 1000-acre buffer around every owl
1990 Listed as threatened and declines persist. Caused massive timber logging declines. Emergence of barred owl encroachment
Issues Facing Spotted Owls (3)
Climate change
Habitat loss
Interspecific competition
Ecosystem resilience
The ability for an ecosystem to persist through and/ or regenerate after a disturbance event.
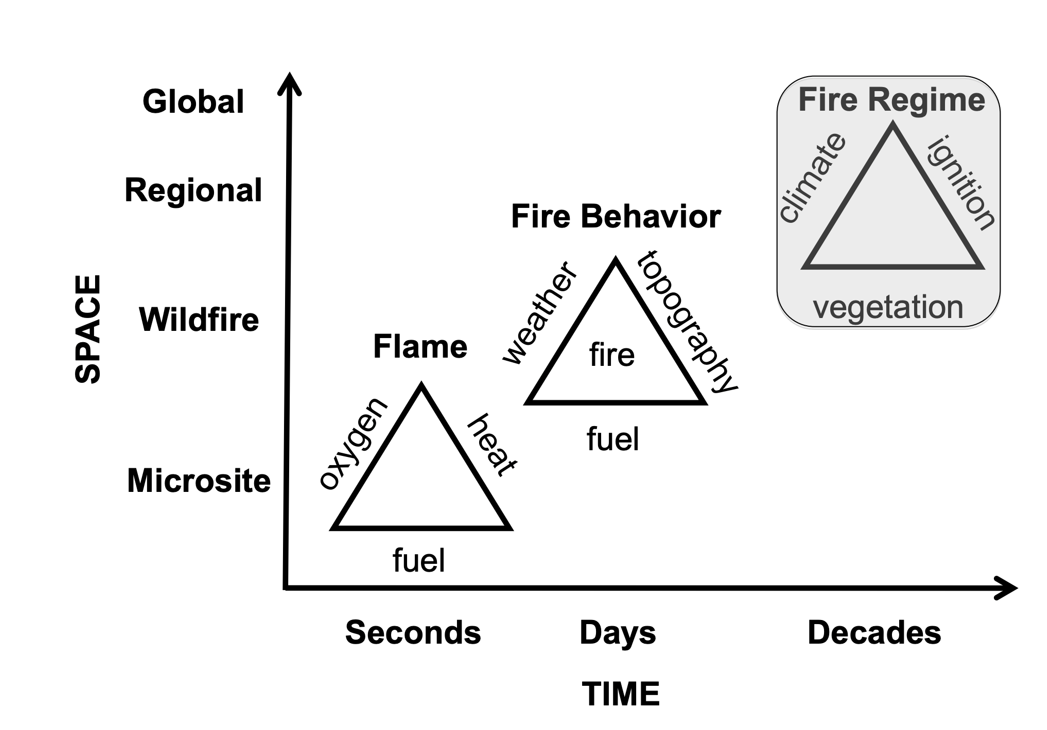
What Makes Fire (3)
Heat
Oxygen
Fuel
Is a self-sustaining chemical reaction
Elements for Fire Regimes Across Time and Space
Microsite, Seconds (Flame): Heat, Oxygen, Fuel
Wildfire, Days (Fire Behavior): Weather, Topography, Fuel
Regional/Global, Decades (Fire Regime): Climate, Ignition, Vegetation
Benefits of Fire (6)
Clean/clear landscape
Ceremonial/Medicinal
Manipulate Plant Traits
Pest Management
Animal Gathering
Prevent Destructive Fires