Economics, Microeconomics 2.5-2.6 Elasticities
1/46
Earn XP
Description and Tags
Name | Mastery | Learn | Test | Matching | Spaced | Call with Kai |
|---|
No study sessions yet.
47 Terms
Elasticity measures
how much demand or supply changes when there is a change in one of the determinants--it is a measure of responsiveness
Price Elasticity of Demand (PED)
is a measure of how much the quantity demanded of a product changes when there is a change in price
If quantity demanded is highly responsive to a change in price
it is said to be price elastic
If quantity demanded is not very responsive to a change in price
it is referred to as price inelastic
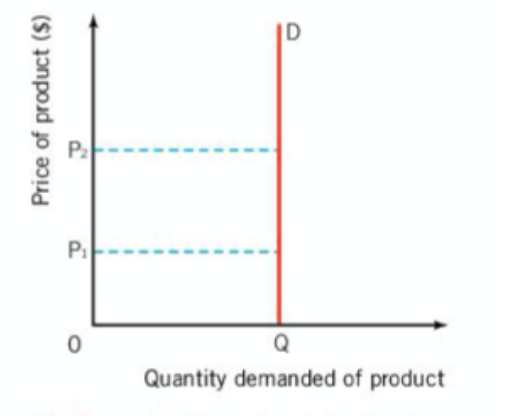
if PED is 0
it is perfectly inelastic
A change in price will have no effect on quantity demanded
Therefore, the demand curve will be vertical
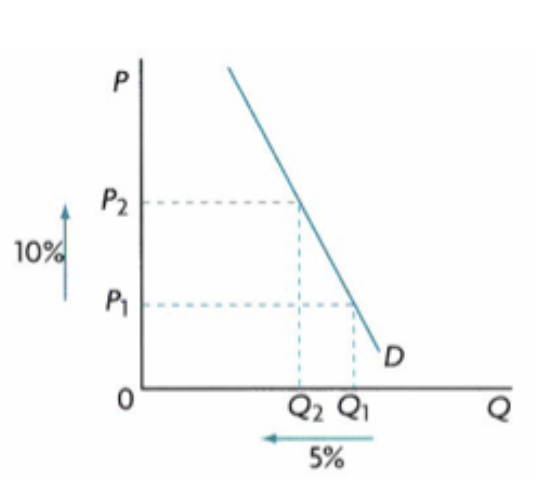
If PED is greater than zero but less than one
it is said to be price inelastic
A change in price will lead to a proportionally smaller change in quantity demanded
An increase or decrease in price will not have a major effect on quantity
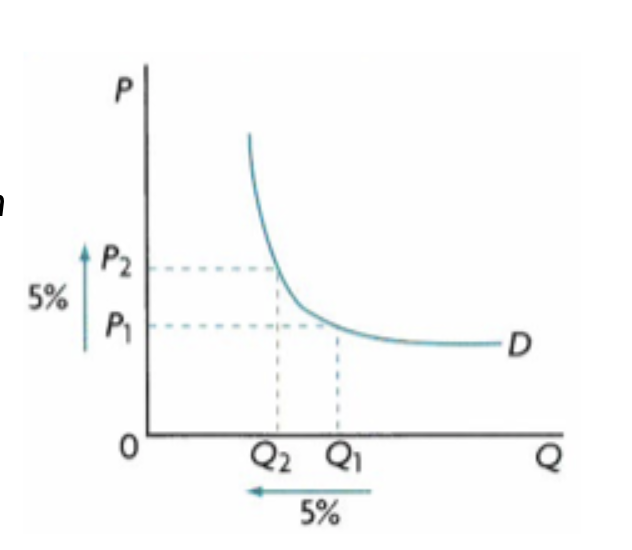
If PED is equal to 1, it is said to be
unit elastic
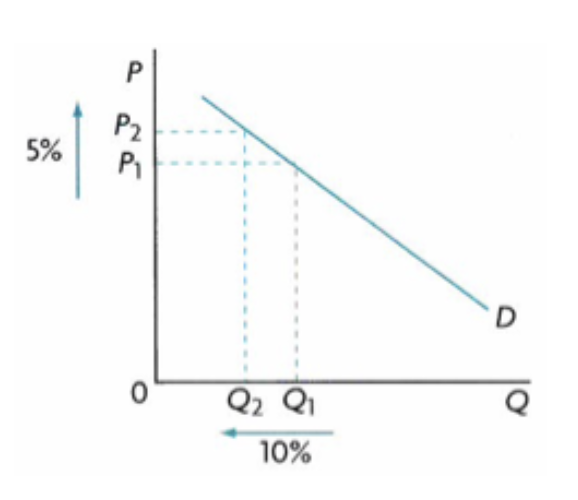
If PED is greater than 1, but less than infinity it is
price elastic
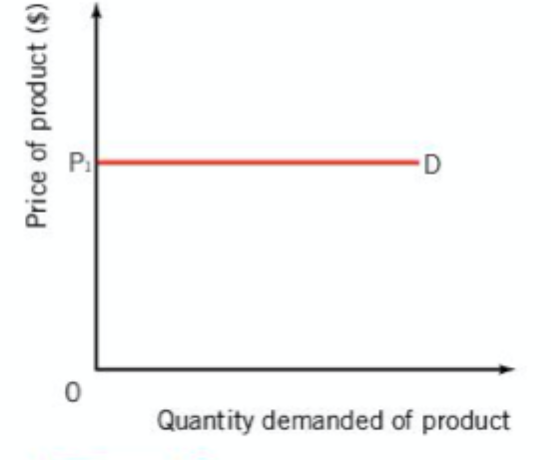
If PED is ∞, it is
perfectly elastic
the slope or “steepness” of the demand curve is
NOT a measure of elasticity
low-priced products have a more inelastic demand than high-priced products, because
consumers are less concerned when the price of something cheap increases than when the same occurs for something more expensive
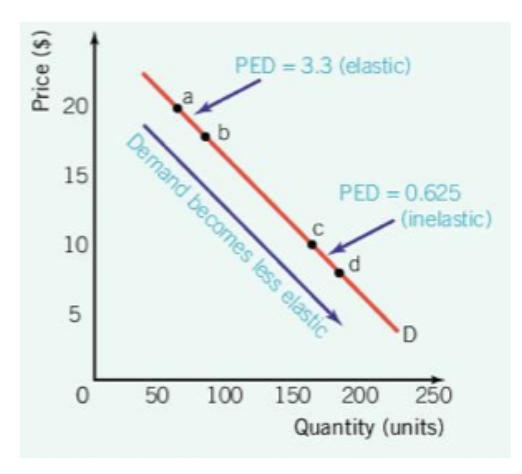
PED values change
along a straight-line demand curve
Determinants of PED (TINS)
The T stands for
Time period considered
As price changes, it takes consumers time to adjust consumption habits. PED is more inelastic in the short run, but more elastic in the long run
Determinants of PED (TINS)
The I stands for
Income (proportion of)
If a good costs little, and takes only a small proportion of a consumer’s budget, a change in price may cause very little change in quantity demanded (and vice versa)
Determinants of PED (TINS)
The N stands for
Necessity of the product
The higher the necessity of the product, the more inelastic it will be (e.g., food, water, housing, etc.)
Determinants of PED (TINS)
The S stands for
Substitutes (number and closeness of)
The more substitutes there are for a product, the more elastic it is likely to be
Products with few (or no) substitutes will have more inelastic demand
the knowledge of PED allows firms to
predict the effects of their pricing decisions on quantity demanded and on total revenue
Price elastic: Higher price = less revenue, and vice versa
Price inelastic: Price and revenue move in the same direction
the knowledge of PED allows governments to
predict the consequences of imposing taxes on certain goods (taxes always increase the price of goods)
e.g., a tax on alcohol (inelastic) will increase tax income, while a city tax on soda (elastic) will result in less tax income (people switch to substitutes, or travel to get their soda)
primary commodities are raw materials (e.g., cotton, wood, oil, agricultural products, etc.)
These goods are
highly inelastic because they are necessities and have few or no substitutes
small fluctuations in the supply of primary commodities can result in
large price fluctuations (price volatility) for manufacturers, and can negatively affect producer incomes
Manufactured goods are finished products (e.g., hamburgers, pens, furniture items, etc.)
These goods are
more elastic because of the availability and closeness of substitutes
due to larger availability and substitutes this results in
smaller price fluctuations
Income elasticity of demand (YED)
a measure of how much the demand for a product changes when there is a change in consumer income
YED values correspond to the
elasticity of demand for certain types of goods
Necessity goods (0 < YED < 1)
These goods are highly inelastic, and demand will change little if income rises (e.g., bread, rice, milk, etc.)
Luxury goods (YED > 1
These goods are highly elastic, as demand changes significantly as income rises (e.g., nonessentials such as foreign holidays, jewelry, luxury cars, etc.)
Inferior goods (YED < 0)
Demand decreases as income increases (e.g., used clothing, store-brand foods, etc
The YED value for inferior goods is negative because of
the inverse relationship between demand and income
The Engel Curve illustrates the relationship between
income and quantity demanded
the engel curve shows
whether a good is normal or inferior, and whether the good is income elastic or inelastic
firms having knowledge of YED helps
firms target certain consumer groups when planning on which market to enter and which product to sell (e.g., smartphone sales in developing economies)
Firms often sell different versions of products to cater to different income levels; YED allows them to make production decisions
As a general rule, the higher the YED, the greater the expansion of the future market (and vice versa)
governments having knowledge of YED helps
explain sectoral changes in the economy
Economic production is usually divided into three sectors: primary (raw materials), secondary (manufacturing), and tertiary (services)
As incomes grow and living standards increase, the secondary and tertiary sectors often increase output, and this is reflected by the high YED values for products produced by those sectors
Price elasticity of supply (PES)
a measure of responsiveness to supply when there is a change in price
there is a positive relationship between price and quantity supplied, so PES values will always be
positive
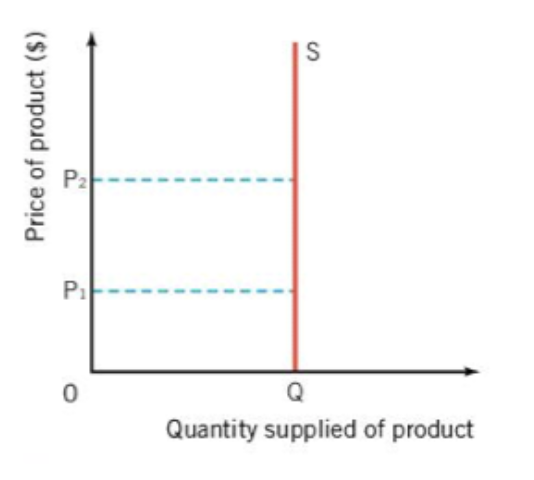
If PES is 0, it is
perfectly inelastic
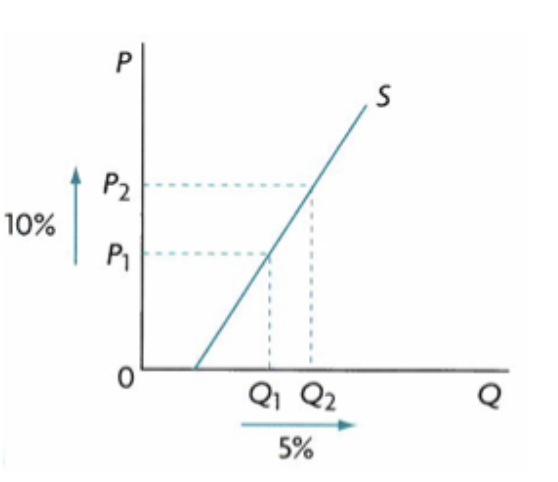
If PES is greater than zero but less than one, it is
price inelastic
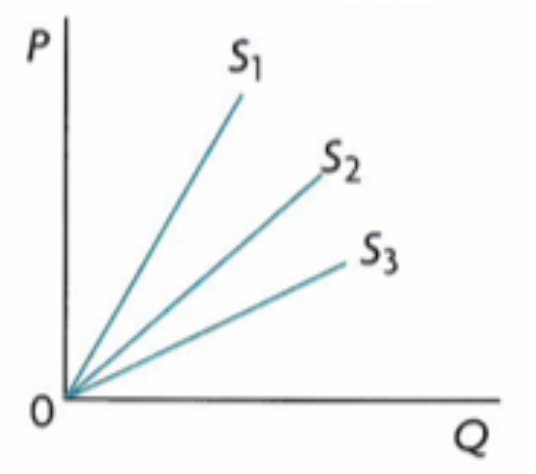
If PES is equal to 1, it is
unit elastic
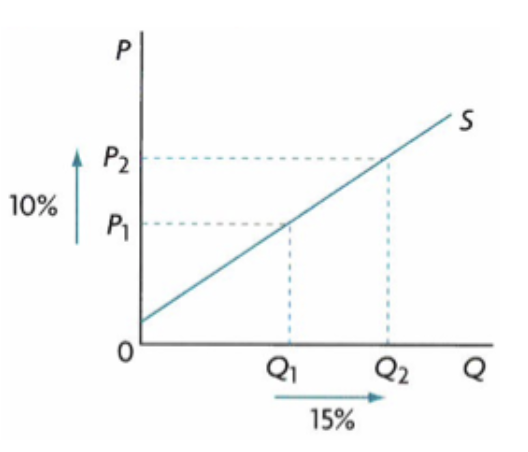
If PES is greater than 1, but less than infinity, it is
price elastic
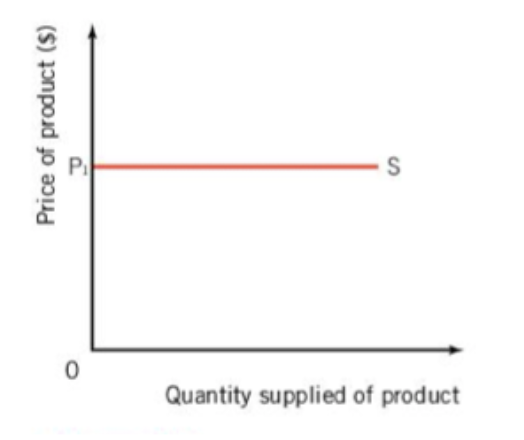
If PES is ∞, it is
perfectly elastic
Determinants of PES (FACTS)
the F in facts stand for
Factors of production (mobility)
The more easily and quickly resources can be shifted towards producing another product, the greater responsiveness of quantity supplied to changes in price (higher PES, more elastic)
E.g., farm workers can more easily move from corn to strawberry production than from farm work to car production
Determinants of PES (FACTS)
the A in facts stand for
Ability to store stocks
Firms that have the ability to store stocks, and therefore more quickly supply a product in response to price changes, have a higher PES for their products (more elastic)
Remember, some products can’t be stored for very long because they go bad! (e.g., milk, cheese, fruit, grains, etc.)
Determinants of PES (FACTS)
the C in facts stand for
Costs (rate of increase)
If costs increase rapidly, then PES will be inelastic because of the firm’s inability to increase their output in the short run , and they will not want to incur higher costs of production
Firms will be better able to increase their output if costs increase slowly, so PES will be more elastic
Determinants of PES (FACTS)
the T in facts stand for
Time
The amount of time firms have to adjust their output in response to changes in price
Over a short time, it is more difficult for firms to adjust output, so supply will be highly inelastic
Over a longer period of time, firms are better able to adjust output, so supply becomes more elastic
Determinants of PES (FACTS)
the S in facts stand for
Spare capacity of firms
Sometimes firms have unused factors of production (e.g., factories or equipment that remain unused for a period of time)
If the firm can utilize unused factors of production to adjust output in response to price changes (elastic), but if all factors are being used then it will be more difficult to respond (inelastic)