AP Human Geo
1/53
There's no tags or description
Looks like no tags are added yet.
Name | Mastery | Learn | Test | Matching | Spaced |
|---|
No study sessions yet.
54 Terms
Physical Geography
the study of natural processes and natural things in the environment like landforms, climate, plants, and animals.
Human Geography
The study of how humans understand, alter, and use earth.
Spatial Perspective
where things are located and why they're there
Ecological perspective
the relationships between living things and their environment
location
where something is on earth
absolute location
the exact location of something (example: coordinates or an address)
Relative location
where something is in relation to the things around it (Example: by the mcdonalds)
place
a location on earth that is distinguished by its physical and human characteristics
site
a place's absolute location and physical characteristics, such as landforms, climate, and resources
situation
a place's connections to other places, such as transportation routes, political associations, and cultural economic tiles
Mental maps
an internalized representation of a place (a map in your head from memory)
Space
the area between two or more areas on earth's surface
distribution
how things are arranged within a given space
density
the number of things in a specific area
pattern
how things are arranged in a particular space
concentration
clustered vs. dispersed
flow
the movement of people, goods, or information from one place to another
distance decay
a principle that says the farther away one thing is from another, the less interaction the two things will have
time space compression
the shrinking of relative distance between places due to advances in transportation and communication
environmental determinism
the belief that the physical environment places limitations on human activity
possibilism
the belief that the physical environment may limit some human activity, but humans ultimately have the ability to adjust and adapt to their environment
sustainability
the use of earth's land and natural resources in ways that ensure they will be available in the future
scale
the area of the world being studied
geographic scale
the size at which a map's data is being represented (Large scale, medium scale, and small scale)
Large scale map
very detailed map with tons of information (example: a detailed map of a town)
medium scale map
a medium amount of info (Example: a map of a state that lists major cities)
small scale map
very little detail (example: A map of the US)
region
an area of earth's surface with certain characteristics that distinct it from other areas (Formal, functional, and perceptual/vernacular)
formal region
an area with one or more shared traits (Example: A state or country)
functional region
an area organized by its function around a node
perceptual/vernacular region
a region defined by people's feelings or attitudes about the area (example: the midwest)
node
the center or hub of a functional region
globalization
the expansion of economic, cultural, and political processes on a worldwide scale
Wallerstein's World Systems Theory
1. The world economy has one market and a global division of labor.
2. Although the world has multiple states, almost everything takes place within the context of the world economy.
3. The world economy has a three-tier structure. (Peripheral, Semi-peripheral, Core)
sustainable development
development that meets the needs of the present without compromising the ability of future generations to meet their own needs
Qualitative data
interpretations of data sources
quantitative data
information measured by numbers
census
an official count of the number of people in a defined area
Geographic Information Systems (GIS)
sophisticated mapping systems that capture, store, organize, and display geographic data that can then be used to configure simple and complex maps
Remote sensing
a way of collecting data without making physical contact (Example: satellites, aircraft, etc)
Global Positioning Systems (GPS)
an integrated network of at least 31 satellites in the US system that orbit earth and transmit location data to the handheld receivers
Map Projections
any method used to represent the world or part of the world in two dimensions
Map scale
the mathematical relationship between the size of a map and the part of the world it shows
reference maps
generalized sources of geographic data and focus on location
thematic maps
maps focused on a particular topic or theme
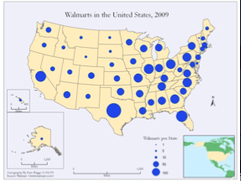
Graduated symbol map
Differently sized symbols are used to indicate quantitative data, such as gasoline consumption or earthquake magnitude.
Larger sizes indicate more of something, and smaller sizes indicate less.
Cartogram map
show the relative size of an area based on a particular attribute, such as population.
Cartograms are useful because they allow for data to be compared, and distance and distribution are also visible.
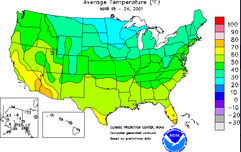
isoline map
Lines connect data points of the same value.
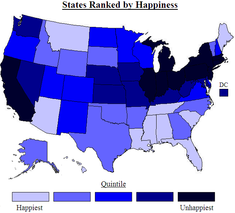
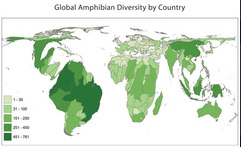
choropleth map
uses colors or shading to represent categories of data for areas such as census tracts, counties, or states. Choropleth maps are useful for showing quantitative data such as election results.
They often show data in defined areas.
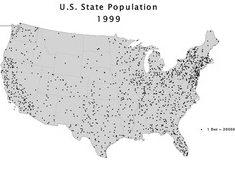
dot map
Dots are used to show locations of observations or events, such as the distribution of milk cows across the United States.
Each dot represents a specified quantity.
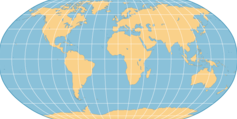
Robinson Projection
The shapes of the continents become more distorted farther away from the equator or the map's central meridian.
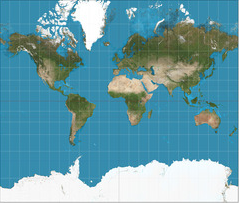
Mercator Projection
The continents' shapes are maintained and direction is displayed accurately, but the sizes of the continents are very distorted.
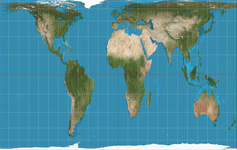
Gall-Peters Projection
The relative size of the continents is more easily displayed than with other projections, but the shape of the continents is distorted.
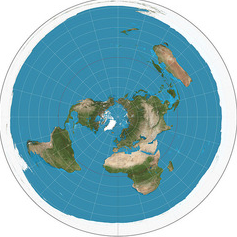
Azimuthal Projection
A flattened disk-shaped portion of Earth is shown from a specific point.