Data Science Fundementals 2-2
1/53
There's no tags or description
Looks like no tags are added yet.
Name | Mastery | Learn | Test | Matching | Spaced | Call with Kai |
|---|
No analytics yet
Send a link to your students to track their progress
54 Terms
___ learning should be used for a ML model predicting a value.
Supervised
___ learning should be used for a ML model not predicting a value.
Unsupervised
A supervised learning model finding a discrete value is performing ___.
Classification
A supervised learning model finding a continuous value is performing ___.
Regression
An unsupervised model trying to fit data into discrete groups is performing ___.
Clustering
An unsupervised model making a numeric estimate is performing ___.
Density Estimation
Supervised Learning
Learning from data with known outcomes.
Unsupervised Learning
Learning from data with unknown outcomes.
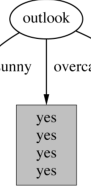
Step 1 of making a decision tree:
Calculate entropy of the target variable.
Step 2 of making a decision tree:
Split the dataset and calculate the entropy for each sub-set. Add the entropies together and compare to the original entropy.
Step 3 of making a decision tree:
Choose the attribute with the smallest entropy as the decision node. Repeat the steps again.
Entropy/Uncertainty
The amount of information lost for a decision.
The best attribute to split a decision tree with is the one that produces the ___ tree.
Smallest
Decision Node Purity
The amount of outcomes a decision can possibly have.
Is this decision pure?
Yes
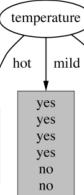
Is this decsision pure?
No
The attribute with the ___ entropy should be selected.
Lowest
Informationed Gained =
Info(D)-Info_A(D) where Info(D) is the old entropy and Info_A(D) is the new entropy.
k-Nearest Neighbors
A supervised learning algorithm that uses a distance-based algorithm to cluster tuples.
The k in k-NN stands for:
The number of neighbors each cluster should have.
Step 1 of k-NN:
Decide on the similarity metric, then split the dataset into training and testing data. Pick an evaluation metric.
Step 2 of k-NN:
Run k-NN a few times, changing k each time.
Step 3 of k-NN:
Choose the “best” k.
k-Means
An unsupervised learning algorithm that clusters similar objects.
Step 1 of k-Means:
Pick a k number of random points to be the centroids.
Step 2 of k-Means:
Assign each data point to the centroid closest to them.
Step 3 of k-Means:
Move the centroids to the average location of all the data points in their cluster. Repeat steps 2 and 3 until all centroids move little to none.
It is possible for k-Means to fall into an ___.
Infinite Loop
Random Forest
A collection of decision trees.
Social Network
A collecion of actors and relations.
Social Actor
A single unit in a social network.
Social Dyad
A pair of actors.
Social Triad
A triplet of actors.
Social Subgroup
A subset of a social network.
Social Relation
A relational tie between actors.
Social Ego Network
The “part of the network surrounding a single actor.”
When presenting to a project sponsor, the presentation should be:
Short, technically simple, and have the results introduced early into the presentation.
When presenting to an end user, the presentation should be:
Focused on how the model improves their day-to-day lives and how to use the model.
When presenting to other data scientists, the presentation should be:
Technically complex and brutally honest about the limitations and assumtions of the model.
True Positive (TP)
Predicted Posivite, Actually Positive
True Negative (TN)
Predicted Negative, Actually Negative
False Positive (FP)
Predicted Positive, Actually Negative
False Negative (FN)
Predicted Negative, Actually Positive
F_1-Score =
2 \times \frac{\text{precision} \times \text{recall}}{\text{precision} + \text{recall}}
Precision =
\frac{TP}{TP+FP}
Recall =
\frac{TP}{TP+FN}
Accuracy =
\frac{TP+TN}{TP+TN+FP+FN}
Linear Regression =
f(x)+b where f(x) is the slope and b is the error term.
Multiple Linear Regression =
f(0)+f(1)i_1+…+f(n)i_n+b where f(x) is the slope and i is the independent variable
Underfitting
When the model’s predictions doesn’t come close to matching the actual data.
Overfitting
When the model’s predictions matches the testing data too well and underperforms in the real world.
Data Leakage
Training data shown to the model that wouldn’t be available in the real world.
Support Vector Machines
A supervised classification model that seperates data into two groups based on finding a line with the maximum distance between both points.
Residuals =
x - \hat{x} where x is the original and \hat{x} is the prediction