AICP Section 1.B - Research and Assessment
1/11
Earn XP
Description and Tags
Spatial Analysis
Name | Mastery | Learn | Test | Matching | Spaced |
|---|
No study sessions yet.
12 Terms
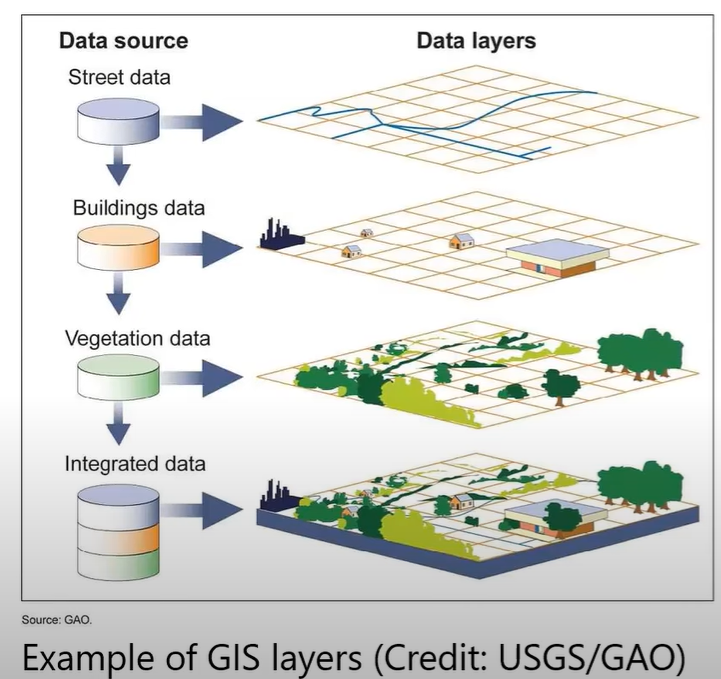
GIS (Geographic Information Systems)
Used to capture, store, manipulate, analyze, manage, and present spatial or geographic data. GIS helps planners visualize and interpret data to understand spatial relationships, patterns, and trends, facilitation informed decision-making.
Related: Location analysis, GIS software, GIS hardware (computer equipment), GIS software, GIS data and metadata, layers and overlays (shapes and data), spatial analysis (e.g. buffering, modelling, etc.), suitability analysis, GIS in plan and scenario development, ESRI (company)
GIS Layers (Example)
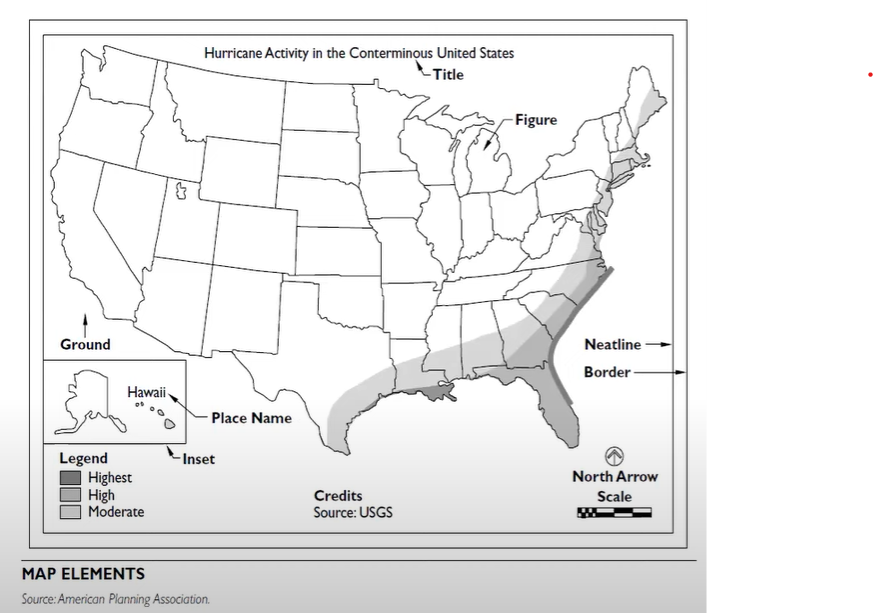
Mapping
Creating visual representations of spatial data to illustrate various aspects of the community, such as land use, transportation networks, demographics, and environmental features, aiding in the planning and analysis of the community.
Related: Location analysis, GIS software, GIS hardware (computer equipment), GIS software, GIS data and metadata, layers and overlays (shapes and data), spatial analysis (e.g. buffering, modelling, etc.), suitability analysis, GIS in plan and scenario development, ESRI (company)
Elements of a map (Example)
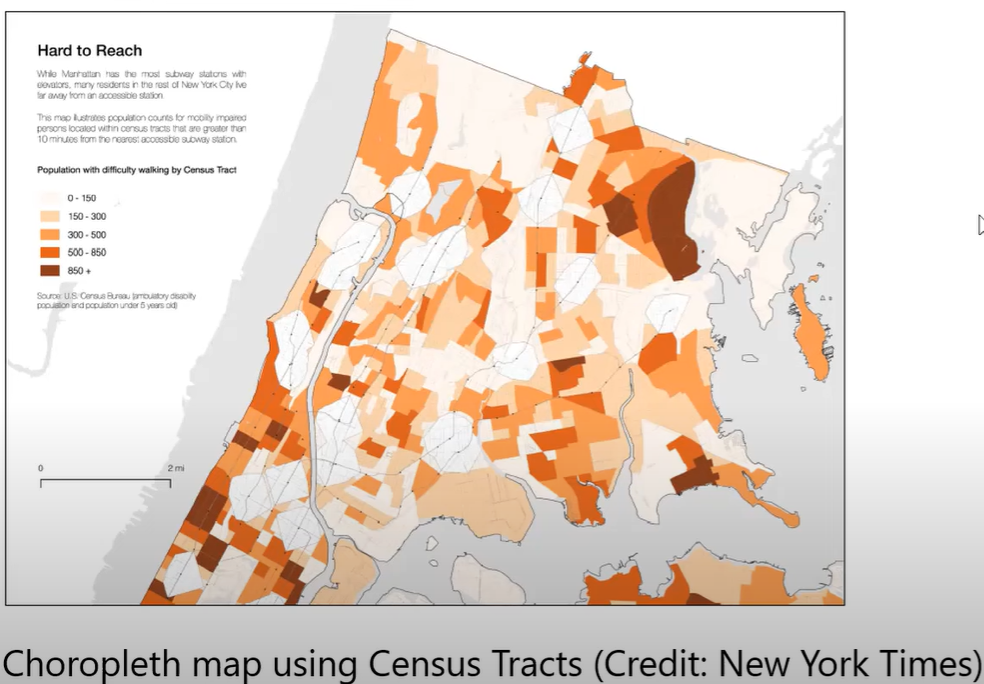
Choropleth Map
A type of thematic map that uses color or shading to represent statistical data across predefined geographical areas, making it easier to visualize variations in data such as population density or election results.
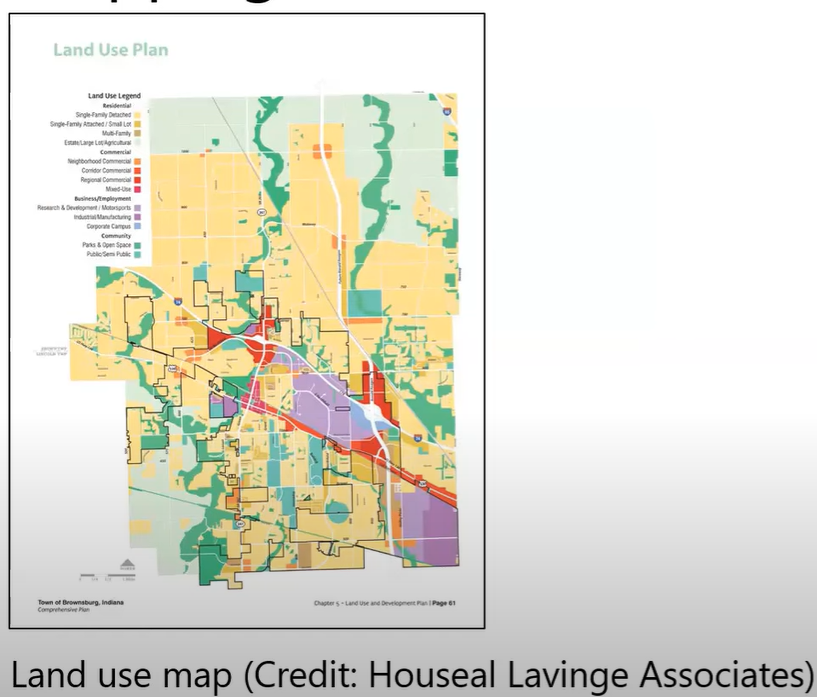
Land Use Map
A visual representation that displays different land use categories within a specific area, showing how land is allocated for residential, commercial, industrial, agricultural, and recreational purposes.
Public Land Survey System (PLSS) - Township/Range Schematic
From principal meridian and baseline
Township - 36 square miles
Section - 1 square mile
Range - Numbered 1-36 within section
(Example is T2S-R3W-S14-NE ¼ NW ¼)

Interpretation
Analyzing and explaining the meaning of spatial data and patterns. Planners use interpretation to derive insights from maps and GIS data, informing decisions related to land use, zoning, transportation, and environmental planning.
Related: Data analysis, spatial patterns, data interpretation, spatial insights, urban planning decisions, geographic analysis, land use interpretation, zoning analysis, transportation planning, environmental interpretation, aerial photographs, orthophotos, remote sensing, satellite image classification, topographic maps, property maps, parcel maps, cadastral maps
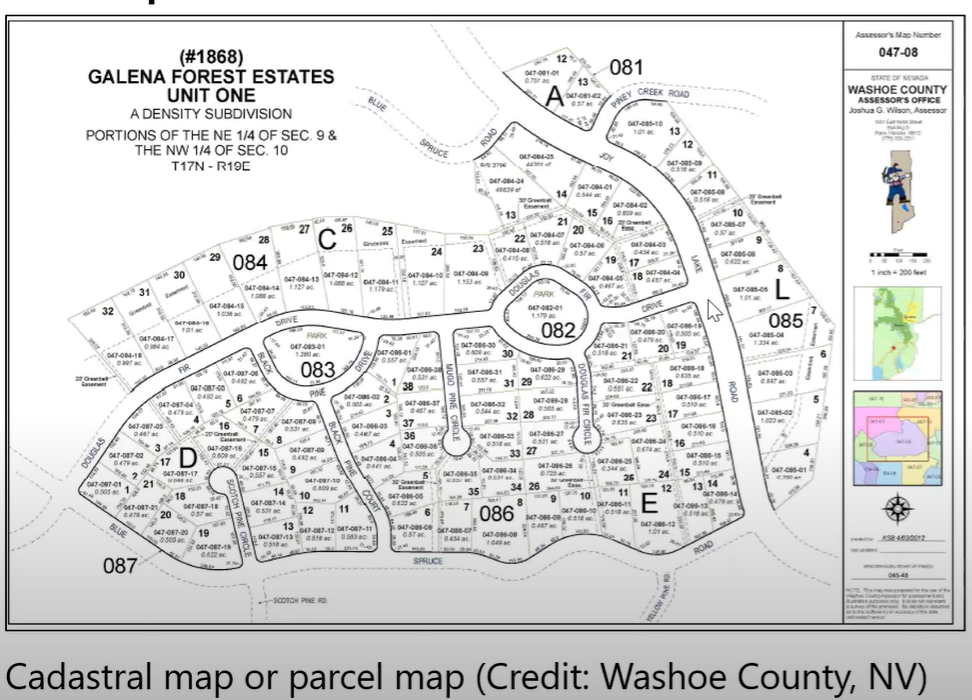
Cadastral Map (Example)
3D Visualization
Three-dimensional representations of urban spaces to better understand and communicate spatial relationships and design concepts. Technology aids in visualizing buildings, terrain, infrastructure, and proposed developments in a realistic manner
Related: 3D modeling, walk-through models, virtual reality, digital twins
Modeling
Procedural, figurative, and computational representations of urban environments to simulate and analyze spatial dynamics. Models can predict the impact of various planning scenarios on transportation, land use, environmental sustainability, and urban growth.
Related: Urban dynamics, SimCity (let’s goooooo), digital twins