pV Diagrams
1/20
There's no tags or description
Looks like no tags are added yet.
Name | Mastery | Learn | Test | Matching | Spaced | Call with Kai |
|---|
No study sessions yet.
21 Terms
pV Diagram
A graph of pressure vs volume showing the thermodynamic behavior of gas, including isotherms (constant-temperature curves)
Isotherm
A curve on a pV diagram representing the relationship between pressure and volume at a constant temperature.
pV = nRT = constant
Equation for an ideal gas isotherm
It is a rectangular hyperbola
How does the ideal gas isotherm looks graphically?
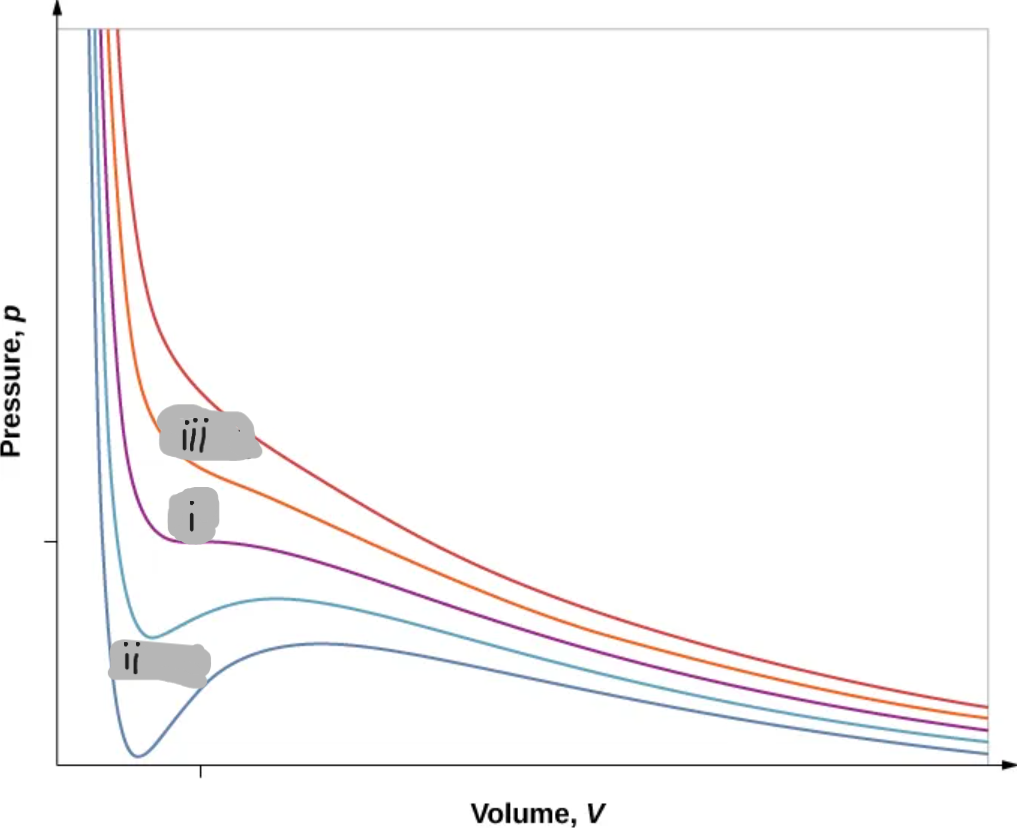
Van der Waals Isotherm (Below Tc)
Shows a “hump” where pressure increases with volume
An unphysical region corresponding to liquid-gas transition
Corrected by a horizontal line (constant pressure during boiling/condensing)
Tc
(i)

T < Tc
(ii)

T > Tc
(iii)
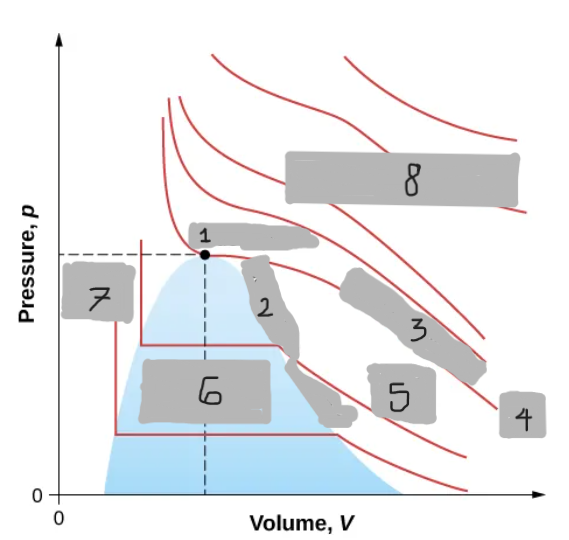
Critical Point
(1)

Saturation Curve
(2)

Critical Isotherm
(3)

Tc
(4)

Vapor region
(5)

Liquid-vapor region
(6)

Liquid region
(7)

True but not ideal gas
(8)
Critical Temperature
Maximum temperature at which a liquid phase can exist. Above this, the substance becomes a supercritical fluid with no distant liquid-gas boundary.
Critical Pressure
The pressure required to liquify a gas at the critical temperature.
Critical Point
The specific combination of critical temperature and critical pressure where liquid and gas phases become indistinguishable.
Supercritical Fluid
A phase above the critical pint with liquid-like density but gas-like flow, not condense or by pressure alone.
Niacin (Vitamin B3)
C6NH5O2