BF Ch11 capital budgeting and risk
1/19
There's no tags or description
Looks like no tags are added yet.
Name | Mastery | Learn | Test | Matching | Spaced | Call with Kai |
|---|
No analytics yet
Send a link to your students to track their progress
20 Terms
the IRR and NPV analysis of an investment porject should reflect …
the riskuness of the project
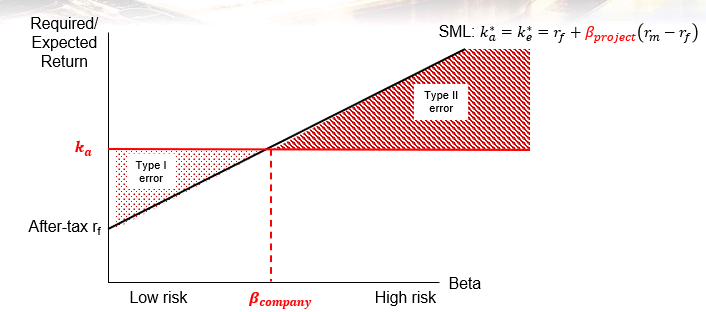
the Ka = WACC should be hustified for project risk
→ risk adjustment discount rate (RADR) = k*a = WACC*
why should we adjust for project risk and use K*a or RADR
if we use Ka (instead of K*a) for all investment projects we will
reject low-risk projects that should be accepted
accept high-risk projects that should be rejected

low project risk : project risk < company risk
K*a < Ka
cost improvement projects
typical prokect risk : project risk = company risk
K*a = Ka
expansion of existing business
high porject risk : project risk > company risk
K*a > Ka
speculative ventures
how do we calculate the approprate BETA project ?
can be observed as the company beta of a company for which the existing buisness is similar to the investment project
reflects : operational risk + financial risk of the observed company
unleveranged project Beta
removes the financial aspect of the Beta (of the observed leveranged beta)
leveranged project Beta
add the financial risk of the investing company
IRR and NPV analysis only adjust for (what type of risk)
market risk via the beta
total risk
specific risk (the risk of firm specific events)
+ maret risk (the sensivity to general economic events)
when does specific risk matters
for investors that do not or cannot diversify, like owners of small firms or employees
when firm failure (due to dramatic firm-specific events) reuslts in negative social effects, like bank failure, infrastructure failure or healthcare failure
techniques that consider TOTAL risk
NPV-payback approach
simulation approach
scenario analysis
sensitivity analysis
certainty equivallent
NPV-Payback approach
a project must have a positive NPV and a payback period of less than a critical number of years to be acceptable
the longer the payback period the higher the probability of a firm-specific project failure
simulation approach
estimate probability distribution of each input variable (price, number of units sold, unit production costs, unit selling cost, annual depreciation)
combine input variables into a mathematical model to compute the NPV of the project
select at random a value of each input, based upon the probability distribution (step 1)
repeat step 3 and 4 many times to arrive at the following : the project expected NPV (mean), the standard deviation of the NPV

scenario analysis
considers the impact of simultaneous changes in the input variables on the acceptability of an investment project
define the different scenarios based on the sumultaneous values of the input variables : an optimistic, a pessimistic and a most likely scenario
estimate the probability of each scenario
compute the NPV under each scenario
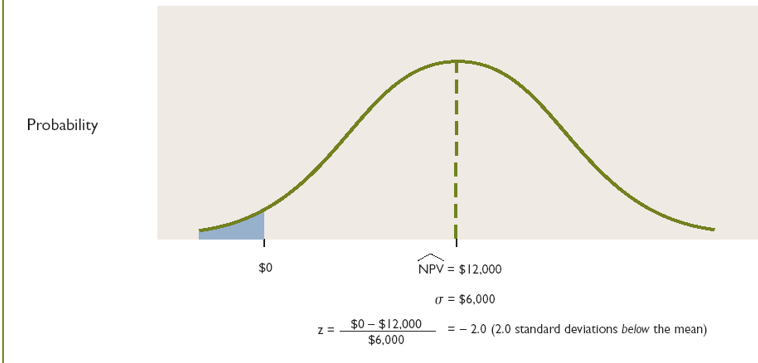
compute the expected NPV
compute the standard deviation
compute the z-score and associated probability of failure
sensivity analysis
involves systematically changing each input variable separately to identify which input variables have the most impact on the NPV → identifying the KEY VARIABLES
putting additional efforts in the estimation and or improvement of the key variables
wat doen we bij verschillende risiconiveaus
certainty equivalent approach (aanpassing cashflow)
risk adjustment discoynr rate (RADR) (wijziging risicovoet)
→ beta (un) leveraged
at =
certainty equivalent factor
tussen 0 en 1
hoe hoger at hoe zekerder de cash flow
cashflows verder in de toekomst hebben een lagere at → wegen dus minder zwaar door op de NPV
als een onderneming een risicovol project uitvoert, gaan de investeerders hun …. aanpassen
vereist rendement Ke
B leveraged
operationeel risico + financieel risico