IB Biology Year One Review
1/61
Earn XP
Description and Tags
Name | Mastery | Learn | Test | Matching | Spaced |
|---|
No study sessions yet.
62 Terms
Which organism would be classified as a saprotroph?
A. A single-celled eukaryote that obtains its carbon compounds by photosynthesis and ingestion of other single-celled organisms
B. A jellyfish that uses the stinging cells in its tentacles to paralyse its prey, which is passed to an internal gastric cavity through a single opening
C. A fungus that feeds by secretion of digestive enzymes onto its food and absorption of digested material
D. A dung beetle that feeds on the fecal material left behind by other animals
C) A fungus that feeds by secretion of digestive enzymes onto its food and absorption of digested material
Over time, the hull of a sunken ship may become colonized by a wide range of marine organisms.
What term is used to describe all of the organisms living in and on a sunken ship?
A. A community
B. An ecological niche
D. A population
D. An ecosystem
A) A community
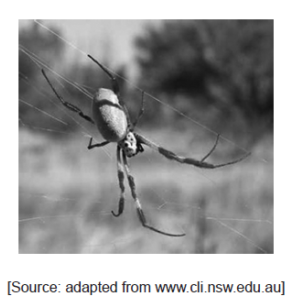
The image shows a female Golden Orb-weaving spider (Nephila plumipes). They can grow as large as 4 cm and build webs strong enough to trap small birds for food.
Which of the following describe(s) this spider?
I. Primary consumer
II. Heterotroph
III. Arthropod
A. I only
B. I and II only
C. II and III only
D. I, II and III
C) II and III only
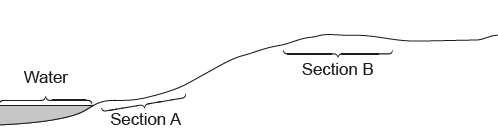
The image shows a transect through a stream and a field.
Which calculation would test for the association between two species of plants from quadrat data from section A and section B of the field?
A. Correlation coefficient
B. Random numbers sampling
C. Standard deviation
D. Chi-squared
D. Chi-squared
Which are characteristics of a species?
I. The potential to interbreed to produce fertile offspring
II. The formation of a population with members of the same species within a community
III. The overproduction of offspring
A. I and II only
B. I and III only
C. II and III only
D. I, II and III
A. I and II only
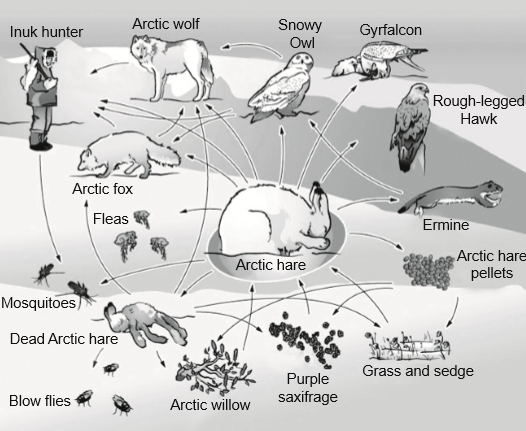
The image shows an Arctic food web.
What is the role of the Arctic hare?
A. Detritivore
B. Primary consumer
C. Secondary consumer
D. Saprotroph
B. Primary consumer
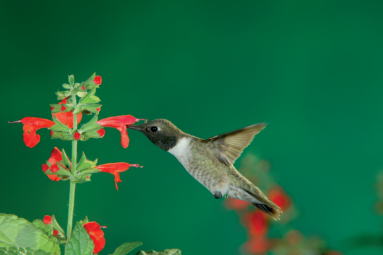
A hummingbird is shown visiting a large flower.
What makes this a mutualistic relationship?
A. The bird feeds on nectar and transfers pollen to the stamen of a flower of the same species.
B. The bird obtains nutrients and the plant is assisted with pollination for sexual reproduction.
C. The bird requires pollen as a protein source and, while obtaining this, disperses seeds for the plant.
D. The bird transfers pollen to the stigma of flowers of a different species while feeding.
B. The bird obtains nutrients and the plant is assisted with pollination for sexual reproduction.
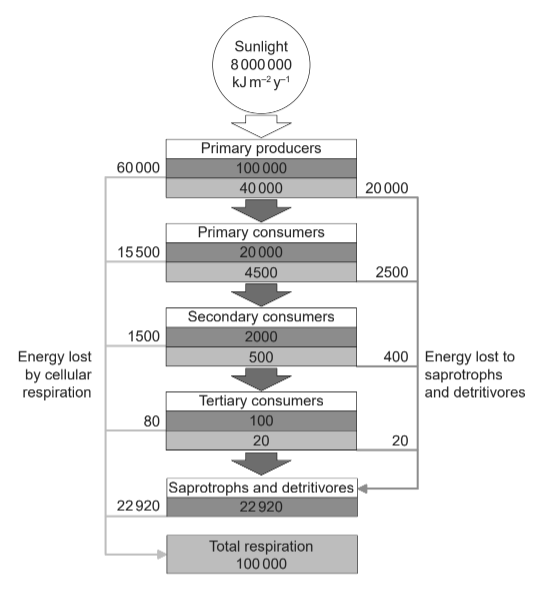
The diagram shows the flow of energy through an ecosystem in kJ m–2y–1.
What percentage of the energy passed from primary producers to primary consumers is lost to cellular respiration by tertiary consumers?
A. 0.001 %
B. 0.08 %
C. 0.2 %
D. 0.4 %
D. 0.4 %
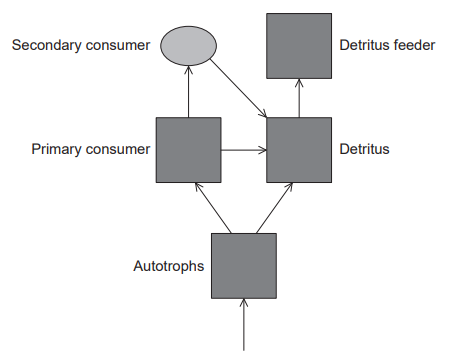
The diagram shows the energy flow between five “sinks” in a terrestrial ecosystem.
In a typical terrestrial ecosystem, which trophic level would have the highest biomass?
A. Autotrophs
B. Primary consumers
C. Secondary consumers
D. Detritus feeders
A. Autotrophs
What is lost between trophic levels in ecosystems and cannot be recycled?
A. Heat
B. Nitrogen
C. Carbon compounds
D. Biomass
A. Heat
What restricts the length of a food chain?
A. Energy losses between the trophic levels
B. A greater biomass at the higher trophic levels
C. The number of species in the food web
D. The consumption of waste by detritivores
A. Energy losses between the trophic levels
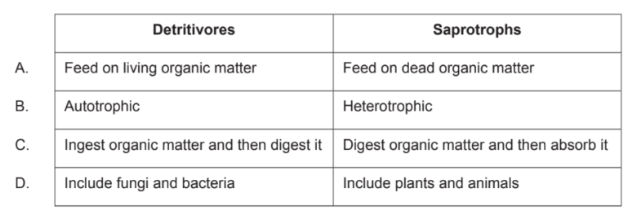
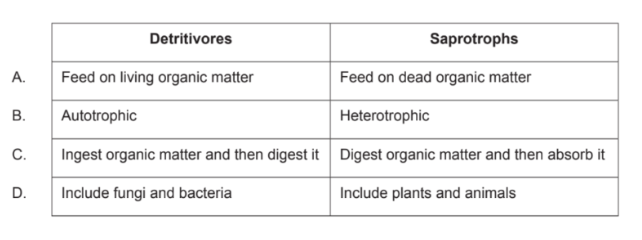
What is a difference between detritivores and saprotrophs?
C.
A self-sustaining system is set up in a sterile, sealed, transparent glass bottle with damp, sterilized soil and a small garden plant. If the system remains sterile, what could be the reason that the plant fails to grow and dies?
A. Lack of soil nutrients
B. Lack of oxygen
C. Lack of space
D. Lack of water
A. Lack of soil nutrients

The diagram represents a pyramid of energy.
What level does the letter X represent?
A. Light
B. Primary consumers
C. Abiotic environment
D. Producers
D. Producers
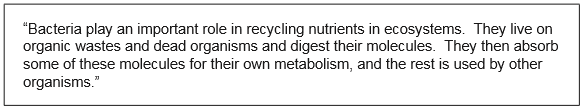
The statement is about the role of some bacteria in ecosystems.
What is the mode of nutrition of these bacteria?
A. They are autotrophs.
B. They are consumers.
C. They are saprotrophs.
D. They are detritivores.
C. They are saprotrophs.

The following shows an energy pyramid.
How is energy lost between trophic levels?
A. Photosynthesis, birth of an organism, and digestion
B. Respiration, death of an organism, and egestion
C. Recycling of nutrients, death of an organism, and egestion
D. Respiration, birth of an organism, and digestion
B. Respiration, death of an organism, and egestion
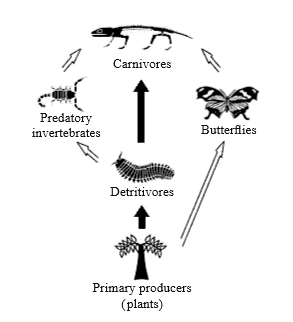
This question refers to the following food web.
The energy passing from the detritivores to the predatory invertebrates in this food web is 14 000 kJ m–2 year–1. Approximately how much energy (in kJ m–2 year–1) passes from the predatory invertebrates to the carnivores?
A. 140
B. 1400
C. 14 000
D. 140 000
B. 1400
A dichotomous key can be used to distinguish four types of plant. Which of the plants can be a bryophyte?
A.
A locust is an arthropod. For invertebrate groups, which recognition feature is found only in arthropods?
A. Bilateral symmetry
B. Jointed appendages
C. Wings
D. Segmented body
B. Jointed appendages
Which is a characteristic of both bryophyta and filicinophyta?
A. Vascular tissue
B. Membranous leaves
C. Release of spores
C. Release of spores
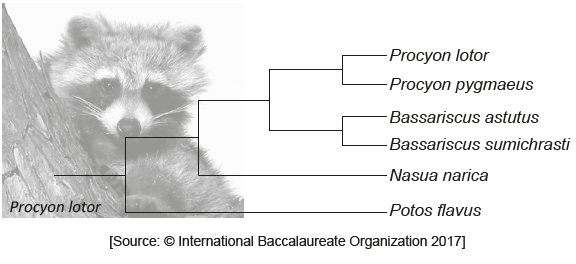
The diagram represents a cladogram of the family Procyonidae.
What would justify classifying these organisms into four different genera?
A. They live in different habitats.
B. They do not share any common ancestors.
C. There are enough differences between them.
D. The number of times that the species have split.
C. There are enough differences between them.
A plant has cambium in its vascular tissue and pollen is produced in male cones. The plant disperses seeds but does not produce fruit. In which phylum does this plant belong?
A. Coniferophyta
B. Angiospermophyta
C. Filicinophyta
D. Bryophyta
A. Coniferophyta
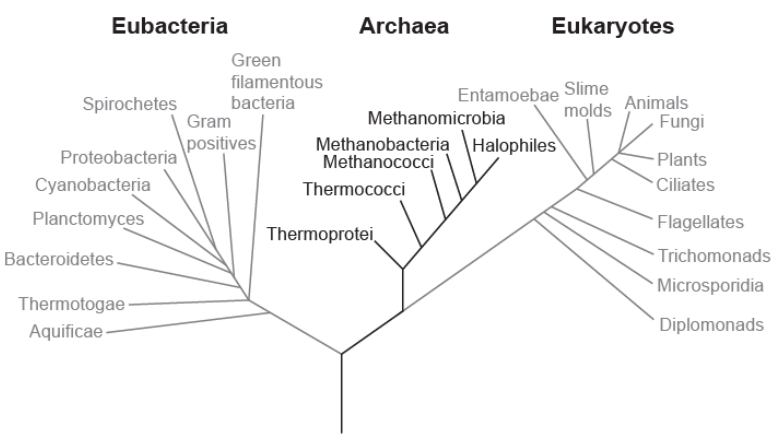
Below is a phylogenetic tree of the three domains. There are important differences between the three domains. Which of these domains have organelles?
A. Eubacteria and archaea
B. Archaea only
C. Eukaryotes and archaea
D. Eukaryotes only
D. Eukaryotes only
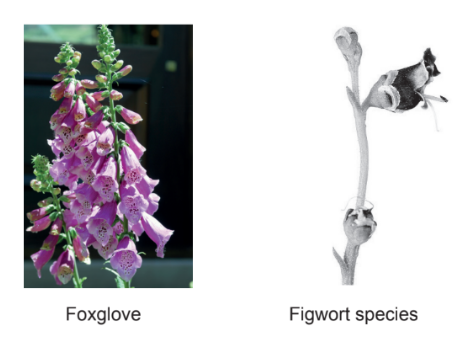
The foxglove, Digitalis purpurea, was once classified in the figwort family. The figwort family has been reclassified and is now much smaller.
Why were species such as the foxglove moved into other families?
A. The appearance was too dissimilar.
B. The plants are found in different locations.
C. The genera were different.
D. The DNA sequences indicated different ancestry.
D. The DNA sequences indicated different ancestry.
An animal shows radial symmetry, has only one opening leading to a digestive cavity and is soft without a skeleton. To which phylum does this animal belong?
A. Platyhelmintha
B. Annelida
C. Mollusca
D. Cnidaria
D. Cnidaria
The scientific name of the great egret has recently been changed from Casmerodius albus to Ardea alba.
What is a possible reason for the reclassification of egrets?
A. Allopatric speciation
B. Discovery of different ancestry
C. A change in the mating behaviours
D. Change in habitat and geographic range
B. Discovery of different ancestry
To which domain does Carcharodon carcharias, a shark, belong?
A. Eukaryote
B. Consumer
C. Fish
D. Chordata
A. Eukaryote
How can molluscs and platyhelminthes be distinguished?
A. Molluscs are unsegmented but platyhelminthes are segmented.
B. Molluscs have a mouth and an anus but platyhelminthes do not.
C. Molluscs are smooth but platyhelminthes have bristles.
D. Molluscs remain attached to rock but platyhelminthes move around in water.
B. Molluscs have a mouth and an anus but platyhelminthes do not.
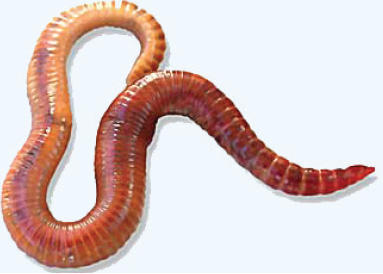
The photograph shows an animal of the species Eisenia fetida.
Which phylum does it belong to?
A. Cnidaria
B. Platyhelminthes
C. Annelida
D. Arthropoda
C. Annelida
The foxglove, Digitalis purpurea, was once classified in the figwort family. The figwort family has been reclassified and is now much smaller.
Why were species such as the foxglove moved into other families?
A. The appearance was too dissimilar.
B. The plants are found in different locations.
C. The genera were different.
D. The DNA sequences indicated different ancestry.
D. The DNA sequences indicated different ancestry.
What is a difference between aerobic respiration and anaerobic respiration in yeast?
A. Anaerobic respiration requires enzymes, aerobic respiration does not.
B. Anaerobic respiration requires glucose, aerobic respiration does not.
C. Anaerobic respiration produces ethanol, aerobic respiration does not.
D. Anaerobic respiration does not produce oxygen, aerobic respiration does
C. Anaerobic respiration produces ethanol, aerobic respiration does not.
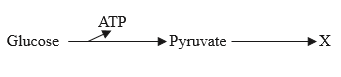
The diagram shows anaerobic respiration in yeast cells.
What would be produced at X?
A. ATP
B. Lactate
C. Ethanol and CO2
D. CO2 and H2O
C. Ethanol and CO2
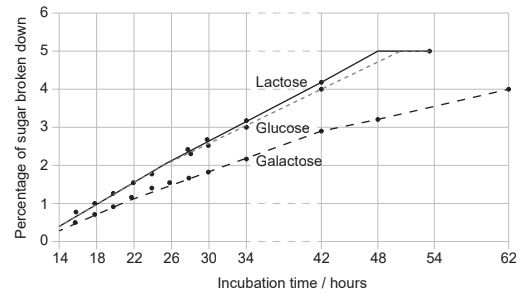
The graph shows the results of an experimental investigation that compared the rates at which lactose, glucose and galactose are broken down in the process of anaerobic cellular respiration by the yeast Torulopsis cremoris.
What can be concluded from these results?
A. Cellular respiration of lactose involves the production of glucose and galactose.
B. The breakdown of glucose and galactose occurs more slowly in the presence of lactose.
C. The rate of cellular respiration is greater for glucose than for lactose and galactose.
D. The percentage of sugar remaining after 42 hours is greater for galactose than glucose.
D. The percentage of sugar remaining after 42 hours is greater for galactose than glucose.
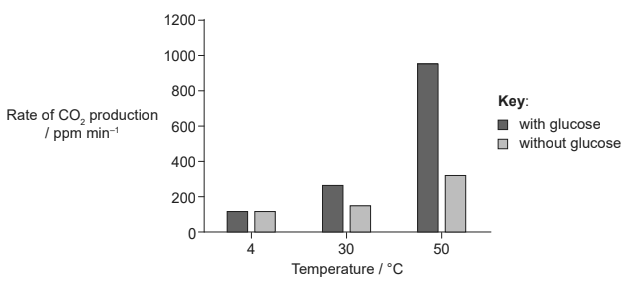
Yeast cells, Saccharomyces cerevisiae, were incubated with and without glucose at three different temperatures for a period of four minutes, during which the rate of CO2 production was measured with a CO2 sensor.
What conclusion can be drawn from the results of this experiment?
A. Yeast uses lipids rather than glucose in respiration at low temperatures.
B. Addition of glucose has a greater impact on rates of cell respiration at lower temperatures.
C. Rates of cell respiration increase with temperature.
D. More glucose is produced at higher temperatures.
C. Rates of cell respiration increase with temperature.
If a plant is exposed to light, which colour of light would lead to the lowest rate of oxygen release by a green plant?
A. Blue
B. Red
C. Green
D. White
C. Green
What do chloroplasts and mitochondria have in common?
A. Both are found in the cells of Filicinophyta.
B. Both contain grana.
C. Both occur in all eukaryotic cells.
D. Both are found in a Paramecium.
A. Both are found in the cells of Filicinophyta.
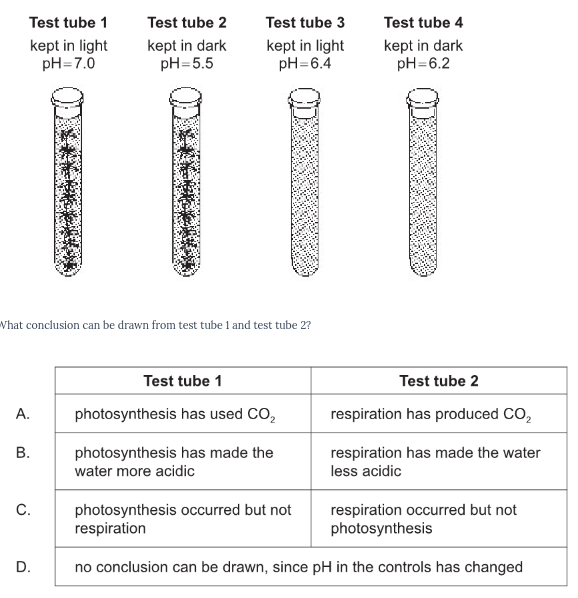
An experiment was set up so that each test tube contained water at a pH of 6.3 and a pH indicator. Test tubes 1 and 2 also contained a common pond autotroph. Carbon dioxide dissolves in water and forms carbonic acid. After three days the four test tubes were found to have these results.
What conclusion can be drawn from test tube 1 and test tube 2?
A.
What is a feature of shorter wavelength visible radiation?
A. It includes violet light.
B. It has less energy per photon than longer wavelengths.
C. It is absorbed by greenhouse gases.
D. It is reflected by chlorophyll.
A. It includes violet light.
Oxygen is produced during photosynthesis. What is the source of this oxygen inside the plant?
A. Air spaces in the leaf
B. Carbon dioxide
C. Glucose
D. Water
D. Water
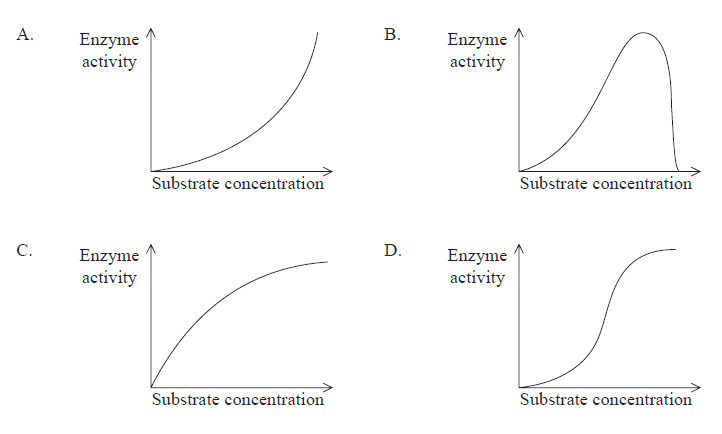
Which of the following graphs shows the relationship between substrate concentration and enzyme activity with a fixed concentration of enzyme?
C,
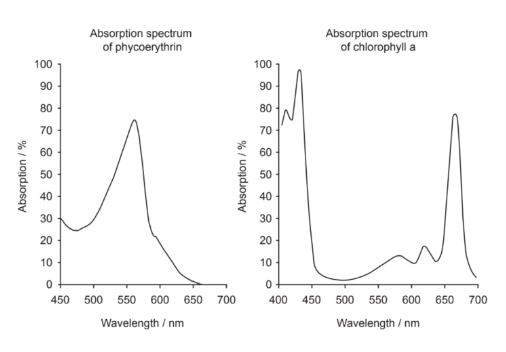
Absorption spectra of two photosynthetic pigments are shown. Phycoerythrin is a red pigment found in many marine red algae, while chlorophyll a is the major pigment in green plants and algae.
What do the absorption spectra show about the pigments?
A. Phycoerythrin absorbs mostly red light.
B. Chlorophyll a reflects more green light than phycoerythrin.
C. Chlorophyll a photosynthesizes more at 550 nm than phycoerythrin.
D. Phycoerythrin does not absorb blue light.
B. Chlorophyll a reflects more green light than phycoerythrin.
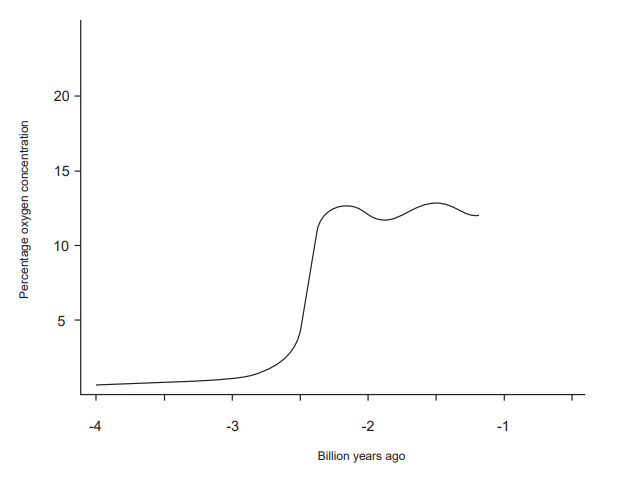
The graph shows atmospheric oxygen levels over time.
About 2.5 billion years ago, a significant rise in atmospheric oxygen occurred. What was the cause of this rise?
A. Photosynthesis by non-vascular land plants
B. Photosynthesis by vascular land plants
C. Oxygen produced by photosynthetic bacteria being released from the ocean into the atmosphere
D. Volcanic activity
C. Oxygen produced by photosynthetic bacteria being released from the ocean into the atmosphere
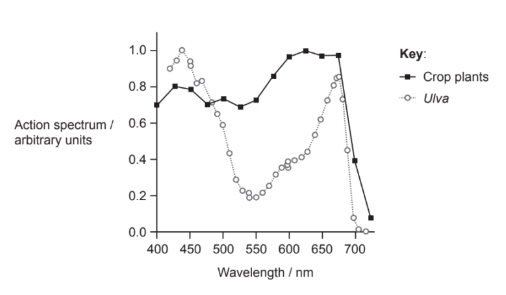
The action spectra for two different types of photosynthetic organisms are shown. Ulva, or sea lettuce, is a green marine alga composed of two layers of cells. The action spectrum for crop plants was plotted from an average of 22 species of plants.
What describes photosynthesis in these organisms?
A. Ulva photosynthesizes more than crop plants at red wavelengths.
B. Crop plants photosynthesize more than Ulva in green light.
C. Photosynthesis by Ulva is highest in red light while that of crop plants is highest in blue.
D. Both have zero photosynthesis at 750nm.
B. Crop plants photosynthesize more than Ulva in green light.
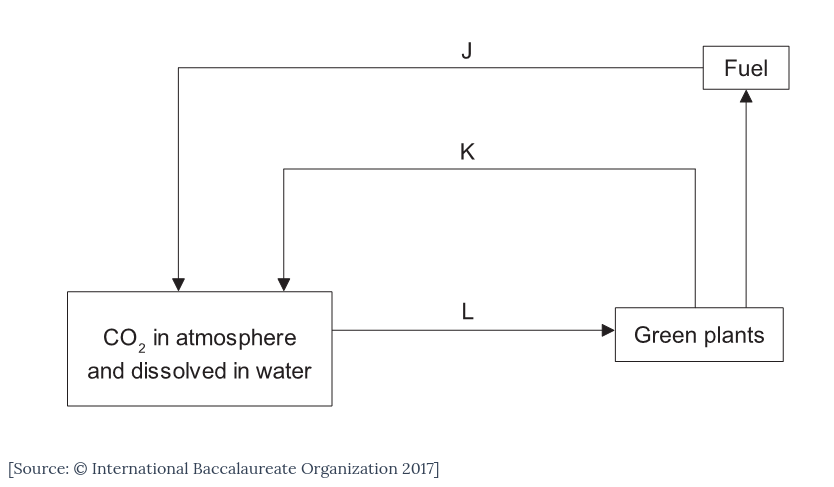
The diagram shows the carbon cycle.
Which two processes correspond to the labelled arrows?
A. K is combustion and L is catabolism.
B. J is anabolism and K is respiration.
C. J is combustion and K is respiration.
D. J is anabolism and L is catabolism.
C. J is combustion and K is respiration.
What favours the production of peat?
I. Presence of organic matter
II. Anaerobic conditions
III. Acidic conditions
A. I and II only
B. I and III only
C. II and III only
D. I, II and III
D. I, II and III
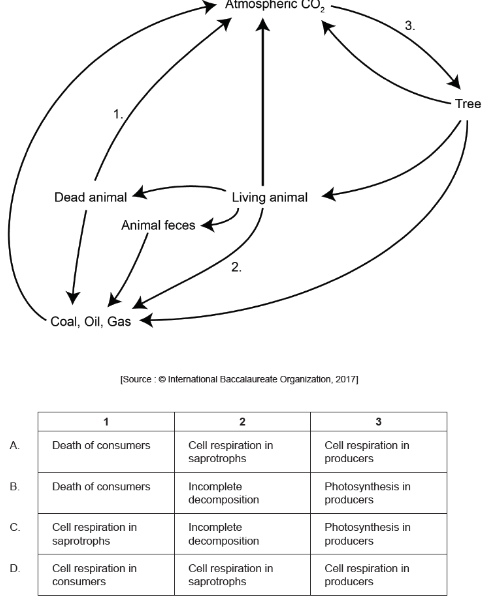
The diagram shows a version of the carbon cycle. What is indicated by the numbers?
C.
Carbon sinks are any reservoirs that absorb and store carbon dioxide from the atmosphere. Which process increases the size of the carbon sink in oceans?
A. Photosynthesis
B. Respiration
C. Ocean acidification
D. Decomposition
A. Photosynthesis
Which organisms produce methane in anaerobic environments such as waterlogged soils?
A. Archaea
B. Fungi
C. Eukaryotes
D. Eubacteria
A. Archaea
Methanogens produce methane gas. What is this gas converted to in the atmosphere?
A. Carbon dioxide and oxygen
B. Ethanol and carbon dioxide
C. Carbon monoxide and ozone
D. Carbon dioxide and water
D. Carbon dioxide and water
How is peat formed?
A. From methanogenic archaeans under anaerobic and acidic conditions in deep sea vents
B. From partially decomposed organic matter under anaerobic and acidic conditions in waterlogged soils
C. From porous limestone under high pressure, aerobic and alkaline conditions in ocean beds
D. From bituminous coal under high pressure, anaerobic and acidic conditions below ground
B. From partially decomposed organic matter under anaerobic and acidic conditions in waterlogged soils
Which hypothesis is supported by evidence from ecological research?
A. Decomposers are the final stage in the food chain.
B. Producers depend upon consumers more than on decomposers.
C. Decomposers help to recycle energy from food chains.
D. Producers use nutrients that decomposers help to recycle.
D. Producers use nutrients that decomposers help to recycle.
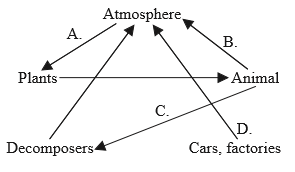
The diagram is a representation of a carbon cycle. Which arrow will reduce the greenhouse effect?
A.
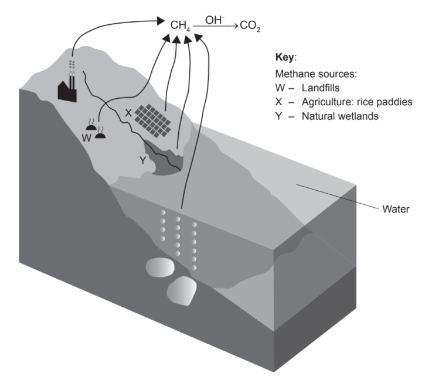
The diagram shows part of the carbon cycle involving methane.
Which conditions favour methane production in W,X and Y ?
A. Presence of eubacteria and organic matter
B. Presence of archaeans and waterlogged soil
C. Presence of eubacteria and waterlogged soil
D. Presence of archaeans and oxygen
B. Presence of archaeans and waterlogged soil
Which gases have made the most significant contributions to global warming?
A. Water and carbon dioxide
B. Carbon dioxide and methane
C. Methane and nitrous oxide
D. Carbon dioxide and ozone
A. Water and carbon dioxide
Euglena is a unicellular organism that feeds on bacteria and uses CO2 as a carbon source. Which describes the nutrition of this organism?
A. Autotrophic only
B. Heterotrophic only
C. Saprotrophic only
D. Autotrophic and heterotrophic
D. Autotrophic and heterotrophic
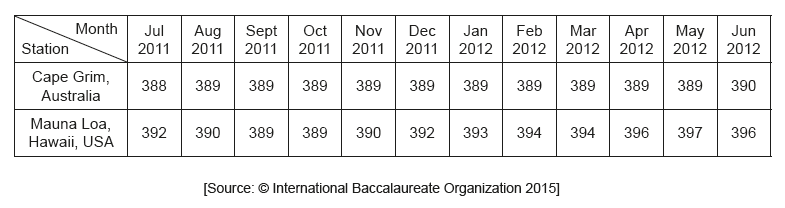
The table shows the monthly CO2 concentrations in mg L–1 taken at two monitoring stations.
What is directly indicated by the data?
A. CO2 concentration in the atmosphere varies from place to place.
B. Cape Grim is less affected by global warming than Mauna Loa.
C. CO2 creates a greenhouse effect at both locations.
D. The standard deviation for Cape Grim is higher than standard deviation for Mauna
A. CO2 concentration in the atmosphere varies from place to place.
What contributes to the enhanced greenhouse effect?
A. Ozone from violent thunderstorms
B. Carbon particles in diesel engine exhaust
C. Methane from agricultural sources
D. Carbon dioxide from active volcanoes around the world
C. Methane from agricultural sources
Which gases have made the most significant contributions to global warming?
A. Water and carbon dioxide
B. Carbon dioxide and methane
C. Methane and nitrous oxide
D. Carbon dioxide and ozone
A. Water and carbon dioxide
By which mechanism do greenhouse gases contribute to global warming?
A. Their higher concentration absorbs more long wave radiation coming from the Sun.
B. Short wave radiation emitted from the Earth’s surface increases with their concentration.
C. They absorb higher amounts of long wave radiation emitted from the Earth’s surface as their concentration increases.
D. They absorb higher amounts of short wave radiation caused by increased combustion of fossilized organic matter.
C. They absorb higher amounts of long wave radiation emitted from the Earth’s surface as their concentration increases.
What contributes to the enhanced greenhouse effect?
A. Ozone from violent thunderstorms
B. Carbon particles in diesel engine exhaust
C. Methane from agricultural sources
D. Carbon dioxide from active volcanoes around the world
C. Methane from agricultural sources
Human activity leading to the emission of greenhouse gases may be a cause of global warming. According to the precautionary principle, what should be done about greenhouse gas emission?
A. Analyze historical records from monitoring stations to see the trends in carbon dioxide emissions
B. Obtain more evidence by carrying out research on greenhouse gas emission
C. Take measures to lower greenhouse gas emission without further evidence
D. Develop strategies for coping with higher global temperatures
C. Take measures to lower greenhouse gas emission without further evidence
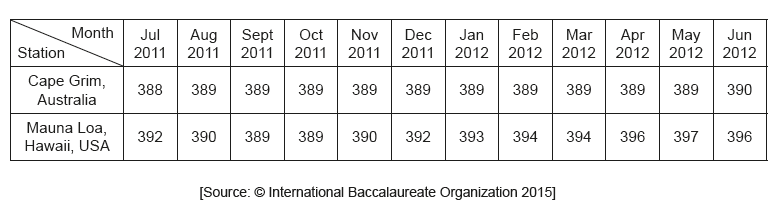
The table shows the monthly CO2 concentrations in mg L–1 taken at two monitoring stations.
What is directly indicated by the data?
A. CO2 concentration in the atmosphere varies from place to place.
B. Cape Grim is less affected by global warming than Mauna Loa.
C. CO2 creates a greenhouse effect at both locations.
D. The standard deviation for Cape Grim is higher than standard deviation for Mauna Loa.
A. CO2 concentration in the atmosphere varies from place to place.